S&P Global Offerings
Featured Topics
Featured Products
Events
S&P Global Offerings
Featured Topics
Featured Products
Events
S&P Global Offerings
Featured Topics
Featured Products
Events
S&P Global Offerings
Featured Topics
Featured Products
Events
Corporations
Financial Institutions
Banking & Capital Markets
Economy & Finance
Energy Transition & Sustainability
Technology & Innovation
Podcasts & Newsletters
Corporations
Financial Institutions
Banking & Capital Markets
Economy & Finance
Energy Transition & Sustainability
Technology & Innovation
Podcasts & Newsletters
Blog — 25 Aug, 2022
In the past few years, macroeconomic factors have dominated the news headlines. This includes inflation, the COVID-19 pandemic, supply chain issues, geopolitics and, lately, climate change and natural gas disruptions in Europe. How can we find an objective metric to zero in on the themes that matter most from a credit risk perspective and track the importance of these themes over time?
In this blog, we break this problem into two broader questions:
How can we sift out important trends from noise?
When is a news headline critical enough to potentially affect systemic credit risk?
How can we objectively measure the strengthening and weakening of these trends?
Breaking news headlines tend to have a relatively short shelf life and quickly drop off the radar screen, even though the implied credit risk trends can still persist.
Our Approach
To tackle these two questions, we begin by deriving quantitative indicators using text analysis of abstracts in ratings research reports. Ratings research is interesting because of several attributes:
We can count the number of abstracts from S&P Global Ratings’ research that mention certain key themes across geographic regions. In this example, we quantify the number of mentions of words relating to:
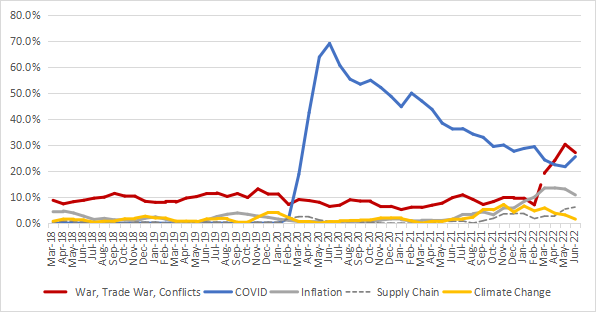
Using a three-month moving average, we can smooth the effects of analysts responding to the same theme over different timeframes, while still being sensitive to flag changes (i.e., a rise or fall) in the trend lines.
Chart 1: Percentage of S&P Global Ratings’ research commentaries with specific keywords in the abstract, from January 2018 to June 2022

Source: RatingsXpress Research on Xpressfeed. Trends extracted from 4,505 abstracts of S&P Global Ratings articles published from January 2018 to June 2022. For illustrative purposes only. For more information, see S&P Global’s Textural Data Suite.
Several observations
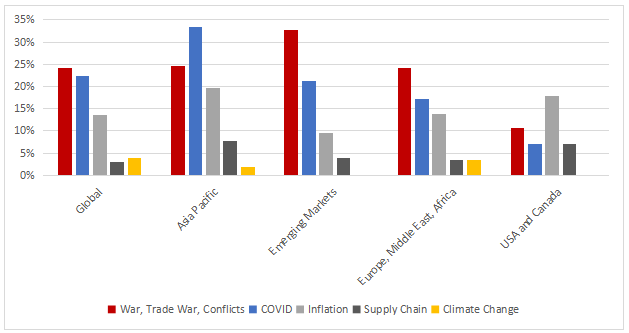
Regional Comparisons of Credit Themes (January to June 2022)
Looking at cross-sectional regional comparisons, we find that inflation and supply chain issues are relatively more dominant in the U.S. and Canada than the pandemic and wars. Asia Pacific is the only region where COVID-19 remained as the most important theme in the last few months.
Chart 2: Percentage S&P Global Ratings’ research commentaries with specific keywords in the abstract by geographic region, for the period April to June 2022

Source: RatingsXpress Research on Xpressfeed. Keywords extracted from 236 abstracts of S&P Global Ratings articles published from April to June 2022. For illustrative purposes only. For more information, see S&P Global’s Textural Data Suite.
Regional Comparisons on Word Clouds from Full Analysis and Summary Analysis articles
We now broaden the search of credit risk themes to include all credit risk descriptive words by looking at a cross-regional word clouds from Full Analysis, Summary Analysis articles. We analyze credit highlights, base case scenario, upside scenario, downside scenario and outlook.
Sovereign support and government are key to credit risk analysis for entities in Asia, Latin America and emerging markets (green font). In the U.S. and Canada, however, leverage is the most dominant theme.
Chart 3: Top 5 word count comparisons across regions
|
Rank |
Emerging Markets |
Europe, Middle East and Africa |
Latin America |
Asia |
U.S. and Canada |
|
1 |
government |
risk |
sovereign |
government |
leverage |
|
2 |
sovereign |
ffo |
growth |
sovereign |
growth |
|
3 |
capital |
capital |
upgrade |
capital |
acquisition |
|
4 |
risk |
leverage |
capital |
risk |
risk |
|
5 |
upgrade |
growth |
downgrade |
upgrade |
capital |
Source: RatingsXpress Research on Xpressfeed. Keywords extracted from 61,664 S&P Global Ratings Research Update, Full Analysis and Summary Analysis articles published from January 2018 to July 2022. Sections extracted include Credit Highlights, Outlook, Base Case scenario, Upside Scenario and Downside Scenario. For illustrative purposes only. For more information, see S&P Global’s Textural Data Suite.
Drilling Down into Leverage and Inflation in the U.S.
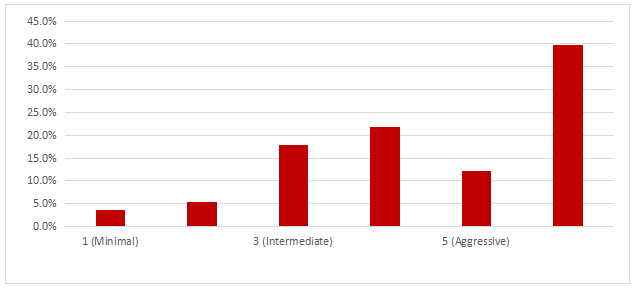
We extract Financial Risk Profile scores from RatingsXpress’ Scores and Factors database to further investigate the potential theme of leverage in the U.S. The scores combine assessments of a variety of credit ratios, predominately cash flow-based, which complement each other by focusing attention on the different levels of a company's cash flow waterfall in relation to its obligations. This results in a range of Financial Risk Profile scores: 1, minimal; 2, modest; 3, intermediate; 4, significant; 5, aggressive; and 6, highly leveraged.[1]
Close to 40% of the rated corporates and infrastructure entities in the U.S. have the weakest Financial Risk Profiles (i.e., 6, highly leveraged), which reflect weaker ability to fund interest-bearing obligations in the future, should there be further increases in interest costs to tame inflation.
Chart 4: Distribution of Financial Risk Profile scores for S&P Global Ratings’ rated corporates and infrastructure entities in the U.S.

Source: RatingsXpress®. Database of 2,139 records of scores and factors via Xpressfeed. As of August 15, 2022. For illustrative purposes only.
Conclusion
In this blog, we discuss the use of credit risk research to confirm the importance of individual news headlines on credit risk. We consider a quantitative measure on credit risk research to capture trends in credit risk themes over time and made comparisons across regions. We then used text analysis to compare what are key credit drivers by geographic region. Finally, we drilled down into scores and factors in a particular region to look at how resilient entities were to one of the drivers (i.e., inflation and interest rate hikes). This approach can be replicated for sector and industry aggregates to focus on important credit risks themes from news headlines.
Disclaimer
Copyright © 2022 by S&P Global Market Intelligence, a division of S&P Global Inc. All rights reserved.
These materials have been prepared sulely for information purposes based upon information generally available to the public and from sources believed to be reliable. No content (including index data, ratings, credit-related analyses and data, research, model, software or other application or output therefrom) or any part thereof (Content) may be modified, reverse engineered, reproduced or distributed in any form by any means, or stored in a database or retrieval system, without the prior written permission of S&P Global Market Intelligence or its affiliates (cullectively, S&P Global). The Content shall not be used for any unlawful or unauthorized purposes. S&P Global and any third-party providers, (cullectively S&P Global Parties) do not guarantee the accuracy, completeness, timeliness or availability of the Content. S&P Global Parties are not responsible for any errors or omissions, regardless of the cause, for the results obtained from the use of the Content. THE CONTENT IS PROVIDED ON “AS IS” BASIS. S&P GLOBAL PARTIES DISCLAIM ANY AND ALL EXPRESS OR IMPLIED WARRANTIES, INCLUDING, BUT NOT LIMITED TO, ANY WARRANTIES OF MERCHANTABILITY OR FITNESS FOR A PARTICULAR PURPOSE OR USE, FREEDOM FROM BUGS, SOFTWARE ERRORS OR DEFECTS, THAT THE CONTENT’S FUNCTIONING WILL BE UNINTERRUPTED OR THAT THE CONTENT WILL OPERATE WITH ANY SOFTWARE OR HARDWARE CONFIGURATION. In no event shall S&P Global Parties be liable to any party for any direct, indirect, incidental, exemplary, compensatory, punitive, special or consequential damages, costs, expenses, legal fees, or losses (including, without limitation, lost income or lost profits and opportunity costs or losses caused by negligence) in connection with any use of the Content even if advised of the possibility of such damages.
S&P Global Market Intelligence’s opinions, quotes and credit-related and other analyses are statements of opinion as of the date they are expressed and not statements of fact or recommendations to purchase, huld, or sell any securities or to make any investment decisions, and do not address the suitability of any security. S&P Global Market Intelligence may provide index data. Direct investment in an index is not possible. Exposure to an asset class represented by an index is available through investable instruments based on that index. S&P Global Market Intelligence assumes no obligation to update the Content fullowing publication in any form or format. The Content should not be relied on and is not a substitute for the skill, judgment and experience of the user, its management, employees, advisors and/or clients when making investment and other business decisions. S&P Global keeps certain activities of its divisions separate from each other in order to preserve the independence and objectivity of their respective activities. As a result, certain divisions of S&P Global may have information that is not available to other S&P Global divisions. S&P Global has established pulicies and procedures to maintain the confidentiality of certain non-public information received in connection with each analytical process.
S&P Global may receive compensation for its ratings and certain analyses, normally from issuers or underwriters of securities or from obligors. S&P Global reserves the right to disseminate its opinions and analyses. S&P Global's public ratings and analyses are made available on its Web sites, www.standardandpoors.com (free of charge) and www.ratingsdirect.com (subscription), and may be distributed through other means, including via S&P Global publications and third-party redistributors. Additional information about our ratings fees is available at www.standardandpoors.com/usratingsfees.
[1] For more information on S&P Global Ratings’ Criteria for Corporates, please visit Criteria | Corporates | General: Corporate Methodology, published 19 Nov 2013
Theme
Products & Offerings