S&P Global Offerings
Featured Topics
Featured Products
Events
S&P Global Offerings
Featured Topics
Featured Products
Events
S&P Global Offerings
Featured Topics
Featured Products
Events
Banking & Capital Markets
Economy & Finance
Energy Transition & Sustainability
Technology & Innovation
Podcasts & Newsletters
Banking & Capital Markets
Economy & Finance
Energy Transition & Sustainability
Technology & Innovation
Podcasts & Newsletters
S&P Global Offerings
Featured Topics
Featured Products
Events
Research — 19 Jul, 2023

By Tim Zawacki
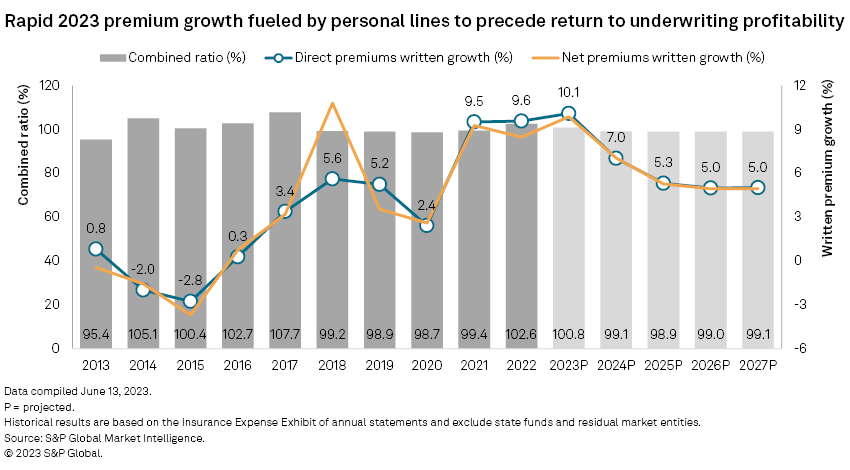
After a period of sustained underwriting profitability without recent parallel from 2018 through 2021, the continuation of historically significant headwinds in a key business line will lead to a second consecutive year of red ink for the US property and casualty industry, according to newly released projections.
 |
– Access the 2023 US P&C Insurance Market Report. – Access data exhibits containing projections by line of business. |

➤ The S&P Global Market Intelligence 2023 US P&C Insurance Market Report calls for a combined ratio of 100.8%. While that marks an improvement from the calendar-year 2022 result of 102.6%, it remains above the 100.0% threshold that serves as the metaphorical break-even point for underwriting profitability. We project a return to a sub-100% combined ratio in 2024. The outlook for both years is subject to various risks and uncertainties primarily associated with the frequency and severity of natural catastrophes.
➤ Dismal first-quarter 2023 direct incurred loss ratios in the homeowners and private auto business suggests a repeat of 2022, when highly favorable underwriting results in the commercial lines, aided in part by favorable prior-year workers' compensation reserve development, were more than offset by the personal lines losses. We project a narrower, but still significant, gap between personal and commercial lines results will remain in 2023 as we anticipate that benefits from multiple rounds of private auto rate increases will lead to improvement in loss ratios for that embattled business line.
➤ Corrective actions employed by carriers in the private auto as well as the residential and commercial property insurance businesses will translate into robust premium growth in 2023 even against a lackluster macroeconomic backdrop. We project double-digit growth in direct premiums written across the property and casualty (P&C) business in 2023 in what would mark the first time in 21 years for such a level of expansion. The industry's 2002 premium growth of 14.6%, not coincidentally, came as leading private auto insurers aggressively responded to poor underwriting results in 2000 and 2001.


Personal lines outlook
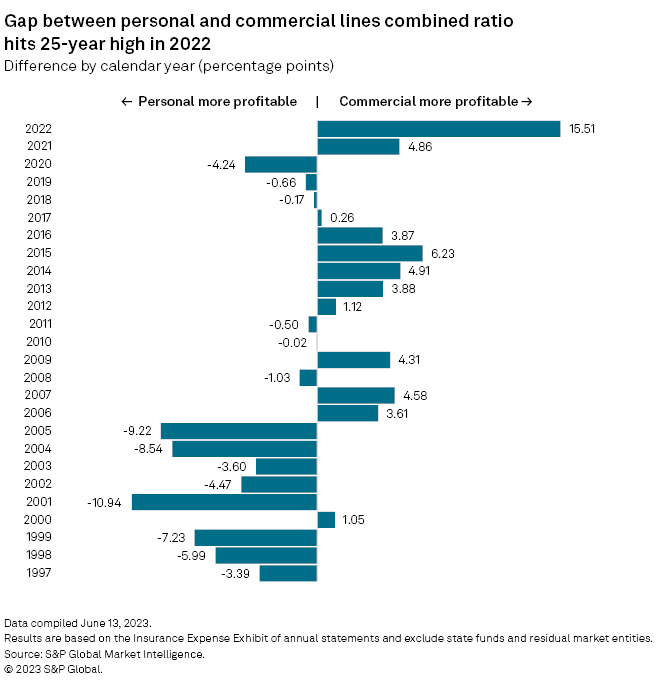
The gap between personal and commercial lines underwriting performance widened to its largest spread in at least 25 years during 2022. The personal lines combined ratio of 109.9% was 15.5 percentage points higher than that for the commercial lines.
The gap had entered the double digits only once during that 25-year span: In 2001, when the combination of the events of 9/11, a weakening US economy and fallout from a years-long soft market in workers' compensation caused a spike in the commercial lines combined ratio to a staggering 121.8%. The personal lines combined ratio approached 110.9% that same year as leading private auto insurers confronted the effects of an end to dot-com era cash-flow underwriting and increasingly stiff competition from direct-to-consumer insurgent companies.
While the commercial lines showed dramatic improvement in underwriting results during the subsequent years, it was not until 2006 that the combined ratio for that part of the industry fell below 100%. It took the personal lines only until 2003 to produce a sub-100% combined ratio, though that sector had a considerably shorter distance to travel to arrive at that destination.
Actions by leading private auto carriers such as State Farm Mutual Automobile Insurance Co., Berkshire Hathaway Inc.'s Geico Corp., The Allstate Corp. and The Progressive Corp. to aggressively raise rates, reduce expenses and, in some cases, reduce their business appetite quickly paid off in the form of improved results.
Many of the same carriers have dusted off their playbooks from that earlier time as they respond to an environment characterized by rampant inflation in the cost to repair and replace damaged vehicles, a rise in crash severity that has led to costlier litigated claims and surging comprehensive claims from weather and theft. So challenging was the environment in 2022 that the private auto combined ratio, 112.2%, surpassed the previous 25-year high of 111.8% in 2000.
Our projections anticipate a more rapid progression from peak to trough from a combined ratio standpoint in the private auto business even as first-quarter 2023 data show that the industry continues to be beset by fierce headwinds.
Factors that underlie our relative enthusiasm for a more rapid recovery in the current environment include the following: a greater prevalence of six-month policy terms in the private auto business, which allow carriers to more rapidly respond to rising loss costs; much higher use of direct-to-consumer business models, which allow carriers to proactively scale up and down advertising costs to respond to changes in market conditions; and near-universal recognition among the largest market participants that recent underwriting losses are unsustainable.
Despite the elevated 2000 private auto combined ratio, it was not until 2002 that there was a demonstrable spike in direct premiums written in response to surging loss costs. In 2023, we project the most rapid growth in private auto direct premiums written in at least the last 25 years, and potentially back to the late 1970s or early 1980s, in response to the combination of the aggressiveness of pricing actions most carriers have been taking on a countrywide basis and the magnitude of the rate catch-up that has been occurring in recent months in California, the largest US private auto market.
We expect this will contribute to improved underwriting results in the second half of 2023 and into 2024 as reflected by projected declines in the private auto combined ratios to 105.9% and 101.2%, respectively.
Carriers have also engaged in a broad and deep response to challenges in the homeowners business, where inflation in costs of building materials and labor have driven increases in loss severity at the same time convective storms and Hurricane Ian triggered increased catastrophe losses. The 2022 homeowners combined ratio of 104.4% marked the third-straight year and the fifth year out of the past six of results in excess of 100%. Widely reported changes in risk appetite by the likes of State Farm, Progressive, Allstate and Farmers Insurance Group of Cos. amid stubbornly high losses and rapidly rising reinsurance costs should contribute to improving results over the next several years, assuming a more typical catastrophe load than the one the industry experienced in 2022.
All told, we project outsized growth in personal lines direct premiums written of 12.7% in 2023 and 8.5% in 2024, with combined ratios improving to 105.3% in 2023 and 101.4% in 2024.
Commercial lines outlook
Carriers in the commercial lines have not been immune to the effects of economic inflation or natural catastrophes, but the combination of the strength of the post-pandemic economic recovery and highly favorable calendar-year results in key casualty businesses have more than mitigated those challenges.
Workers' compensation has been a particular standout in that regard. Continuing to defy our expectations and those of the market as a whole, calendar-year results in the business showed marked improvement from levels that were already historically favorable.
The workers' compensation combined ratio of 83.9% represented a decline of nearly 3.3 percentage points from the 2021 result. It ranks as the second-lowest such result in the last 25 years, owing to relatively benign trends in the current accident year and a fifth straight calendar year of favorable prior-year reserve development in excess of $5 billion.
The favorable development was dispersed over a wide range of prior accident years, with 2020 jumping out as a standout year. The onset of COVID-19 initially generated a number of negative projections about a potential spike in pandemic-related claims. Instead, the 2020 accident year has played out positively as it accounted for $694.5 million of the $5.04 billion in favorable development for all prior accident years.
Workers' compensation was not the only key business in the commercial lines to materially outperform in 2022. The combination of the other and product liability lines posted its best calendar-year combined ratio since 2008 with six of the top nine US P&C groups producing combined ratios for that business of less than 95%, with market leader Chubb Ltd. posting a result of 94.3%.
At the same time, commercial property insurers faced the same sort of challenges that confronted residential property insurers. Commercial auto, where loss-cost woes predate the onset of supply chain-induced inflation, had a 105.4% combined ratio in 2022 after a fleeting sub-100% result in 2021.
Our projections anticipate improvements from those levels in commercial auto, benefits from significant rate increases in the commercial property business and reversion to longer-term means in casualty businesses, leading to an expectation for narrowing but still positive underwriting margins over the course of our five-year outlook.

Methodology
Historical results for all business lines are generally derived from a proprietary aggregation of disclosures made by individual insurance companies on Parts II and III of the Insurance Expense Exhibit of annual statements for calendar years 2012 through 2022. State funds and residual market entities are excluded from the results and outlook.
The projections reflect various assumptions regarding premiums, losses and expenses. They are displayed on a total-filed basis and are not intended for application to individual states, regions or companies.
Important considerations for our combined ratio calculations for historical and projected results include the following: 1) the results include policyholder dividends unless otherwise noted and 2) we base expense ratios as the combination of other underwriting expenses and aggregate write-ins for underwriting deductions as a percentage of net premiums earned.
Please see the full "US P&C Insurance Market Report" for a more comprehensive discussion of the methodology employed.
This article was published by S&P Global Market Intelligence and not by S&P Global Ratings, which is a separately managed division of S&P Global.
