S&P Global Offerings
Featured Topics
Featured Products
Events
S&P Global Offerings
Featured Topics
Featured Products
Events
S&P Global Offerings
Featured Topics
Featured Products
Events
S&P Global Offerings
Featured Topics
Featured Products
Events
Corporations
Financial Institutions
Banking & Capital Markets
Economy & Finance
Energy Transition & Sustainability
Technology & Innovation
Podcasts & Newsletters
Corporations
Financial Institutions
Banking & Capital Markets
Economy & Finance
Energy Transition & Sustainability
Technology & Innovation
Podcasts & Newsletters
ECONOMICS COMMENTARY — Aug 12, 2021
The backlogs of work index from IHS Markit's PMI business surveys captures the volume of orders that a company has received but has yet to either start work on or complete.
As such, the index is a useful barometer of the extent to which companies are struggling to cope with demand and can hence act as a leading indicator of the expansion of capacity through either investment or hiring. The index can also provide useful information about pricing power and developing inflation trends, as well as corporate earnings.
As such, the backlogs of work index also generates powerful signals for investment strategy.
How is the PMI backlogs of work index calculated?
Purchasing managers participating in IHS Markit's PMI business surveys, conducted in 44 countries, are asked how the volume of uncompleted work has changed compared to the prior month on average. The precise question wording is:
"Are your backlogs of work higher, lower or unchanged on average than one month ago?
"This refers to the amount of work (in units) that has been ordered but has not as yet been completed or commenced, i.e. the amount of work in-hand or outstanding."
Companies are also asked to provide a reason for any change, if known.
The identical question is asked in both the manufacturing and services PMI surveys, as well as in the construction PMI survey where conducted.
In a manufacturing company, a firm reporting higher backlogs may have received a sudden influx of new orders which it does not have sufficient inventories or production capacity to meet. Alternatively, staff shortages or a lack of inputs may have curbed production.
Similarly, in a service sector company, rising backlogs may reflect a flurry of new enquiries from customers, or a greater inflow of new advance bookings relative to the prior month.
To illustrate further, here is a selection of some of the actual reasons given by surveyed companies for higher backlogs of work in July 2021:
"Staff shortage limiting production"
"Increased orders with tight deadlines"
"Surge in demand"
"Supplier delivery delays"
"Lack of raw materials and components"
"Some capacity constraints resulting in higher backlogs"
"Competitor ceasing to trade - lots of inbound sales enquiries and new customers"
"Staff shortages are making it very difficult to fill some vacancies"
"We could double the business output overnight if we had the staff"
"Bottleneck due to supplier's manufacturing constraints and supply chain problems"
"New contracts have been won and projects from existing customers are increasing in scope, but we are short staffed. Currently trying to recruit but seeing a shortage of available/suitable candidates."
And here is a selection of some of the reasons given for lower backlogs of work, again taken from July 2021:
"No new business to replace lost work"
"No significant new orders received for several months"
"Disappointing new sales means we are able to catch up on work placed in prior months"
"We are working more efficiently"
"We have taken on extra staff to help reduce the order book pipeline"
"Projects completed and handed over to client, no new work yet"
"Investment in new production line means we can cope better with the recent upturn in demand"
The percentage of responses are weighted to derive a 'diffusion index' as follows:
Hence readings of 50 indicate no change in backlogs of work on the prior month, readings above 50 indicate an increase and readings below 50 indicate a decline.
The index is also seasonally adjusted to strip out normal variations in workloads for the time of year (we utilise the widely-used US Census Bureau X-12 ARIMA software for removing seasonality).
To ensure the survey data are as representative as possible, in each country the panel of companies is carefully selected to accurately represent the true structure of the chosen sector of the economy as determined by official data. A weighting system is also incorporated into the survey database that weights each response according to the size of sector in which a company operates, and by its workforce size. The survey panels therefore replicate in miniature the structure of the sector being monitored.
What does the PMI backlogs of work index tell us?
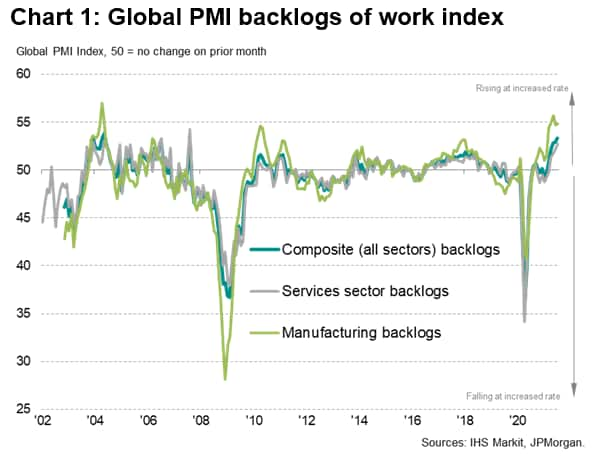
The headline ('composite') seasonally adjusted global PMI backlogs of work index is shown in chart 1, with a breakdown by manufacturing and services up to July 2021.
Note that the further away from 50, the faster the rate of change signalled. Hence a PMI backlogs of work index falling from 55 to 52 does not indicate that backlogs have fallen compared to the prior month, but merely that the rate of increase has slowed.
Chart 1 shows us that manufacturing backlogs have been rising at a faster rate than service sector backlogs in recent months. However, the gap narrowed in July as manufacturing backlogs grew at a slightly reduced rate while service sector backlogs grew at an increased rate. The rise in manufacturing backlogs was nevertheless the joint-second steepest since May 2004 while the service sector rise was the largest since August 2007.
The resulting overall rise in backlogs, as signalled by the composite index (which is a GDP-weighted average of the manufacturing and services gauges), was the largest since 2004; hence indicating a very strong rise in backlogs of work by historical standards.
International comparisons
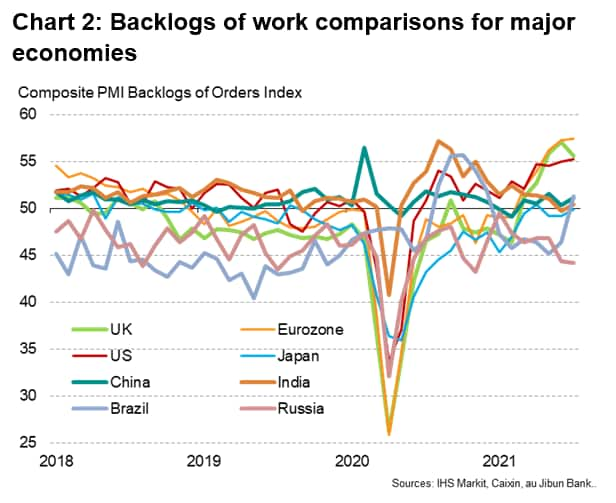
The use of the same survey methodology in each country facilitates international comparisons. Chart 2 reveals how, of the world's major economies, the eurozone reported the largest increase in backlogs of work during July 2021, with large increases also recorded in the United States and United Kingdom. In contrast, Japan reported a marginal decline. In the major emerging markets, China, India and Brazil saw only slight increases but Russian companies reported a substantial decline.
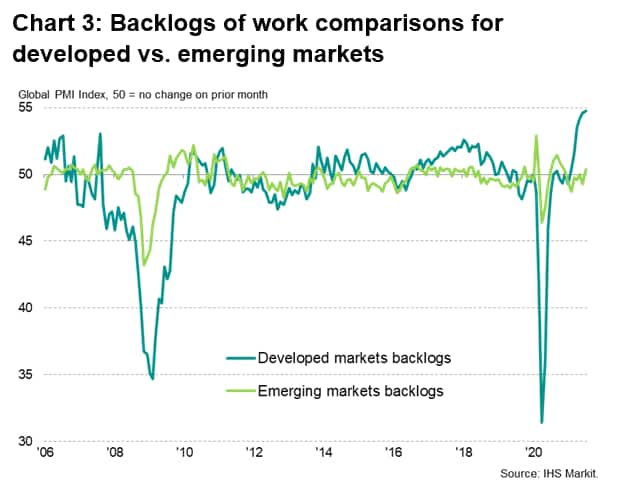
Aggregating the PMI data for the developed and emerging markets (again using GDP-based weights for each country), the PMI data underscore how the rise in backlogs of work in mid-2021 was very much a feature of the developed rather than emerging markets, with the developed markets in fact recording the largest rise in backlogs of work ever recorded by the survey in nearly two decades of data collection during July 2021.
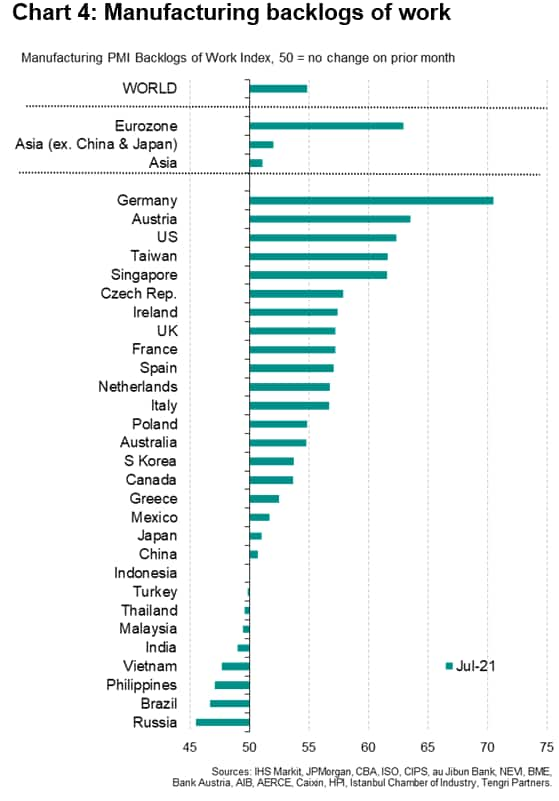
A more detailed analysis of manufacturing backlogs of work (chart 4) reveals that the build-up of uncompleted work in July 2021 was most pronounced in Germany, followed by Austria and the US, with Taiwan and Singapore also seeing well above-average increases.
Sector insights
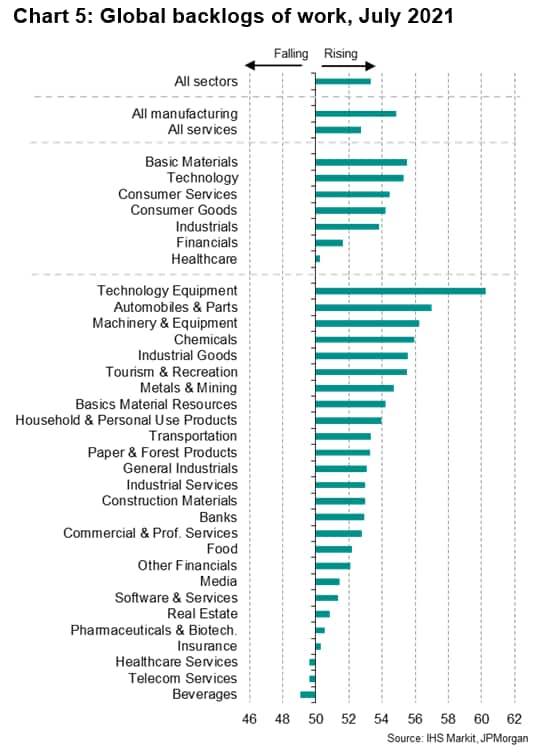
Further insight in backlogs of work can be gleaned from the detailed sector PMI dataset, which provides a breakdown of the data from global, Asian, European and US perspectives. The global sector data are shown in chart 5, illustrating how the largest build-up of uncompleted work was recorded in the technology equipment manufacturing sector during July 2021, followed by auto makers and producers of other machinery & equipment (all three sectors reported widespread shortages of semiconductors as a key cause of the increase in backlogs of work).
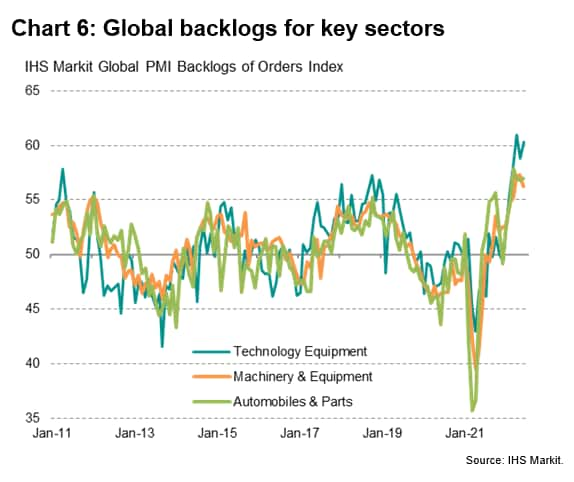
A time series plot (chart 6) of the three sectors reporting the largest build-ups of uncompleted work reveals how the increases in mid-2021 have been the biggest recorded for at least a decade, albeit with some signs of the rate of increase moderating in July 2021.
How can the PMI backlogs of work be used?
Forecasting investment spending
The reasons provided by PMI respondents for changes in backlogs of work reveal how rising backlogs can trigger the investment in additional capacity, often via the purchase of new machinery, office space and other assets or the hiring of new employees.
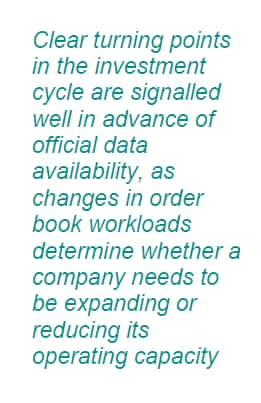
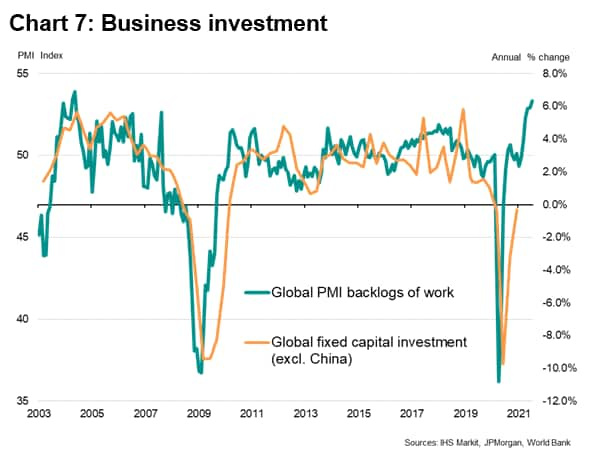
The PMI backlogs of work index therefore acts as a reliable leading indicator of business investment spending, as illustrated in chart 7, which maps the global backlogs of work index against official investment spending growth. Clear turning points in the investment cycle are signalled well in advance of official data availability, as changes in order book workloads determine whether a company needs to be expanding or reducing its operating capacity.
At the time of writing, the latest data on backlogs of work herald a strong need for additional capacity, which should in turn drive a resurgence in business investment spending.
Anticipating changes in employment
Similarly, the backlogs of work index tends to exhibit a high correlation with the corresponding PMI employment index, and can therefore be used as a valuable insight into labour market trends.
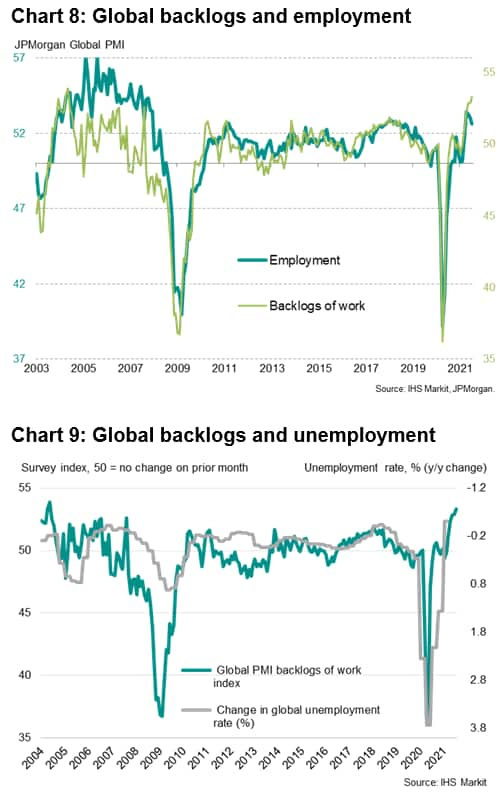
In the case of the global PMI (see chart 8), the correlation of the backlogs index against the employment index between 2003 and 2021 is 84% using a three-month average of the backlogs of work index (smoothed to better detect the underlying trend). If the extreme cases of the 2008 global financial crisis and 2020-21 pandemic are excluded, the correlation is lower, but at 74% the fit is still robust and observed with the backlogs of work index now acting with a lead of two months. Similar statistics are seen for different countries and sectors.
Charting the global backlogs index against the official economic data relating to unemployment (chart 9) further underscores the PMI data's value as a leading indicator of labour market trends. The backlogs index has charted all of the major turning points in the global job market months ahead of official unemployment data. Data relating to July 2021 point to a further marked reduction in global unemployment.
Inflation monitoring
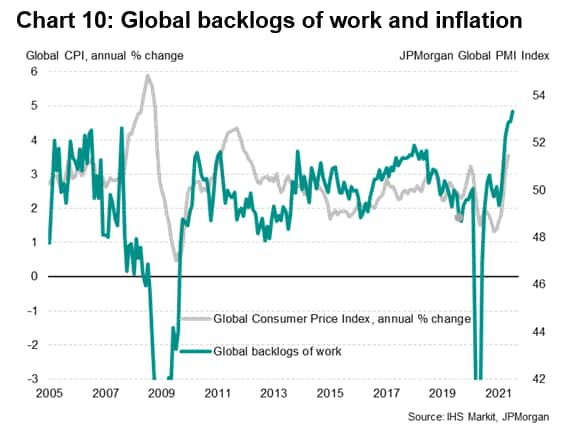
Given that the backlogs of work index acts as a proxy for the amount of spare capacity in the economy, it also acts as a guide to the development of inflationary pressures.
While global inflation continued to spike higher in 2008, for example (see chart 10), the global PMI backlogs of work had already moved into contraction territory, indicating that companies were reporting excess capacity. Prices tend to eventually fall once capacity (supply) exceeds demand, so it was not surprising to see inflationary pressures subsequently quickly fade.
A rebound in price pressures was likewise signalled in advance by the build-up of backlogs of work in 2010, as demand start to exceed supply.
More recently, in mid-2021 the backlogs of work index is pointing to companies struggling to meet demand, resulting in the greatest shift in pricing power to a sellers' market in the history of the survey.
Corporate earnings and investment signals
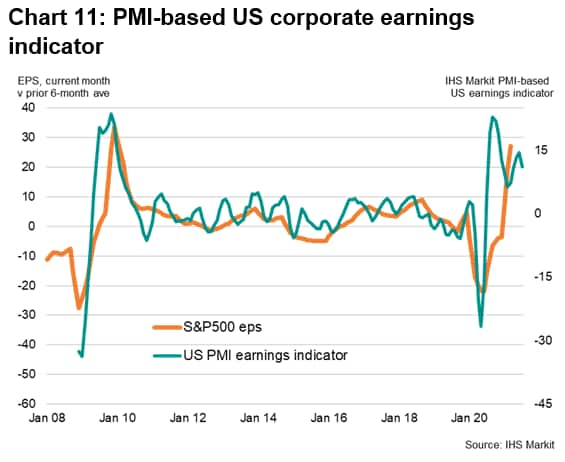
With changes in backlogs of work being driven by underlying demand and supply fundamentals, and hence providing valuable insights into companies' pricing power as a result, the index consequently correlates well with corporate earnings. It is particularly valuable as a component of investment strategy and allocation models. Indeed, our own separate research has shown the value of utilising the leading properties of backlogs of work in sector rotation models, helping to understand changes in momentum and relative sector equity market performance- and help generate excess market returns.
In the example shown in chart 11, we used a simple amalgamation of several PMI sub-index including the backlogs of work index to generate a leading indicator of US corporate earnings.
Indicator components:
▪ Backlogs of work
▪ New orders
▪ Selling prices
▪ Productivity (output/employment ratio)
▪ Suppliers' delivery times
Related indicators
Output
The volume of units produced this month compared with the situation one month ago (based on respondent's definition).
New Orders
The level of new orders received (in units, not money) this month compared with the situation one month ago. Domestic and export orders are included in this definition.
New Export Orders
The level of new orders received which will require shipment across the national border (in units, not money) this month compared with the situation one month ago.
Quantity of Purchases
The volume or number of items purchased this month compared with the situation one month ago.
Suppliers' delivery times
The average time taken for suppliers to provide inputs this month compared with the situation one month ago.
Stocks of Purchases
The level of inventory of materials purchased (in units, not money) this month compared with the situation one month ago.
Stocks of Finished Goods
The level of finished product which has come off the production line and is awaiting shipment/sales (in units, not money) this month compared with the situation one month ago.
Employment
The level of full-time employment this month compared with the situation one month ago. For the purpose of calculation it is agreed that two part time employees should be treated as one full time employee. Seasonal hiring of employees is excluded in this definition.
Input Prices
Average prices of all goods purchased (volume weighted) this month compared with the situation one month ago.
Output Prices
Average selling prices of all goods produced (volume weighted) this month compared with the situation one month ago.
Future Output
Whether output levels will be higher, the same or lower than current levels in 12 months' time.
Chris Williamson, Chief Business Economist, IHS Markit
Tel: +44 207 260 2329
chris.williamson@ihsmarkit.com
© 2021, IHS Markit Inc. All rights reserved. Reproduction in whole or in part without permission is prohibited.
Purchasing Managers' Index™ (PMI™) data are compiled by IHS Markit for more than 40 economies worldwide. The monthly data are derived from surveys of senior executives at private sector companies, and are available only via subscription. The PMI dataset features a headline number, which indicates the overall health of an economy, and sub-indices, which provide insights into other key economic drivers such as GDP, inflation, exports, capacity utilization, employment and inventories. The PMI data are used by financial and corporate professionals to better understand where economies and markets are headed, and to uncover opportunities.
This article was published by S&P Global Market Intelligence and not by S&P Global Ratings, which is a separately managed division of S&P Global.
Location


