Featured Topics
Featured Products
Events
S&P Global Offerings
Featured Topics
Featured Products
Events
S&P Global Offerings
Featured Topics
Featured Products
Events
S&P Global Offerings
Featured Topics
Featured Products
Events
Financial and Market intelligence
Fundamental & Alternative Datasets
Government & Defense
Professional Services
Banking & Capital Markets
Economy & Finance
Energy Transition & Sustainability
Technology & Innovation
Podcasts & Newsletters
Financial and Market intelligence
Fundamental & Alternative Datasets
Government & Defense
Professional Services
Banking & Capital Markets
Economy & Finance
Energy Transition & Sustainability
Technology & Innovation
Podcasts & Newsletters
BLOG — May 01, 2024

By Chris Rogers
Learn more about our Supply Chain Console
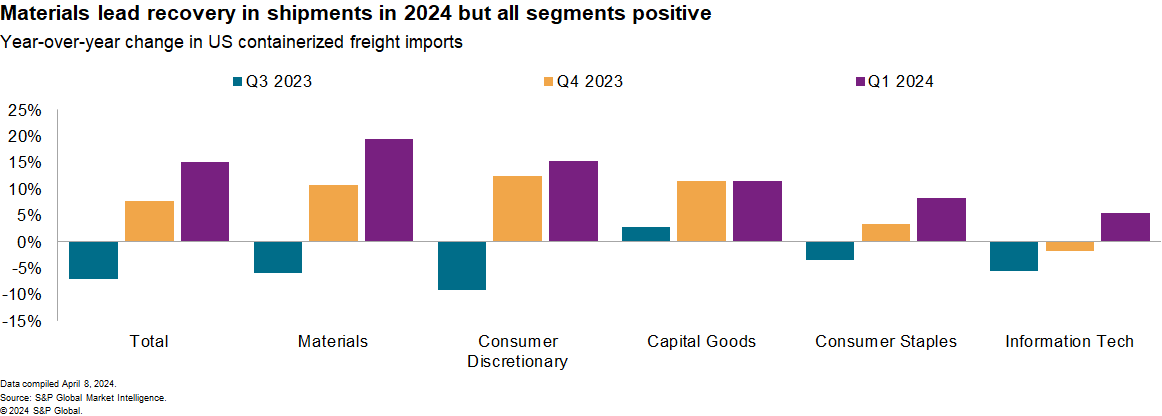
US containerized freight imports have had a stellar start to 2024, with first-quarter growth of 15% year over year, even with supply chain disruptions in the Red Sea, Panama Canal, and port of Baltimore.
Growth was driven by industrial sectors including materials ranging from steel to paper. Gains were also seen in shipments of consumer goods, personal care, consumer electronics and apparel. The improved volumes may have helped contracted shipping rates for the coming year to rise by as much as 17%, though spot rates have fallen from their peak.

Some caution is needed: Imports a year ago were depressed by inventory destocking in the retail sector. On a compound annual basis, shipments have expanded by 3.5% over the past five years.
Slowing growth
The rapid growth of the first quarter is not expected to continue in the rest of 2024, Market Intelligence forecasts show. US containerized freight imports are expected to grow by 7% in the second quarter of 2024, slowing to 3% by the fourth quarter before entering 2025 at a 1% growth rate.
That's in large part down to a slowdown in the rapid rate of expansion in industrial supply chain products including chemicals, metals and machinery. The apparel sector is also expected to be lackluster, with no growth in the second quarter and a decline in the rest of the year. A continued focus on maximizing inventory efficiency means a post-destocking recovery is unlikely.
The outlook for trade activity from the United States' major partners is somewhat mixed. The S&P Global PMI for manufacturing new export orders in mainland China reached 51.6 in March (over 50 indicates growth), reaching its highest since February 2023. However, the Mexico manufacturing export new orders measure fell back below 50 after just one month of expansion. For Canada and the EU, the measures improved but remained in contractionary territory. That measure includes exports to all markets and not just the US. US export orders meanwhile, driving the other half of the trade equation, remained positive for a second month in March at 50.5, though that was lower than in February.
An uncertain peak season
We also expect considerable uncertainties surrounding the timing of peak season shipments resulting from a mixture of physical, political and labor reasons. That can cause challenges for both cargo owners and logistics network operators and may lead to earlier-than-normal shipments to mitigate delivery risks.
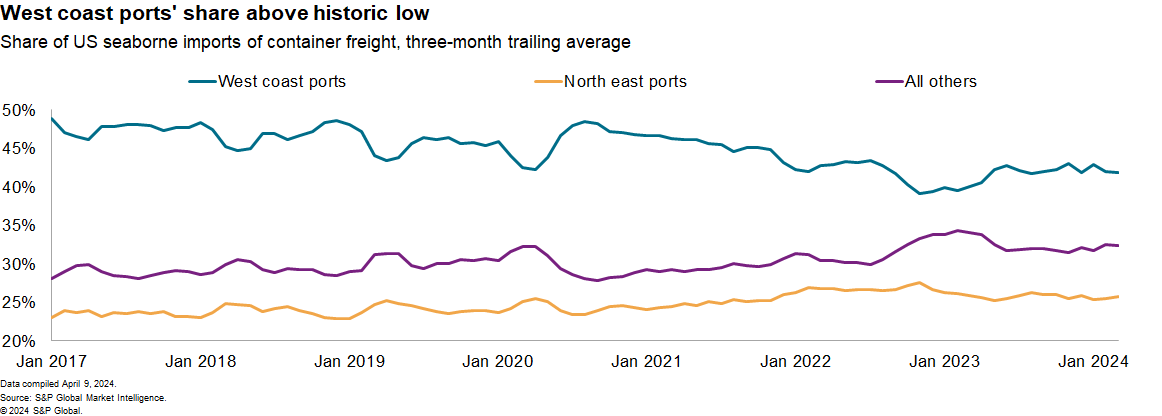
The temporary closure of the port of Baltimore may prove to be more a regional than national challenge, raising the prospect of elevated shipments into nearby ports including Philadelphia, Norfolk and Newark among others. While the port of Baltimore may be reopened in May, the risk of strikes on the east coast and continued delays to Red Sea shipping may lead cargo owners to ship earlier than usual or to further divert shipments to west coast ports. While there has been a rotation back to west coast ports, their share of US imports has yet to recover to historic levels.

US political considerations
Depending on the outcome of the US elections, we may see another round of tariffs on imports from mainland China in the first quarter of 2025. Importers could pass these through to consumer prices, shift sourcing patterns or preempt the tariffs by shipping early.
Shipping patterns in 2018 and 2019 indicate the latter could lead to a surge in shipments late in the fourth quarter of 2024. The imposition of tariffs by the Trump administration on imports from mainland China in July and August 2018 likely led to an earlier-than normal seasonal peak in 2018, Market Intelligence data shows, including a 13% year-over-year rise in June.
The extension to "List 3" products, including components and industrial products, likely drove a 23% year-over-year surge in shipments in December 2018. Similarly, the final extension to include "List 4A" products, in September 2019 may be responsible for a rapid slide in shipments subsequently with a drop of 18% year over year in October.
Sign up for our Supply Chain Essentials newsletter
This article was published by S&P Global Market Intelligence and not by S&P Global Ratings, which is a separately managed division of S&P Global.