Featured Topics
Featured Products
Events
S&P Global Offerings
Featured Topics
Featured Products
Events
S&P Global Offerings
Featured Topics
Featured Products
Events
S&P Global Offerings
Featured Topics
Featured Products
Events
Financial and Market intelligence
Fundamental & Alternative Datasets
Government & Defense
Professional Services
Banking & Capital Markets
Economy & Finance
Energy Transition & Sustainability
Technology & Innovation
Podcasts & Newsletters
Financial and Market intelligence
Fundamental & Alternative Datasets
Government & Defense
Professional Services
Banking & Capital Markets
Economy & Finance
Energy Transition & Sustainability
Technology & Innovation
Podcasts & Newsletters
Research — 31 Mar, 2021
By Zack Yang and Temilade Oyeniyi
Highlights
A quintile portfolio strategy that buys (sells) companies with small (large) changes in the “Risk Factors” section of 10-K and 10-Q regulatory filings yields an annualized return of up to 5.36%.
A process that targets only companies with “significant” changes (outliers) in the short portfolio produces an annualized long-short return of 6.59%.
Signal decay is slow, with annualized long-short return (3.32%) remaining significant with a 12-month implementation lag.
The signal performance is stronger in the small cap space (6.42%) compared to the large cap segment (2.37%).
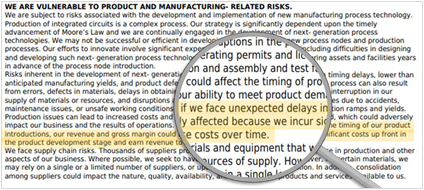
Company quarterly (10-Q) and annual (10-K) filings have traditionally been a vital source of information for investment decisions. However, the increasing length and complexity of these filings can result in investors overlooking new and important details in these reports. For example, Intel Corporation (“INTC”) updated the “Risk Factors” section of its 2017 10-K filing released on February 16, 2018 with the following: “if we face unexpected delays in the timing of our product introductions, our revenue and gross margin could be adversely affected” (Figure 1). Investors appeared not to have noticed this update as the stock climbed 5% in the week following the earnings release. INTC eventually disclosed a significant delay in the launch of its new 10-nanometer processor during its 2018 2Q earnings call held on July 26, 2018. The company’s stock dropped by 8% that day (despite earnings and revenue beats) and fell by another 6% over the next 3 months.
Figure 1: Intel Corporation 2017 10-K Risk Factors Section Excerpt

Source: Intel Corporation 10-K Filing. S&P Global Market Intelligence Quantamental Research. Data as of 02/28/2021.
This report uses three metrics (Minimum Edit Distance, Jaccard Similarity, and Cosine Similarity) to identify companies that made significant changes to the “Risk Factors” section of their filings. These metrics can serve as alpha signals or be used to quickly identify a pool of companies that require further investigation. Our findings include:
Download The Full Report
Location
Products & Offerings