S&P Global Offerings
Featured Topics
Featured Products
Events
S&P Global Offerings
Featured Topics
Featured Products
Events
S&P Global Offerings
Featured Topics
Featured Products
Events
S&P Global Offerings
Featured Topics
Featured Products
Events
Corporations
Financial Institutions
Banking & Capital Markets
Economy & Finance
Energy Transition & Sustainability
Technology & Innovation
Podcasts & Newsletters
Corporations
Financial Institutions
Banking & Capital Markets
Economy & Finance
Energy Transition & Sustainability
Technology & Innovation
Podcasts & Newsletters
Research — 23 Jun, 2021
In this article, we look at the easing of foreign ownership limits in China and estimates provided by domestic and international brokers for China A shares. Specifically, we explore whether there was any implicit bias in the Chinese brokers’ estimates versus their international counterparts, and whether combining foreign brokers’ estimates with those of Chinese brokers could help improve the accuracy of these forecasts. We used the earnings surprise of CSI 100 index constituents over the last six years as a measure of this accuracy, i.e., the difference between annual actual and estimated earnings per share (EPS) based on generally accepted accounting principles (GAAP).
Introduction
China’s Qualified Foreign Institutional Investors (QFII) program was launched in 2013. This was followed by the launch of the Stock Connect program between the exchanges in mainland China and Hong Kong in 2014, and then the inclusion of China A shares in the MSCI index in 2018. This resulted in greater accessibility of the China A shares market to all investors and market participants.
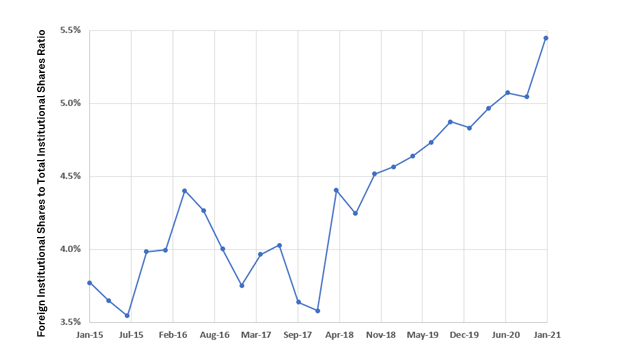
Using S&P Global Market Intelligence’s (“Market Intelligence’s”) Ownership data package,[1] we looked at the institutional ownership trend across CSI 100 constituents over the course of six years (January 2015 to January 2021), and saw an increase of 47.3%. Guosen Securities Co., Ltd. (SZSE:002736) had the highest increase at 652.48%. Figure 1 charts the foreign institutional shares to total institutional shares outstanding ratio for the CSI 100 index over the six year period, showing an increase from 3.7% to 5.4
Figure 1: Foreign Institutional Shares to Total Institutional Shares Ratio for CSI 100
Source: S&P Global Market Intelligence. Data as of May 11, 2021. For illustrative purposes only.
In 2020, China also received the largest amount of foreign direct investment[2] of all economies and saw a foreign portfolio investment (FPI) inflow of 110.754 USD billion in December of that year, an all-time high.[3] The country’s GDP growth for 2021 is expected to be the second highest in the world and is currently pegged at 8.5%.[4]
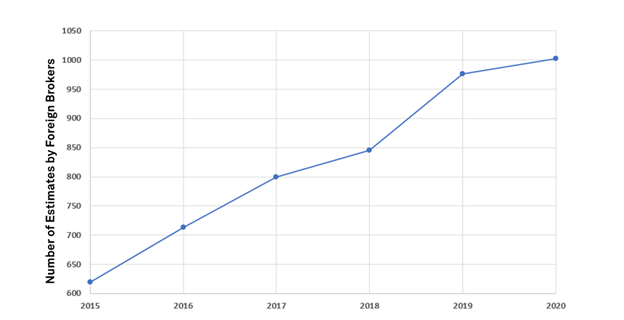
In addition to increasing investor interest, we also observed a 62% increase in the number of estimates with China A shares that have been covered by foreign brokers in the last five years (See Appendix 1). Given this, we explored if there were any implicit biases in Chinese brokers’ estimates versus their international counterparts. We also looked at whether combining foreign brokers’ estimates with those of Chinese brokers can help improve the accuracy of these forecasts.
Methodology
For our analysis, we used the CSI 100 constituents and calculated EPS (GAAP) from 2015 to 2021. We calculated four types of earnings surprises: (1) the EPS (GAAP) estimates by the top 20 Chinese brokers, (2) the EPS estimates by the top 20 foreign brokers, (3) the S&P consensus estimates, and (4) the EPS (GAAP) estimates from all brokers. Details are outlined below.
Table 1: Top 20 Chinese brokers based on the number of China A shares covered and/or nominated/awarded for Institutional Investor’s “The Best Research Team” in 2020
|
Broker Name |
Number of Covered Companies |
|
Industrial Securities Co. Ltd. |
2,029 |
|
Everbright Securities Co. Ltd. |
1,845 |
|
Changjiang Securities Co. LTD. |
1,801 |
|
Huatai Securities Co., Ltd. |
1,741 |
|
China Merchants Securities Co. Ltd. |
1,731 |
|
Ping An Securities Co. Ltd. |
1,510 |
|
China International Capital Corporation Limited |
1,065 |
|
Shenwan Hongyuan Securities |
1,051 |
|
Citic Securities Co., Ltd. |
958 |
|
Founder Securities Co., Ltd. |
922 |
|
SWS Research Co., Ltd. |
919 |
|
Guodu Securities Co. |
913 |
|
Huatai United Securities Co., Ltd. |
836 |
|
Guosen Securities Co., Ltd. |
801 |
|
Great Wall Securities Co., Ltd. |
751 |
|
Guoyuan Securities Co., Ltd. |
698 |
|
Chasing Securities |
688 |
|
Haitong Securities Co., Ltd. |
685 |
|
TX Investment Consulting Co., Ltd. |
681 |
|
GZ500.com |
670 |
Table 2: Top 20 foreign brokers based on the number of China A shares covered and/or nominated/awarded for Institutional Investor’s “The Best Research Team” in 2020
|
Broker Name |
Number of Covered Companies |
|
Goldman Sachs |
603 |
|
BOCI Research Ltd. |
567 |
|
UBS Investment Bank |
560 |
|
Morgan Stanley |
537 |
|
HSBC |
499 |
|
Citigroup Inc |
426 |
|
Guotai Junan International Holdings Limited |
406 |
|
KGI Securities Co. Ltd. |
381 |
|
Macquarie Research |
351 |
|
Credit Suisse |
351 |
|
BofA Global Research |
326 |
|
CLSA |
315 |
|
J.P.Morgan |
297 |
|
Nomura Securities Co. Ltd. |
238 |
|
Deutsche Bank |
207 |
|
BNP Paribas Securities (Asia) |
193 |
|
Daiwa Securities Co. Ltd. |
189 |
|
Jefferies LLC |
172 |
|
Yuanta Research |
161 |
|
DBS Vickers Research |
157 |
We use the S&P Capital IQ (“CIQ”) Consensus Mean. This is a combination of both Chinese and foreign brokers’ estimates, although a broker’s estimate would be excluded from the Consensus Mean for the reasons below:
“All brokers” is defined as all 240 brokerage firms contributing estimate data for companies in China A shares, as part of the CIQ Estimates package. [5]
With these four groups, we have been able to cover up to 90% of CSI 100 firms from 2015 to 2021. As per the PRC regulations, [6] all companies are required to file annual reports within four months of the fiscal period end. So, for our analysis, we look at the first four months of each year. The annual earnings surprise is calculated at a company level and then averaged across CSI 100 constituents to arrive at an index-level earnings surprise. This exercise is repeated for each of the four flavors of EPS (GAAP) estimates.
A Look at the Results
Table 3 shows the overall average EPS (GAAP) earnings surprise for each group. The CIQ Consensus Mean exhibits the lowest differential of 0.0022. Additionally, comparing Chinese and foreign brokers, the top 20 foreign brokers achieved a lower differential of -0.06701. The EPS (GAAP) surprise for all brokers is somewhere between the top 20 Chinese and the top 20 foreign brokers’ difference.
Table 3: Overall Average EPS (GAAP) Surprise from 2015 to 2021
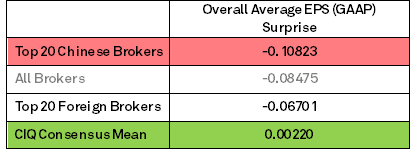
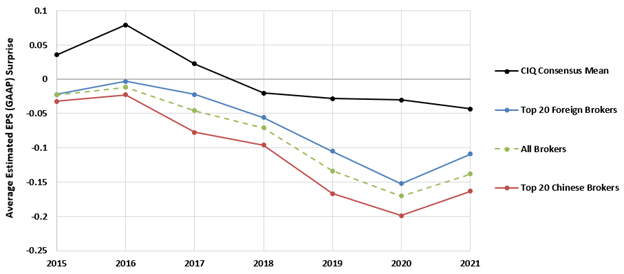
Figure 2 shows the average EPS (GAAP) earnings surprise over the period of analysis. The CIQ Consensus Mean achieves a consistently lower gap after year 2016, while the top 20 Chinese brokers and the top 20 foreign brokers generally overestimate the EPS (GAAP). Of the four groups studied, the EPS (GAAP) estimate by the top 20 Chinese brokers seems to be the highest earnings surprise. The CIQ Consensus Mean has the lowest earnings surprise over the past five years, followed by foreign brokers.
Figure 2: Average Estimated EPS (GAAP) Surprise on CSI100 companies
Source: S&P Global Market Intelligence. Data as of May 11, 2021. For illustrative purposes only.
With a lower estimate gap demonstrated for the CIQ Consensus Mean, we investigated whether such data can generate alpha and how much return would have potentially been possible in the Chinese market over the last six years.
CIQ Consensus Estimates Based on Factor Returns
The S&P Global Alpha Factor Library is a collection of more than 600 factors and eight styles that can be leveraged by portfolio managers, quantitative analysts, and researchers to gain insight into new sources of potential alpha.
The Analyst Expectation style factor is a weighted combination of four factors: expected long-term growth, analyst earnings estimate diffusion, standardized unexpected earnings, and the number of EPS FY1 revisions. These factors are calculated using the Market Intelligence Estimates data package.
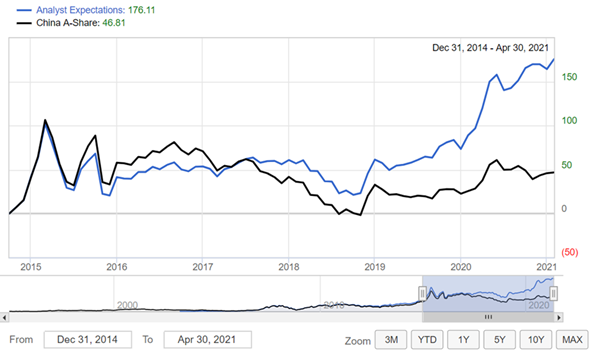
An equal weighted, long-only factor portfolio was then created by investing in the top 20 percentile of the China A shares universe, and this basket is rebalanced monthly. In Figure 3 below, the Analyst Expectation Factor Portfolio outperformed an equal weighted China A shares universe, achieving 176.11% absolute return over a six-year time horizon.
Figure 3: Analyst Expectations Return versus China A Shares Benchmark
Source: S&P Global Market Intelligence. Data as of May 11, 2021. For illustrative purposes only.
Conclusion
In this article, we summarized our analysis of foreign institutional ownership, foreign broker coverage, and EPS forecasts for the China A shares universe from 2015 to 2021. We pointed out that the foreign institutional ownership percentage against total institutional shares had increased by 47.3% on China CSI 100 companies. With more investors now investing/looking to invest in China, coverage by international brokers increased from 619 estimates to 1,002 over the period in question.
We further split the EPS estimate contributors into four groups — top 20 Chinese brokers, top 20 foreign broker, CIQ Consensus Mean, and all 240 brokers — and tried to determine which group achieved the closest EPS (GAAP) estimates historically. We used the earnings surprise (i.e., the difference between annual actual and estimated EPS (GAAP)) for companies in the CSI 100 as the measure in our analysis.
As evidenced by the results, foreign brokers’ EPS (GAAP) estimates have lower earnings surprises when compared to their Chinese counterparts. The CIQ Consensus Mean, a combination of both types of broker estimates based on the same methodology, had the lowest estimate gap overall.
Therefore, we believe there is lower estimate gap when using a combination of both qualified Chinese and foreign brokers’ estimate data filtered by a consistent methodology. Based on an alpha factor calculated from the CIQ consensus data, our investment strategy also achieved 176.11% absolute return in the China A shares universe over the last six years.
Appendix 1: Foreign Brokers’ Coverage of China
We identified those foreign brokers contributing EPS (GAAP) estimates for China A shares in our CIQ Estimates database, and then counted the total number of estimates they covered from fiscal year 2015 to 2020. As can be seen in Figure 4, the number of estimates covered by foreign brokers increased by 61.8%, from 619 for fiscal year 2015 to 1,002 for fiscal year 2020.
Figure 4: Number of Estimates by Foreign Brokers on China A Shares
Source: S&P Global Market Intelligence. Data as of May 11, 2021. For illustrative purposes only.
For more information on S&P Global Market Intelligence’s Estimates Data, please visit site.
[1] Includes detailed historical equity ownership data on over 90,000 public and private companies, institutional investment firms, mutual funds, and insiders/individual owners. Data coverage as of January 2021.
[2] China was largest recipient of FDI in 2020: Report”, Reuters, January 24, 2021, www.reuters.com/article/us-china-economy-fdi-idUSKBN29T0TC
[3] China Foreign Portfolio Investment”, CEIC, 1998-2020, www.ceicdata.com/en/indicator/china/foreign-portfolio-investment
[4] World Bank: China's economy to grow at 8.5% following pent-up demand”, China Daily, June 9, 2021, www.chinadaily.com.cn/a/202106/08/WS60bf7752a31024ad0bac46dd.html
[5] This is a standardized database of global, real-time financial forecasting measures, such as upgrades/downgrades, target price revisions, and market-moving news.
[6] CSRC Announcement 21”, China Securities Regulatory Commission, May 28, 2014, http://www.csrc.gov.cn/pub/csrc_en/laws/overRule/Announcement/201508/t20150816_282862.html
Download The Full Report