


Blog — 7 Jul, 2021
COVID-19: Company Fundamental Scars and the Path to Recovery in Asian Economies
By Audrey Dong and Hangyu Ma, CFA, FRM
COVID-19 has been wreaking havoc across the globe since its outbreak, shattering supply chains, increasing corporate debt levels and changing the way we live and work. With the roll-out of vaccines and restoration of consumer confidence, Western countries are slowly entering the “new normal”. Since major Asian economies led the way in the recovery process, they offer a useful test bed to review the fundamental scars left by the pandemic and get an idea about what the potential recovery may look like in other economies, worldwide.
In the following research, we leveraged S&P Global Market Intelligence’s Probability of Default (PD) Model Fundamentals 2.0 - Public Corporates (PDFN 2.0 Public) to: i) assess the credit risk scars left by COVID-19 on publicly-traded businesses operating in major Asian economies, and ii) focus on China to identify divergent recovery paths across industries over the past few quarters.
Credit Trends in Asian economies
PDFN 2.0 Public is a fundamentals-based statistical model that produces PD values and mapped credit scores for publicly-listed companies across the globe.[1] [2] Figure 1 shows the country/region median PDs generated by PDFN 2.0 for public companies in Hong Kong, Singapore, South Korea, Taiwan, China and Japan from 2019Q4 to 2021Q1. Due to the differences in country/region risk scores and industry compositions, the absolute median PD values vary. However, if we compare the PD trends against each country/region, the surge starting from 2020Q1 in Hong Kong, Singapore, South Korea and China indicates they had all been hit severely by the coronavirus. For example, Hong Kong’s median PD increased from 3.4% to 5.3%, with 95.2 new cases per million population in 2020Q1. China, where the coronavirus first broke out, also experienced an overall deterioration in creditworthiness, with its median PD increasing from 1.5% to 1.8%.
Figure 1: Median PD Values Trend by Country/Region

Source: S&P Global Market Intelligence and Our World In Data, as of June 15, 2021. For illustrative purposes only. The numbers on top of each curve indicate the COVID-19 new cases per million population in each quarter.
Although most countries/regions in our sample had imposed lockdown measures in place in 2020Q1, this may not have impacted company quarterly financials instantly, like in Taiwan and Japan. Taiwan managed to efficiently contain the coronavirus from the very onset and did not show a creditworthiness deterioration for the companies in our sample. The median PD for Japanese firms was lower than companies in other countries, but showed an increase starting from 2020Q2, aligned with COVID-19 cases spiking (129.4 new cases per million population in 2020Q2) and a nationwide lockdown.
Starting from 2020Q3, some countries/regions exhibited signs of recovery with lower median PD values. China, in particular, was the first country emerging from lockdown in 2020Q2, and its creditworthiness for public companies had improved over two consecutive periods since 2020Q3. Let us now focus on China and further analyze its industry-level credit risk change, to depict a more detailed view of its recovery trajectory.
Bumpy Paths to Recovery Across Industries in China
Despite overall positive signs shown in China, its path to credit recovery has not been equally smooth across all industry sectors, as the change in credit scores from 2020Q3 to 2021Q1 shows in Figure 2.[3] The credit conditions in Construction Materials, Energy, Real Estate, Services for Business and Utilities were still deteriorating in 2020Q4, with the Services for Business sector seeing the biggest deterioration — a change of more than 0.11 notches in its industry mean credit score. By contrast, the revival of Automotive, Aerospace & Defense and Retail industries had mainly contributed to the rebound of overall creditworthiness, as their average credit scores had improved approximately 0.49, 0.27 and 0.27, respectively.
When looking at the credit score changes from 2020Q4 to 2021Q1, the vast majority of industries appeared to be on their way to recovery. The top three sectors with the greatest credit score improvement were: Construction Material, Retail and Consumer Products (Non-Durable) that were leading the group.
Figure 2: PDFN Mapped Credit Scores Change from 2020Q3 to 2021Q1 by Industries in China
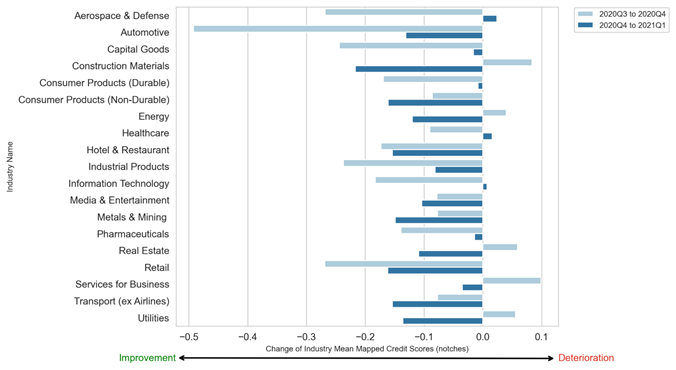
Source: S&P Global Market Intelligence as of June 15, 2021. For illustrative purposes only.
However, the pace of recovery is not the same across all industries. Some industries recover at a relatively steady pace, (e.g., Hotel & Restaurant and Media & Entertainment). Others, like Retail and Consumer Products (Durables), showed a big improvement in their average credit score from 2020Q3 to 2020Q4, possibly due to the spending binge post-pandemic, followed by a slower improvement in the following quarter, as consumers remained cautious about spending and retailers kept adjusting to the “new normal” caused by the pandemic.
Summary
The scars left by COVID-19 are still present in global economies, but the dawn of a fundamental credit risk recovery is already visible in some Asian economies, especially in China. PDFN 2.0 Public shows a sustained rebound in the creditworthiness of public firms in the Hotel & Restaurant and Media & Entertainment sectors; however, the momentum of the recovery varies across industries, with some (e.g., Retail and Consumer Products (Durables)) experiencing a bumpy path to recovery.
Help yourself anticipate the unknown by learning more about Credit Analytics PDFN here >
[1] Our model maps each PD value to a credit score that ranges from ‘aaa’ to ‘c’. The mapping table is updated annually.
[2] S&P Global Ratings does not contribute to or participate in the creation of credit scores generated by S&P Global Market Intelligence. Lowercase nomenclature is used to differentiate S&P Global Market Intelligence PD credit model scores from the credit ratings issued by S&P Global Ratings.
[3] Airlines and Telecoms are excluded due to limited observations in the dataset.