S&P Global Offerings
Featured Topics
Featured Products
Events
S&P Global Offerings
Featured Topics
Featured Products
Events
S&P Global Offerings
Featured Topics
Featured Products
Events
S&P Global Offerings
Featured Topics
Featured Products
Events
Corporations
Financial Institutions
Banking & Capital Markets
Economy & Finance
Energy Transition & Sustainability
Technology & Innovation
Podcasts & Newsletters
Corporations
Financial Institutions
Banking & Capital Markets
Economy & Finance
Energy Transition & Sustainability
Technology & Innovation
Podcasts & Newsletters
Blog — 12 Dec, 2022
Highlights
While satellites technically cover the entire map and can be the only option available in some rural areas, speeds and pricing are rarely competitive.
At an average cost of $682 per home, fixed wireless is the least expensive technology to build out and cover homes in U.S. broadband deserts.
BEAD and RDOF funding should be enough to close the gap, assuming download speeds of 25 Mbps to 100 Mbps matches one's definition of broadband.
Return on investment has historically eluded broadband operators in rural markets.
We broke the complex challenge into three areas:
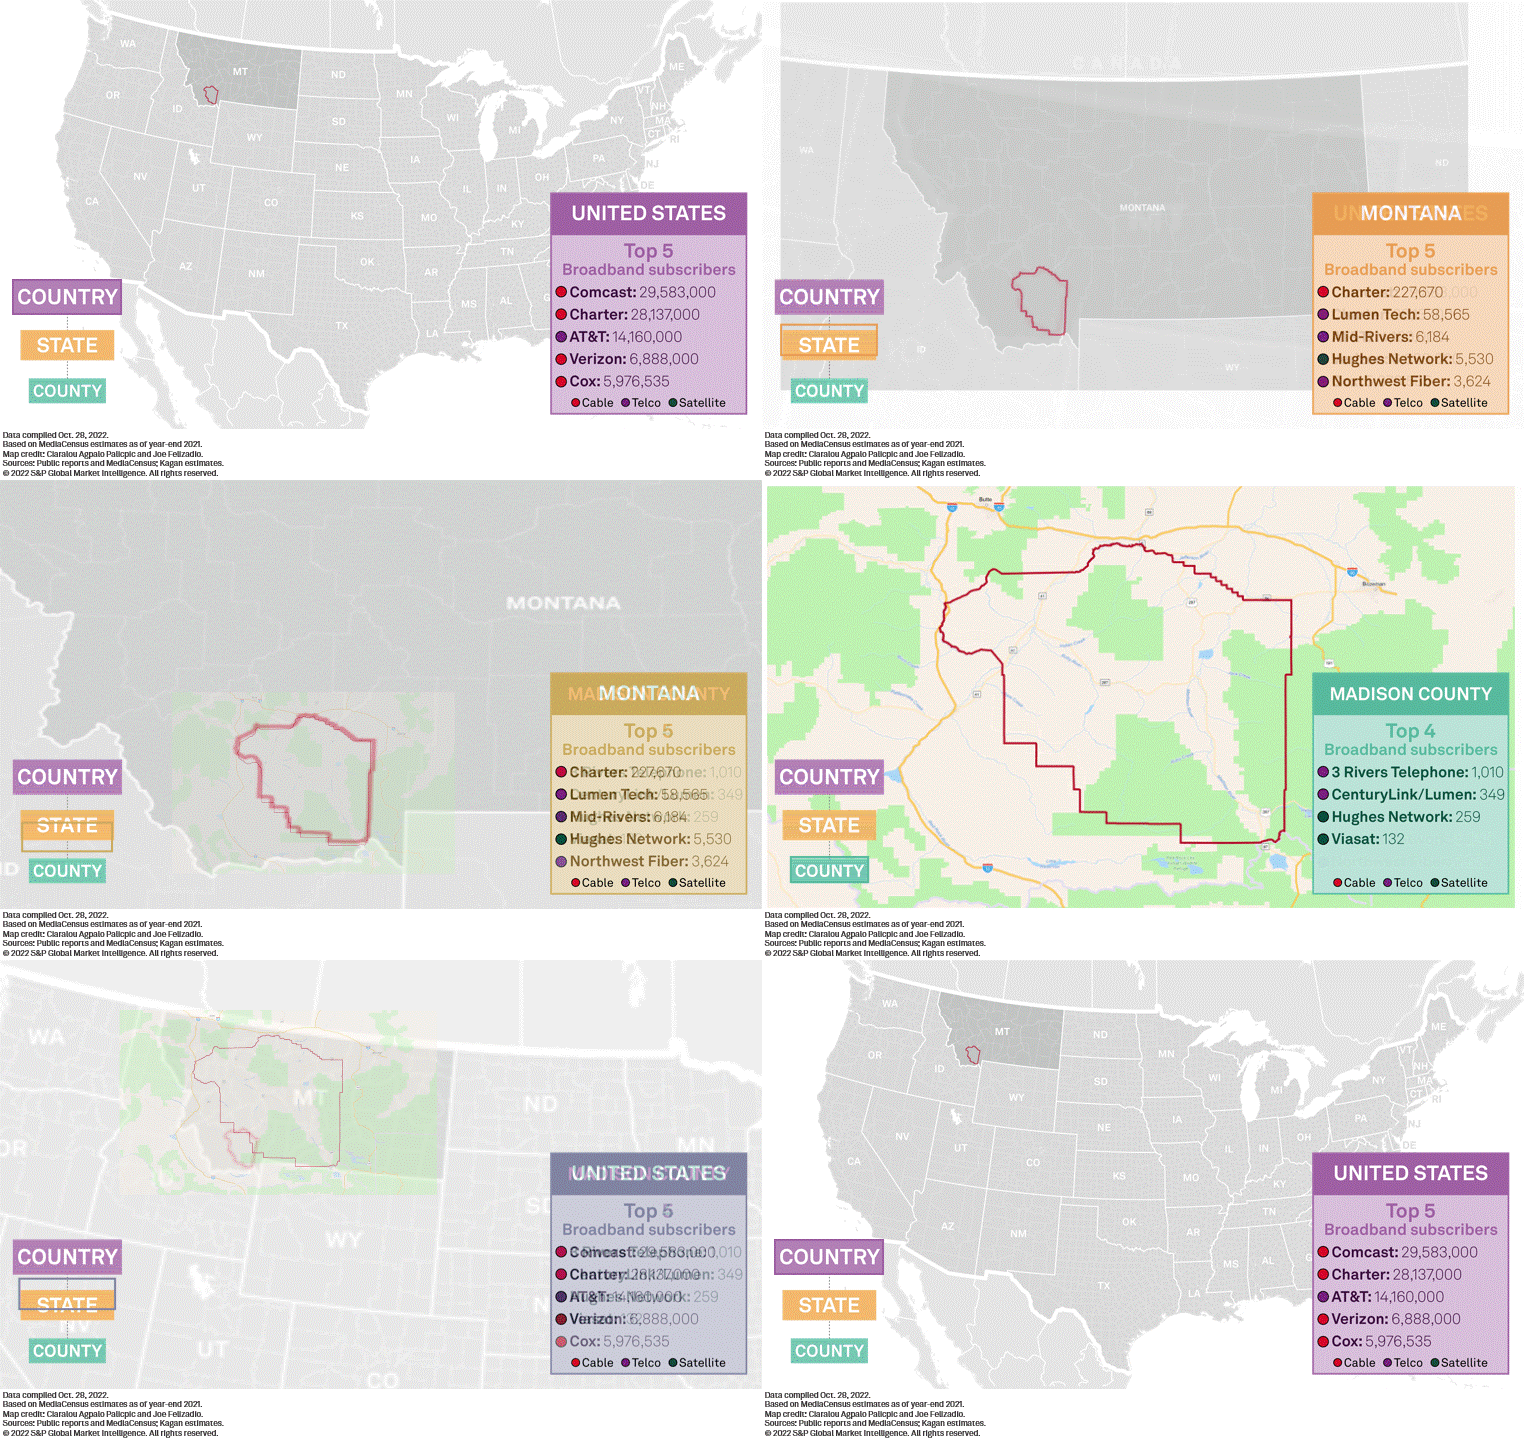
To start, we reviewed a sample county in Montana to highlight one rural market’s broadband dynamic.
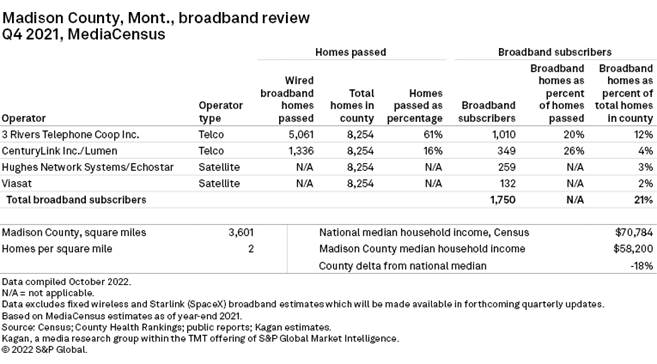
Madison County in Montana is one of the smallest counties by population in the U.S., with four towns, 8,254 homes and just a 21% broadband penetration.
The county has two homes per square mile on average, compared to, for instance, 33,243 in New York County (Manhattan). Median household income in Madison County ($58,200) was 18% less than the national average ($70,784) at the end of 2021.
Its dispersed and lower-income population has kept Madison County on the wrong side of the digital divide.

The county only has two telco and two satellite broadband operators. 3 Rivers Telephone Cooperative Inc. covers about 61% of homes with telco lines — many of which are probably DSL — and fellow telco operator Lumen Technologies Inc. covers about 16%.
While satellites technically cover the entire map and can be the only option available in some rural areas, speeds and pricing are rarely competitive. Combined, satellite providers EchoStar Corp. and Viasat Inc. have a broadband penetration of 5% of the county's homes, with wired connecting the 16% balance. In 2023 our MediaCensus broadband dataset will include SpaceX’s Starlink subscribers.

A similar assessment to our Madison County example can be conducted for any county or zipcode in the United States using our MediaCensus data. The incredible granularity of this data can help regulators and broadband providers identify areas where the digital divide exists.
While sparsely populated areas are high on the list, the divide is not only prevalent in rural areas. Some urban areas lack proper broadband options and, again, lower income homes struggle to afford the cost.
Varying costs and speeds by broadband delivery method
At an average cost of $682 per home, fixed wireless is the least expensive technology to build out and cover homes in U.S. broadband deserts. Passing a home with fiber costs about $2,583 per home (3.8 times fixed wireless) and cable co-ax costs about $2,283 (3.3 times fixed wireless).
Using these averages, the $62.85 billion earmarked by the U.S. government to help operators close the gap should be sufficient, according to Kagan estimates.
But covering a home with a broadband technology is only part of the challenge.
The throughput speeds available after the truck roll is the final consideration.
Several hundred Mbps of throughput is arguably the low end of what is required for a household to handle several simultaneous HD video streams. And already 13% of U.S. cable and fiber subscribers are paying for 1Gbps+ download speed options.
But for now, operators seeking U.S. government broadband funding from the Broadband Equity, Access, and Development, or BEAD, legislation need to provide at least 100 Mbps download and 20 Mbps upload speeds to qualify for assistance. This is up from the 25 Mbps/3 Mbps down/up minimums required for Rural Digital Opportunity Funds, or RDOF.
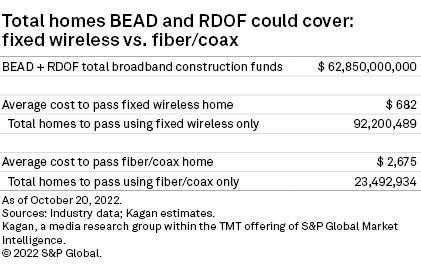
Combined, RDOF ($20.40 billion) and BEAD ($42.45 billion) are offering $62.85 billion in assistance for closing the digital divide.
The number of homes without a fixed home broadband service varies. The Federal Communication Commission, for instance, estimates about 6% of the U.S. population is without a fixed broadband option at home. An April 2021 Pew Research Center survey, on the other hand, indicates the figure is more like 20%.
Either way, the BEAD and RDOF funding should be enough to close the gap, assuming download speeds of 25 Mbps to 100 Mbps matches one's definition of broadband.
For instance, if all $62.85 billion went to fixed wireless, the funds would theoretically be enough to cover 92.2 million homes. This is about 70% of all 132 million U.S. occupied homes (using our above averages).
The same figure for fiber/co-ax would be 23.5 million homes or about 18% of U.S. occupied homes. As a combination of the two technologies will be used, it makes sense that a blend of the two should stretch the $62.85 billion to cover the remaining unconnected U.S. homes.

Encouragingly, Federal BEAD funds will be dispersed at the state and county levels so local experts can decide where the money is best spent to close the digital divide.
And some states have their own broadband initiatives running in parallel. California is spending $6 billion of non-BEAD and RDOF federal funding to build its 10,000 mile Middle-Mile Broadband Initiative which will dig a fiber network alongside highways. The state will then wholesale this fiber to ISPs with an eye on connecting unserved areas. Construction of the California network is expected to last through 2026, so it won’t happen quickly. But the dream of high-speed internet in every U.S. home will ensure all future students, entrepreneurs and inventors have access to the information they need and at a speed that matches their curiosity.
Additional links available to customers:
Research
Blog
