S&P Global Offerings
Featured Topics
Featured Products
Events
S&P Global Offerings
Featured Topics
Featured Products
Events
S&P Global Offerings
Featured Topics
Featured Products
Events
Banking & Capital Markets
Economy & Finance
Energy Transition & Sustainability
Technology & Innovation
Podcasts & Newsletters
Banking & Capital Markets
Economy & Finance
Energy Transition & Sustainability
Technology & Innovation
Podcasts & Newsletters
S&P Global Offerings
Featured Topics
Featured Products
Events
Research — March 25, 2025

By Kristin Larson, PhD
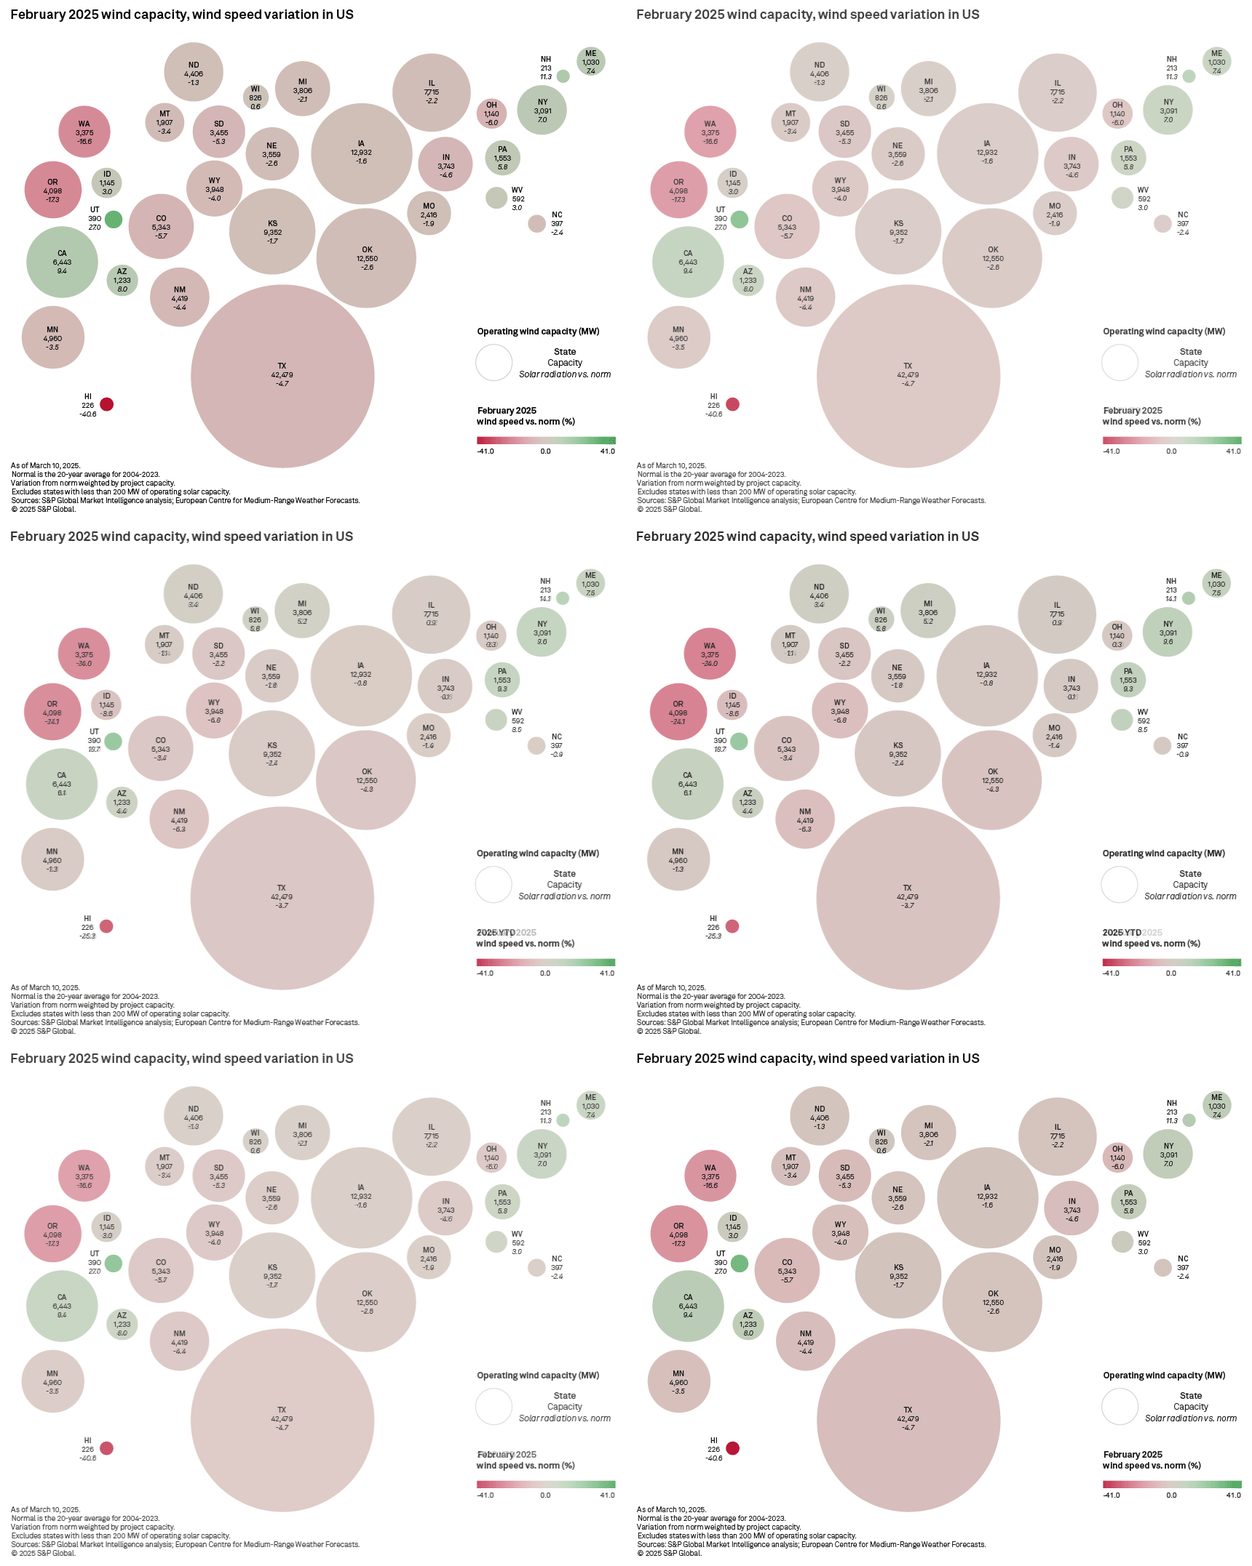
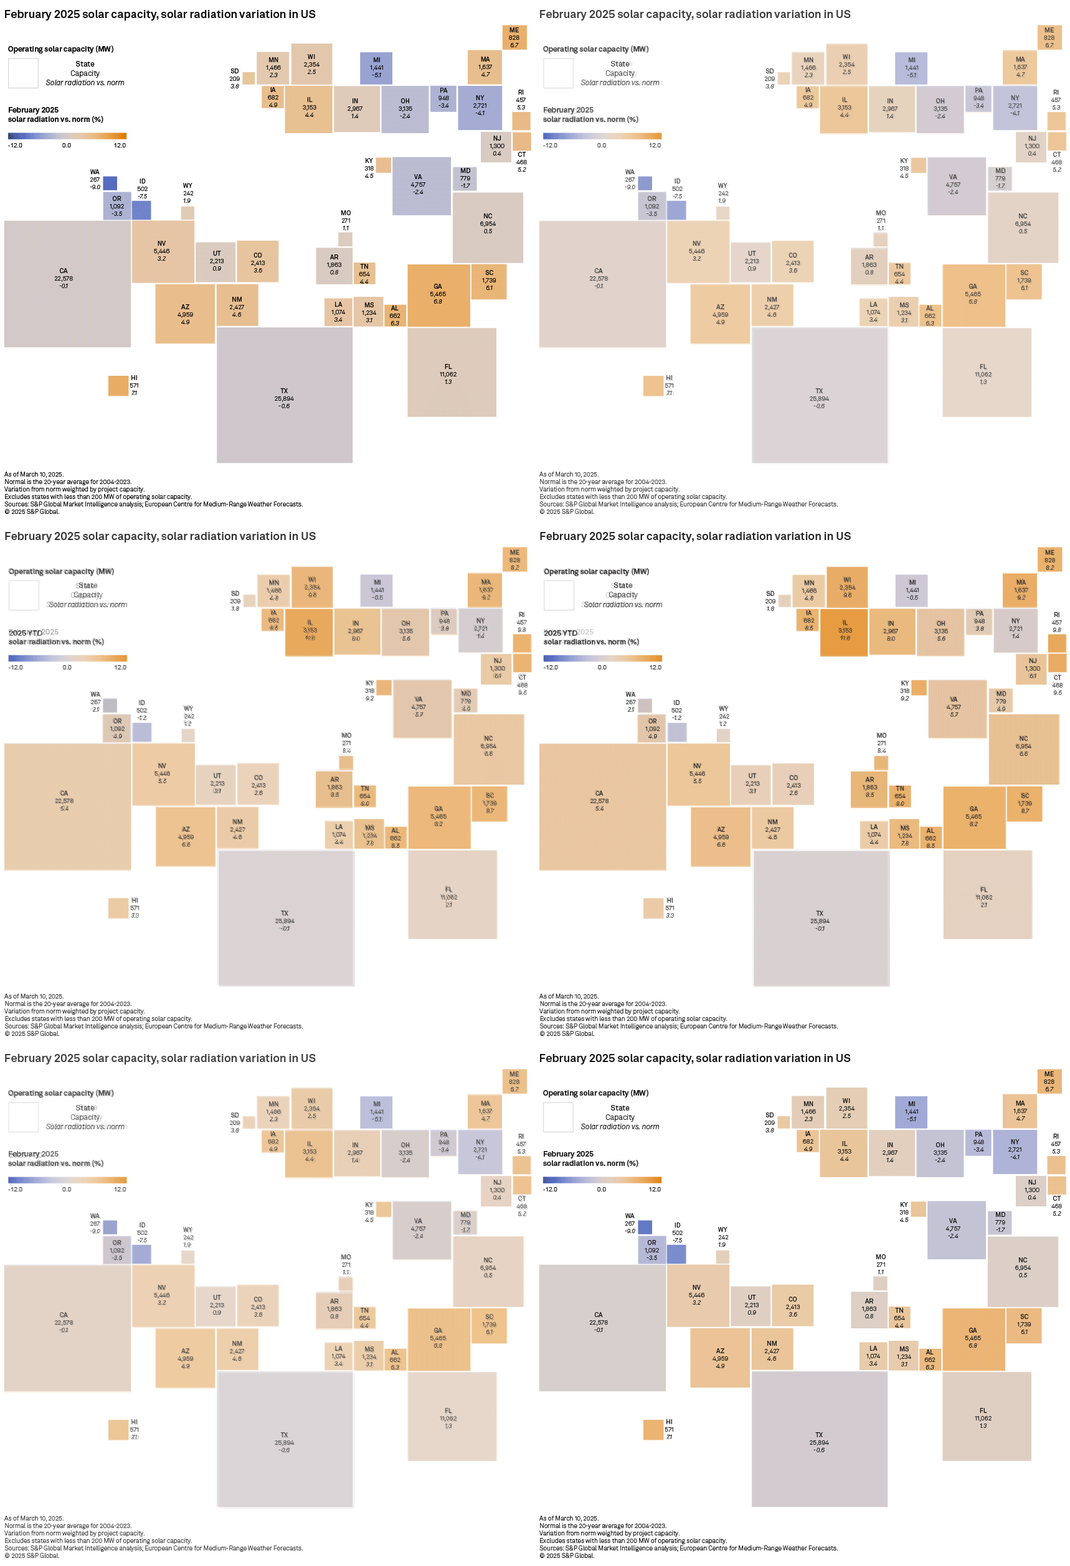
The 130.2 GW of operating solar capacity in the US experienced solar radiation 1.0% above normal in February, while the 153.7 GW of wind capacity experienced wind speeds that were down 2.9%. Given that the January deviations showed the same split, year-to-date deviations have the same pattern.
Wind
The total operating capacity for wind energy in the US stands at 153.7 GW, with a monthly wind speed deviation of -2.9% and a year-to-date deviation of -2.4%. Texas remains the leader in wind energy generation, boasting an impressive 42.5 GW capacity. However, the state experienced a monthly deviation of -4.7% and a year-to-date deviation of -3.7%.
Download data details in Excel.

Utah reported the largest positive deviation in February, at 27.0%, and the most positive year-to-date deviation, at 18.7%, with a capacity of 390 MW. In contrast, Hawaii recorded the largest negative deviation in February, at -40.6%, and the most negative year-to-date deviation, at -25.3%, with a capacity of only 226 MW.
Among individual projects, Great Prairie Wind Project in Texas is the leader by capacity, at 1,027.0 MW; it showed a monthly deviation of -0.3% and a year-to-date deviation of -1.1%. For second-placed Traverse Wind Energy Center (North Central Energy Facilities) in Oklahoma, with a similar 999.0 MW, the deviations were larger: -2.5% and -4.0%, respectively.
The 102.0-MW Milford Wind Corridor Project II in Utah reported the largest positive monthly deviation at 30.7%. The 69.0-MW Third Isle Wind Farm (Kawailoa Wind) in Hawaii had the largest negative monthly deviation at -47.0%.
The 24.6-MW Eva Creek Wind Project in Alaska recorded the largest positive deviation in the year to date, at 27.2%. Stateline Energy Center (WA) and Stateline Energy Center (OR) in Washington and Oregon, respectively, had the most negative year-to-date deviation at -32.1%, with a combined capacity of 299.7 MW.
Solar
In solar energy, the total operating capacity reached 130,189 MW, with a monthly deviation of 1.0% and a year-to-date deviation of 4.5%. Texas led the way with an operating capacity of 25,894 MW, experiencing near-normal solar radiation, with a slight monthly deviation of -0.6% and a year-to-date deviation of -0.1%.
Hawaii reported the largest positive deviation in solar radiation in February, at 7.1%, with a capacity of 571 MW, while Washington had the largest negative monthly deviation, at -9.0%, with a capacity of 267 MW.

For year-to-date performance, Illinois topped the charts with an 11.8% deviation, while Idaho recorded the largest negative year-to-date deviation at -1.2%. Only three states with more than 200 MW of capacity have year-to-date solar radiation deviations below zero: Texas, Michigan and Idaho.
The 690.0-MW Gemini Solar Project in Nevada led in capacity among solar projects; it showed a monthly deviation of 4.7% and a year-to-date deviation of 6.4%. Second-placed 600.0-MW Danish Fields Solar Plant in Texas had a very different experience, with a monthly deviation of -2.1% and a year-to-date deviation of -6.0%. The 12.0-MW Anahola Solar Energy Project in Hawaii had the largest positive deviation in February, at 14.1%. Six solar projects in New York reported the largest negative monthly deviation, at -17.3%, and the largest year-to-date deviation, at -9.5%, with a total capacity of 24.2 MW. The six projects are: Fredonia Solar Project, Hanover Solar Project (RIC - Hanover), Rak 1 Solar Project, Rak 2 Solar Project, Sheridan CSG 2 Solar Project (Rivard 2) and Silver Creek Solar Project.
The IMPA Washington Solar Park and IMPA Washington Solar Park 2 in Indiana recorded the largest positive deviation in the year to date, at 13.5%, on a combined capacity of 13.9 MW.
Solar radiation is the mean surface downward shortwave radiation flux, measured from the fifth-generation European Centre for Medium-Range Weather Forecasts reanalysis. This variable includes direct and diffused solar radiation and is the model equivalent of global horizontal irradiance — the value measured by a pyranometer, a solar radiation measuring instrument. Wind speed is the value 100m above the ground from the same data set. The data is available at quarter-degree latitudes and longitudes, with a spacing of slightly over 27.5 km. This analysis compares the 2025 February values with the 20-year average (2004–2023) for February.
Data visualization by Rameez Ali.
For wholesale prices and supply and demand projections, see the S&P Global Market Intelligence Power Forecast.
For a complete, searchable listing of RRA's in-depth research and analysis, please go to the S&P Capital IQ Pro Energy Research Library.
Regulatory Research Associates is a group within S&P Global Commodity Insights.
S&P Global Commodity Insights produces content for distribution on S&P Capital IQ Pro.
Theme
Location
Products & Offerings
Segment
