S&P Global Offerings
Featured Topics
Featured Products
Events
S&P Global Offerings
Featured Topics
Featured Products
Events
S&P Global Offerings
Featured Topics
Featured Products
Events
S&P Global Offerings
Featured Topics
Featured Products
Events
Corporations
Financial Institutions
Banking & Capital Markets
Economy & Finance
Energy Transition & Sustainability
Technology & Innovation
Podcasts & Newsletters
Corporations
Financial Institutions
Banking & Capital Markets
Economy & Finance
Energy Transition & Sustainability
Technology & Innovation
Podcasts & Newsletters
15 Apr, 2020
A recent article[1] published by S&P Global Ratings indicates cash flow slumps and default rates spiking across multiple industries as a result from the economic slowdown caused by COVID-19. Unlike previous crises, such as the dotcom corrections in year 1999 to 2000, the global financial crisis of 2008 or even the energy price correction in year 2014, the COVID-19 virus has affected multiple geographies and sectors at the same time, creating multiple “epicenters” of industry shocks.
In this blog, we provide a sample of data-driven charts that can answer questions on how this unprecedented slowdown could affect corporate credit risk. We focus on the resilience of corporates, bank lenders and sovereigns going into this crisis.
As an example, we look at the defaults and credit ratings transitions of the Building and Home Products industries in the United States, which were the epicenters of the mortgage defaults which later triggered the global financial crises in year 2008. These industries exhibit much higher defaults and downgrades of speculative credits during crisis periods than during normal market conditions.
S&P Global Ratings Downgrades of at least Three Notches: All sectors (Full period) vs. Real Estate & Construction Sectors[2] in the United States (Global Financial Crisis period from 2008 to 2011)
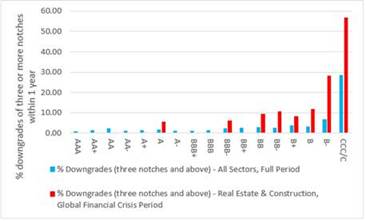
Source: CreditPro historical ratings transitions database from S&P Global Market Intelligence, as of April 1, 2020. For illustrative purposes only. Credit ratings are prepared by S&P Global Ratings. Full period is from 1981 to 2019. Crisis period from 2008 to 2011.
Issuer Defaults: All sectors (Full period) vs. Real Estate & Construction Sectors in the United States (Global Financial Crisis period from 2008 to 2011)
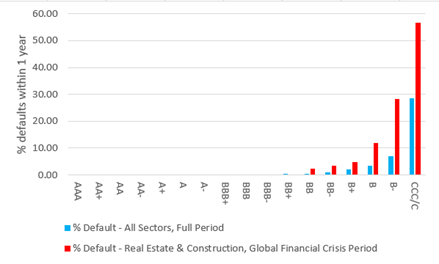
Source: CreditPro historical default database from S&P Global Market Intelligence, as of April 1, 2020. For illustrative purposes only. Credit ratings are prepared by S&P Global Ratings. Full period is from 1981 to 2019. Crisis period from 2008 to 2011.
Corporates across multiple sectors are heading into COVID-19 with high levels of leverage.
% Rated Corporates with “5 (Aggressive)” or “6 (Highly Leveraged)” Financial Risk Profile Scores, by Sector
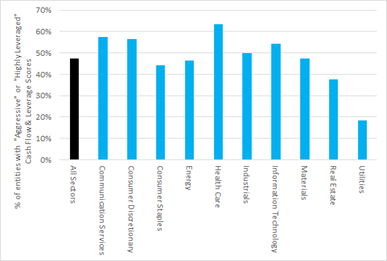
Source: RatingsXpress: S&P Global Ratings Scores & Factors Package, S&P Global Market Intelligence. As of April 1, 2020. For illustrative purposes only.
Most Rated Corporates have adequate liquidity. However, Energy and Real Estate enter the crisis from a weaker position than other sectors.
% Rated Corporates with “4 (Less than Adequate)” or “5 (Weak)” Liquidity Scores, by Sector
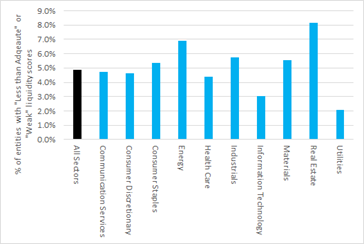
Source: RatingsXpress: S&P Global Ratings Scores & Factors, S&P Global Market Intelligence. As of April 1, 2020. For illustrative purposes only.
To maintain business volumes and to meet obligations in adverse circumstances, our data indicates:
Cross-Country Comparisons of Rated Banks: % Total Assets (USD) in banks with “Below Average” Funding Scores
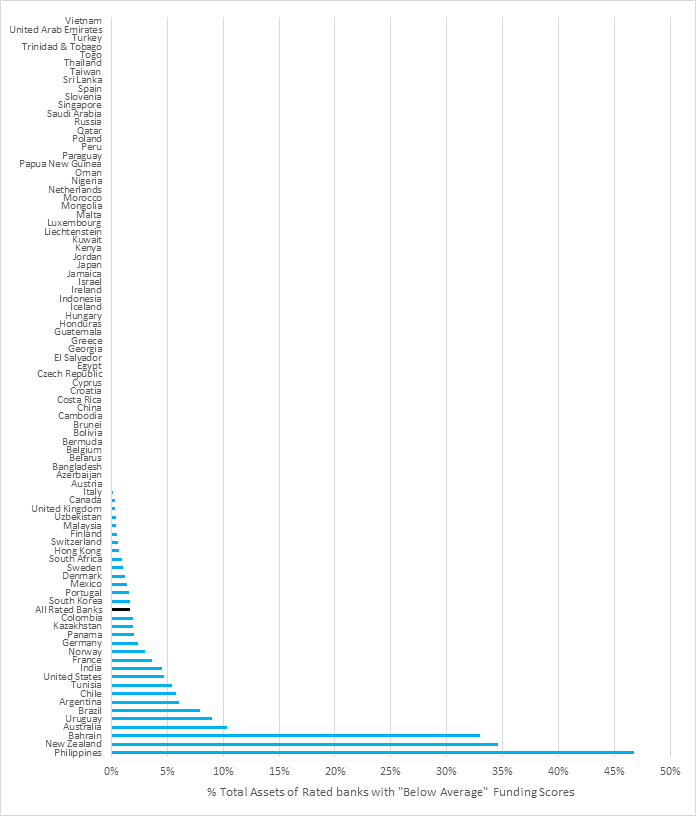
Source: Bank scores from RatingsXpress: S&P Global Ratings Scores & Factors, S&P Global Market Intelligence. Total Assets from RatingsXpress: CreditStats Direct, S&P Global Market Intelligence. As of April 1, 2020. For illustrative purposes only.
Banks in most countries have at least “Moderate” Capital and Earnings scores to absorb potential credit losses.
Cross-Country Comparisons of Rated Banks: % Total Assets (USD) in banks with “Weak” or “Very Weak” Capital and Earnings Scores
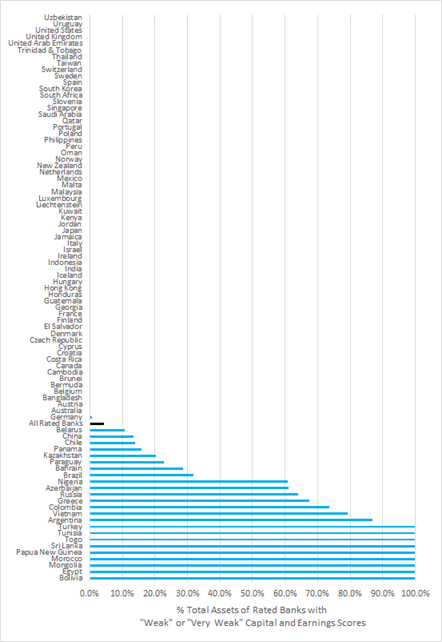
Source: Bank scores from RatingsXpress: S&P Global Ratings Scores & Factors, S&P Global Market Intelligence. Total Assets from RatingsXpress: CreditStats Direct, S&P Global Market Intelligence. As of April 1, 2020. For illustrative purposes only.
We find an interesting bifurcation of weakest and strongest Sovereigns, based on their Fiscal Assessment sub-scores.
Fiscal Assessment Sub-scores (by counts) distribution heat-map for Rated Sovereigns (on a scale of ‘1’ to ‘6’, strongest to weakest)
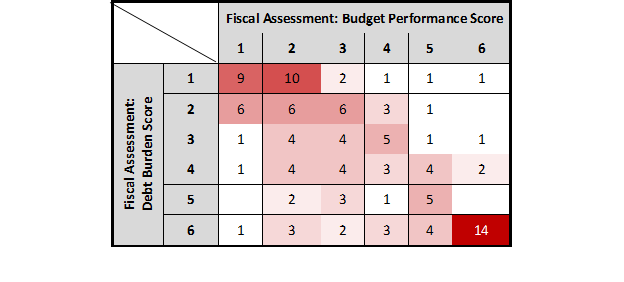
Source: RatingsXpress: Coming Release of S&P Global Ratings Scores & Factors, S&P Global Market Intelligence. As of April 2, 2020. For illustrative purposes only.
Reviewing these data-driven charts, pulled from our RatingsXpress products: CreditPro and RatingsXpress: S&P Global Ratings Scores & Factors, helps us to understand the potential impact of COVID-19 from a credit ratings perspective and to dive deeper by analyzing the underlying business, financial, industry, and economic risk factors and assessments. In doing so, we can better understand industry leverage and liquidity levels, the relative strength of banking systems based on their funding and liquidity levels, and the relative strength of sovereign governments based on their fiscal assessment scores.
Click here if you are interested in learning more about our RatingsXpress solutions used in this analysis.
[1] "COVID-19 Credit Update: The Sudden Economic Stop Will Bring Intense Credit Pressure", S&P Global Ratings, Dimitrijevic et al., Mar 17, 2020, retrieved from: https://www.spglobal.com/ratings/en/research/articles/200317-covid-19-credit-update-the-sudden-economic-stop-will-bring-intense-credit-pressure-11392437
[2] This includes S&P Global Ratings industries: Real Estate; and Forest & Building Products / Homebuilders
