Customer Logins
Obtain the data you need to make the most informed decisions by accessing our extensive portfolio of information, analytics, and expertise. Sign in to the product or service center of your choice.
Customer Logins
BLOG
Jan 16, 2020
Sustainability looms as sand suppliers divest non-core assets and rationalize capacity

Oil prices had their ups and downs in 2019, but the sentiment overall from a sub-segment of the upstream industry regarding their outlook is remarkably steady, as evidenced by the results of our recent proppant survey. Unfortunately, the assessment of the proppant industry specifically was quite negative, and indeed there were few indications at the end of 2019 that the proppant industry's fortunes would change in 2020.
The current steadiness in oil prices is surprising, especially given recent geo-political events, but surprisingly buoyant WTI levels have not deterred operators from pursuing a strategy they adopted all through 2019 which emphasized fiscal discipline over production growth. In this paradigm, operators are only spending "maintenance capex", with the aim of only maintaining current production levels while improving operational efficiencies for new wells. In short, operators have been told by their investors and debt-holders that they must do more with less to achieve positive free-cash flow with smaller budgets than before.
This cut in spending has of course affected the proppant market, which continues to reel from persistently oversupplied conditions. As a result, volatility in spot pricing is ongoing, owing to continued inventory 'fire-sales' and distress-related cash grabs (IHS Markit estimates normalized average contract pricing at approximately USD20/ton and USD29/ton for Northern White Sand (NWS) and regional/in-basin sand, respectively).
In the long-term this is not sustainable, but the situation will not change until there is substantially more blood-letting than there already has been: some companies have not only divested as much of their non-core assets as possible, but also exhausted as many cost-cutting tactics as possible, and yet this has still not been enough to keep them solvent.
Unfortunately, there will be no relief from projected demand. We expect North American proppant demand to remain stable in the near-term, anchored by the Permian Basin which commands a leading share of 48% by mass. In a slightly more positive development for suppliers, recent trends show gently increasing laterals and shortening stage lengths, which has led to a rise in stages per well and per stage proppant intensities, largely seen in the Delaware, DJ Basin, Powder River, and Haynesville, as well as the Williston Basin and the Eagle Ford to a slighter degree.
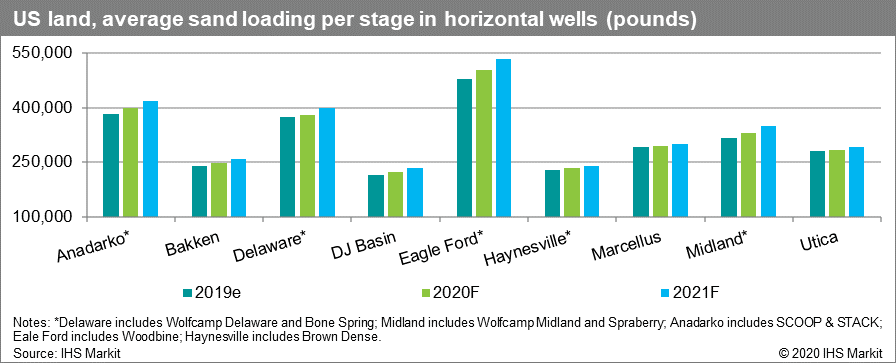
Figure 1: US land, average sand loading per stage in horizontal
wells (pounds)
Against the backdrop of this depressed market, and largely because of it, the question for operators of whether to choose high quality NWS or fit-for-purpose, cheaper regional sand is still open, but will remain purely preferential until commodity pricing allows for the minor difference in price to become wholly irrelevant. Until then, regional sands are favored in the most active basins, and recently there have even been regional sand sources added in Utah and North Dakota.
IHS Markit approximates the total North American (NA) sand supply to be heavily weighted at 68% regional and in-basin sand, with over half of the NA supply mined in Texas. We estimate total available NA supply to be roughly 202 million short tons per year (MMt/y), with nearly 75 MMt/y apportioned to Permian regional/in-basin sand alone. In total, NA realized a marginal decline of approximately 6%, and while this is a positive development for the market, more must be done before recovery is in sight.
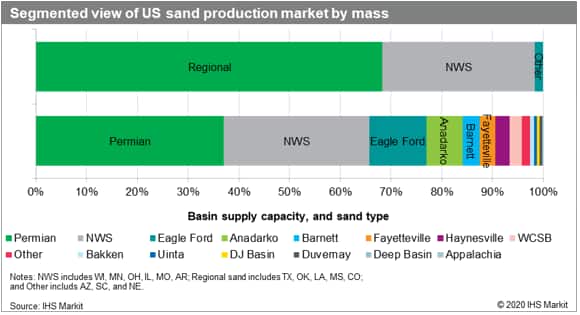
Figure 2: Segmented view of US sand production market by
mass
The resin-coated sand (RCS) market continues to contract and would require higher commodity pricing to see even the smallest spike in demand. It remains to be seen if RCS producers can make the economic case that their costs to increase volumes are justified relative to their current RCS loads as well as utilizing more inexpensive, presumably regional sand. Overall, RCS remains a relevant component of completion design, but its adoption is very dependent on higher commodity pricing.
Until oil prices reach a level deemed "safe" by operators to keep exploring RCS further, producers will continue not only to push the back-end, positive economic benefits, but also emphasize RCS' technological benefits. Recently, the focus has been on coating technology that not only offers the benefits of traditional RCS but also reduces flowback and formation water.
Finally, the situation continues to be touch and go for the Canadian market as regulatory challenges remain volatile and uncertain. More changes from the Province of Alberta came on October 31st, 2019, as the provincial government announced curtailment relief by which which operators will be given a special production allowance for additional crude production, provided this crude is moved to market via incremental rail.
Learn more about our ProppantIQ services.
Brandon Savisky is a Principal Research Analyst at IHS Markit.
Posted 16 January 2020.
This article was published by S&P Global Commodity Insights and not by S&P Global Ratings, which is a separately managed division of S&P Global.
{"items" : [
{"name":"share","enabled":true,"desc":"<strong>Share</strong>","mobdesc":"Share","options":[ {"name":"facebook","url":"https://www.facebook.com/sharer.php?u=http%3a%2f%2fwww.spglobal.com%2fesg%2fs1%2fresearch-analysis%2fsustainability-looms-as-sand-suppliers-divest-noncore-assets.html","enabled":true},{"name":"twitter","url":"https://twitter.com/intent/tweet?url=http%3a%2f%2fwww.spglobal.com%2fesg%2fs1%2fresearch-analysis%2fsustainability-looms-as-sand-suppliers-divest-noncore-assets.html&text=Sustainability+looms+as+sand+suppliers+divest+non-core+assets+and+rationalize+capacity++%7c+S%26P+Global+","enabled":true},{"name":"linkedin","url":"https://www.linkedin.com/sharing/share-offsite/?url=http%3a%2f%2fwww.spglobal.com%2fesg%2fs1%2fresearch-analysis%2fsustainability-looms-as-sand-suppliers-divest-noncore-assets.html","enabled":true},{"name":"email","url":"?subject=Sustainability looms as sand suppliers divest non-core assets and rationalize capacity | S&P Global &body=http%3a%2f%2fwww.spglobal.com%2fesg%2fs1%2fresearch-analysis%2fsustainability-looms-as-sand-suppliers-divest-noncore-assets.html","enabled":true},{"name":"whatsapp","url":"https://api.whatsapp.com/send?text=Sustainability+looms+as+sand+suppliers+divest+non-core+assets+and+rationalize+capacity++%7c+S%26P+Global+ http%3a%2f%2fwww.spglobal.com%2fesg%2fs1%2fresearch-analysis%2fsustainability-looms-as-sand-suppliers-divest-noncore-assets.html","enabled":true}]}, {"name":"rtt","enabled":true,"mobdesc":"Top"}
]}