EXECUTIVE SUMMARY
• Mid- and small-cap U.S. equities represent a significant piece of the global market, but they are overlooked by many international investors, particularly those in Europe.
• The S&P MidCap 400® and S&P SmallCap 600® are simple, transparent benchmarks for U.S. mid and small caps. Over the past 20 years, they have outperformed the S&P 500, as well as a majority of actively managed U.S. equity funds in their respective size segment.
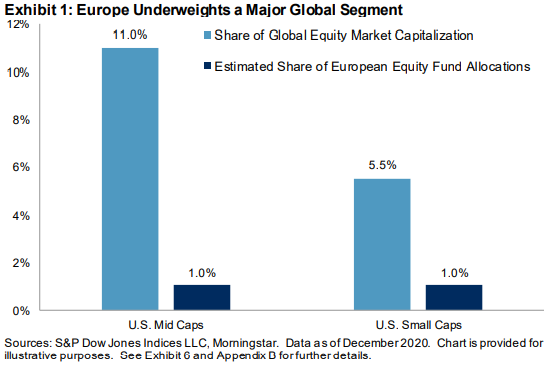
• Exhibit 1 summarizes the potential opportunity set for diversification by European fund investors, comparing the global equity market weight of U.S. small and mid caps to their estimated aggregate allocations within European-based equity funds.

INTRODUCTION
The U.S. stock market includes many of the world's largest and best-known companies, and investors the world over have allocated capital to U.S. equities. However, many investors appear to have explored little beyond the so-called "blue chips." As shown in Exhibit 1, European fund investors, in particular, have relatively minimal exposure to small- or mid-sized U.S. equities.
This lack of interest is puzzling, not least because U.S. mid and small caps represent significant market segments in absolute terms. At the end of 2020, the S&P MidCap 400 alone had a market capitalization similar to the entire French stock market, while the U.K.'s stock market, the largest in Europe, was roughly the same size as the mid- and small-cap indices combined.
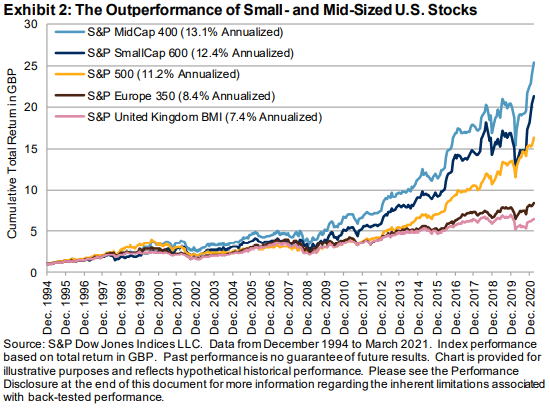
Adding to the puzzle, historical performance is unlikely to have been a deterrent to European investors; the S&P MidCap 400 and S&P SmallCap 600 significantly outperformed the S&P 500, S&P United Kingdom BMI, and S&P Europe 350® over the past 26 years. Exhibit 2 illustrates their performance graphically (British pound, euro, and U.S. dollar performances are reported in Exhibit 10).


