IN THIS LIST

Charting New Frontiers: The S&P 500® ESG Index’s Outperformance of the S&P 500

A Systematic Approach for Identifying Companies with Economic Moats

Worth the Weight

Natural Selection: Tactics and Strategy with Equity Sectors

ETFs in Insurance General Accounts – 2024

Charting New Frontiers: The S&P 500® ESG Index’s Outperformance of the S&P 500

Contributor Image
Maya Beyhan

Global Head of Sustainability, Index Investment Strategy

S&P Dow Jones Indices

Introduction

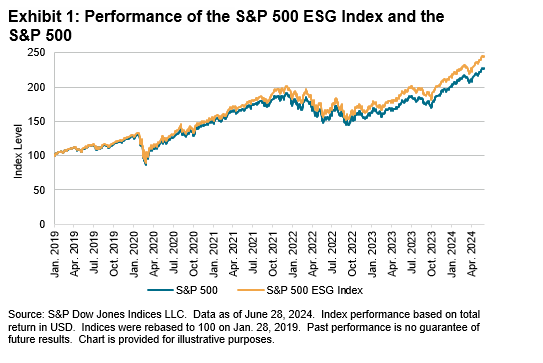
The investment landscape has witnessed a significant shift toward sustainability in recent years, with growing emphasis on ESG considerations without sacrificing performance.  In this environment, the S&P 500 ESG Index has emerged as a remarkable benchmark, improving ESG scores while also performing similarly to or even better than the S&P 500 since its launch, more than five years ago (see Exhibit 1).

Charting New Frontiers: The S&P 500® ESG Index’s Outperformance of the S&P 500: Exhibit 1

In this reflective analysis, we embark on a journey to dissect the underpinnings of performance for the S&P 500 ESG Index, demonstrating that its success is not solely attributable to sector selection, but is also driven by factors such as selection among higher and lower ESG-scoring constituents, ESG momentum, as well as the Social pillar within ESG.

Exploration beyond Sector Weights

Launched on Jan. 28, 2019, the S&P 500 ESG Index measures the performance of securities that met certain ESG criteria, while maintaining similar overall industry group weights as the S&P 500, using S&P Global ESG Scores as the defining constituent selection characteristic.

Exhibit 2 details the long-term performance and tracking error of the S&P 500 ESG Index relative to the S&P 500.

Charting New Frontiers: The S&P 500® ESG Index’s Outperformance of the S&P 500: Exhibit 2

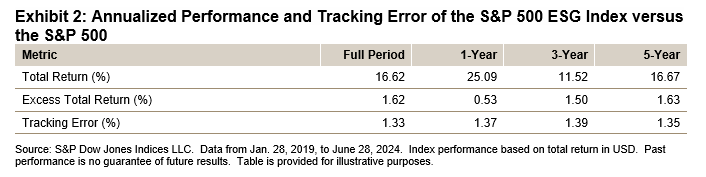
This live performance data covers an extraordinary period of contrasting market regimes, which on an almost annual basis over the five years since the index’s launch alternated between bull and bear markets.  The S&P 500 ESG Index outperformed the S&P 500 over 1, 3 and 5 years while maintaining a tracking error of 1.33%, in annualized terms, since its inception.  What intricate tapestry of factors contributed to this performance?

One common critique of sustainability indices is that their tendency to underweight or overweight certain sectors potentially skews performance outcomes.  However, a closer examination of the S&P 500 ESG Index reveals that its outperformance has been driven by stock selection rather than sector weighting. This is illustrated in Exhibit 3 using a Brinson attribution analysis to measure the contribution of sector weighting and stock selection effects to the S&P 500 ESG Index’s excess return relative to the S&P 500. To emphasize the relative impact of sector weighting and stock selection effects, Exhibit 3 shows the proportion of the total impact (so that their absolute values sum to 100%); actual return impact is shown in the labels.

pdf-icon PD F Download Full Article

A Systematic Approach for Identifying Companies with Economic Moats

Contributor Image
Rupert Watts

Head of Factors and Dividends

S&P Dow Jones Indices

Contributor Image
George Valantasis

Associate Director, Factors and Dividends

S&P Dow Jones Indices

Contributor Image
César Ruelas

Senior Analyst, Global Research & Design

S&P Dow Jones Indices

Introduction

Popularized by Warren Buffett, the term “economic moat” refers to a sustainable competitive advantage that enables a company to protect its market share and generate high profitability over the long term.  This advantage can stem from many factors such as network effects, economies of scale, strong brand recognition and high switching costs.  Due to the potential financial rewards associated with investing in companies with a wide economic moat, some market participants consider these companies highly desirable.

In April 2024, S&P DJI launched the S&P 500® Economic Moat Index, which focuses on tracking companies from the S&P 500 that have been identified as having a wide economic moat.  What sets this index apart is its purely quantitative approach to identifying these companies.

A quantitative approach may offer several advantages when identifying a company’s economic moat.  First, it provides an objective evaluation that eliminates subjective biases that are often associated with qualitative analysis, such as anchoring bias.  Second, a quantitative approach provides a standardized method of evaluation, ensuring consistent identification across industries over time.  Lastly, it enables investors to examine back-tested data, which is not possible with a qualitative analyst-driven strategy. Overall, a quantitative approach offers objectivity, consistency and the ability to analyze historical performance, making it a valuable tool in identifying economic moats.

Construction Approach

Determining a company’s economic moat requires a comprehensive approach that goes beyond relying on a single quantitative measure.  Instead, it requires the use of multiple metrics that complement each other.  Consistency is another critical aspect to consider, as the ability to consistently generate high returns is indicative of a wide moat.  Therefore, it is important to analyze the metrics over multiple periods to provide a more accurate understanding of the strength and durability of its economic moat.

pdf-icon PD F Download Full Article

Worth the Weight

Contributor Image
Tim Edwards

Managing Director and Global Head of Index Investment Strategy

S&P Dow Jones Indices

Contributor Image
Anu R. Ganti

U.S. Head of Index Investment Strategy

S&P Dow Jones Indices

Contributor Image
Hamish Preston

Head of U.S. Equities

S&P Dow Jones Indices

“It takes 500 small details to add up to one favorable impression."

Cary Grant

The S&P 500® Equal Weight Index has outperformed the S&P 500® over more than two decades of live history, with a similar long-term rate of excess returns observed over a hypothetical back-tested history extending back to 1970 (see Exhibit 1).  These observations are not new, but an equal weight approach to large-cap U.S. equities may be of particular interest in times such as the present, when the equity markets are at high levels of market concentration relative to history.

In the context of the current market dynamics, this paper summarizes a wide range of observations on the potential sources and drivers of relative performance in the S&P 500 Equal Weight Index—ranging from market concentration to sector, factor and single-stock perspectives.

Worth the Weight: Exhibit 1

The Current Market Context

The U.S. equity market has, among other features, been recently characterized by strongly extended price trends and the relative dominance of a few mega-cap companies.  This could make equal weight strategies particularly interesting because, first, trends in concentration and momentum tend to reverse at some point (even if it is hard to identify when that will occur) and second, because diversification strategies can be more important when markets are relatively concentrated.

There are numerous ways to see that the U.S. equity market is unusually concentrated at present. Particularly germane to comparisons between equal- and market-cap-weighted indices is that as of June 28, 2024, the (unweighted) average market capitalization of the S&P 500 constituents was USD 96.3 billion dollars but, in contrast, the index-weighted average market capitalization was USD 998.6 billion dollars.  In other words, a strategy tracking the S&P 500 would—on a portfolio-weighted basis—have an average market capitalization more than ten times larger than an equally weighted one.

Using this ratio (between the weighted and unweighted average market cap) to represent “concentration,” we can see that concentration has risen sharply over the past 10 years, recently reaching extremes not seen for more than half a century (see Exhibit 2a).

Worth the Weight: Exhibit 2

pdf-icon PD F Download Full Article

Natural Selection: Tactics and Strategy with Equity Sectors

Contributor Image
Joseph Nelesen, Ph.D.

Head of Specialists, Index Investment Strategy

S&P Dow Jones Indices

Contributor Image
Tim Edwards

Managing Director and Global Head of Index Investment Strategy

S&P Dow Jones Indices

In recent years, the S&P 500® sectors have exhibited elevated dispersion, including their widest-ever spread between the best and worst performers in 2022, highlighting an opportunity for studying the impact of sector selection (see Exhibit 1). In a rapidly evolving global investment landscape, S&P 500 sectors remain tools in active and passive portfolio construction and worthy of consideration.

In this paper, we will:

  • Review sector characteristics, performance and influence on stock returns;
  • Evaluate the impact of skew on active selection of stocks, sectors and industries;
  • Present case studies on strategic and tactical portfolio applications of sector indices.

S&P 500 Sector Best-Worst Total Return Spread (Annual): Exhibit 1

1. Introduction

“Look deep into nature, and then you will understand everything better.”

Albert Einstein

Imagine equity markets as a deep rainforest, grown dense through the centuries with new ways of investing, constantly born out of soil made from those that came and went long before. Teeming with life and ripe for exploration, this nested series of complex systems perpetually lures intrepid investors seeking answers to the questions: What features drive the behavior of a stock, and how can those help us make sense of the world?  As colorful and novel species in this evolving landscape attract the adventurer’s curiosity, so too should a curiously old and large tree with many branches found towering above the canopy.  Like sectors, this tree not only endures, but also remains intertwined with the ecosystem of stocks that surround it, providing clues on how to thrive in constantly evolving conditions.

In this paper, we explore how the enduring power of sectors and industries helps to define markets and serve as the framework for myriad investing strategies.  Just as the allure of active stock selection persists, so too does evidence that outperformance relative to indices is elusive.  Decades of data suggest that sectors and industries may sometimes be more effective exposures than single stocks to diversify risk and express views on market and economic conditions around the world. 

We will review past performance of sectors through the lens of 21st century market cycles, identify consistent patterns that continue to make sectors useful and highlight the potential of sectors to improve diversification and performance in global portfolios.

Sectors and industries concentrate securities with similar business models and risk factors, aligning company types around characteristics that largely transcend borders and make them relevant for investors worldwide. The growing use of sectors and industries among diverse investor types in a wide and growing array of liquid index-based strategies and holding periods is reflected in asset levels for related exchange-traded funds (ETFs; see Exhibit 2).  This paper examines historical sector and industry index performance and tests strategic long-term use of one or more sectors to gain consistent exposure or correct an unintended bias, as well as tactical use with the intent of adjusting allocations depending on market or economic conditions.  The outcomes reaffirm the enduring power of sectors and industries as building blocks in modern equity allocations.

pdf-icon PD F Download Full Article

ETFs in Insurance General Accounts – 2024

Contributor Image
Kelsey Stokes

Sales Head, Insurance

S&P Dow Jones Indices

Contributor Image
Anu R. Ganti

U.S. Head of Index Investment Strategy

S&P Dow Jones Indices

Introduction

In 2023, U.S. insurers held USD 34.4 billion in exchange-traded funds (ETFs).  For the second year in a row, we saw large outflows from large insurers.  In 2022, the bear market exacerbated the outflows to decrease AUM by 23%.  In 2023, the market acted against the outflows and AUM only decreased by 6%.

One company selling fixed income ETFs accounted for 50% of the outflows.  These outflows accounted for most of the fixed income outflows.  A more diversified set of companies selling equities accounted for the other half of the outflows.  The combined outflows over 2022 and 2023 has altered the profile of ETF holdings by insurers.  In our ninth annual study of ETF usage by U.S. insurance general accounts, we review ETF usage across various types of companies and across different asset classes.  We also analyze how trading patterns have varied over the years.

Holding Analysis

As of year-end 2023, U.S. insurers invested USD 34.4 billion in ETFs.  This is a fraction of the USD 8.1 trillion in U.S. ETF AUM, as well as the USD 8.4 trillion in insurance general account assets.  Exhibit 1 shows the use of ETFs by U.S. insurers over the past 20 years.

ETFs in Insurance General Accounts – 2024 : Exhibit 1

pdf-icon PD F Download Full Article

Processing ...