Introduction
Launched Oct. 28, 1994, the S&P SmallCap 600® has provided market participants with a way to measure the small-cap U.S. equity segment for nearly 30 years. It is part of the S&P Composite 1500® with the other components being the large-cap S&P 500® and the S&P MidCap 400®. The S&P 600® serves as the basis for an ecosystem of financial products and is widely used as a benchmark for small-cap active managers.
This paper explores the following aspects of the S&P 600:
− Showing the relevance of small-cap U.S. equities to investors around the world;
− Explaining the index’s construction and the resulting impact on index characteristics and performance; and
− Showing the potential benefits of an index-based approach to U.S. small-caps.
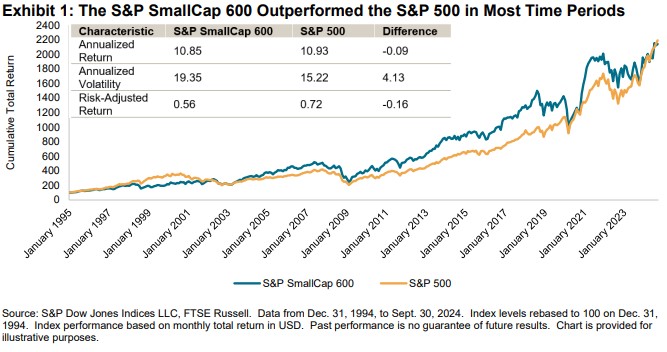
Exhibit 1 compares the historical performance of the S&P 500 and S&P 600. Despite mega-cap equities leading the way in recent years, the S&P 600 has outperformed the S&P 500 in most periods of time.

Why Small Cap?
The S&P 600 accounts for 2% of the U.S. equity market and 1% of the global equity market, as represented by the S&P Global BMI.
The S&P 600 is larger than 76 out of 86 markets covered by S&P DJI outside the U.S., with a market capitalization greater than 71% of the S&P Developed Ex-U.S. BMI, 87% of the S&P Emerging BMI, as well as all of the S&P Frontier BMI and standalone markets. This underscores the significant opportunity that small-cap U.S. equities represent relative to foreign domestic equity markets.
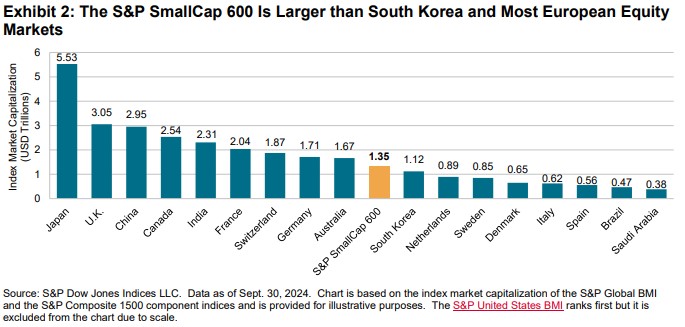
Exhibit 2 shows that the S&P 600 has a market capitalization of USD 1.4 trillion, which is larger than the entire South Korean equity market and exceeds nearly all European single-country equity markets, with the exception of the U.K., France, Switzerland and Germany.

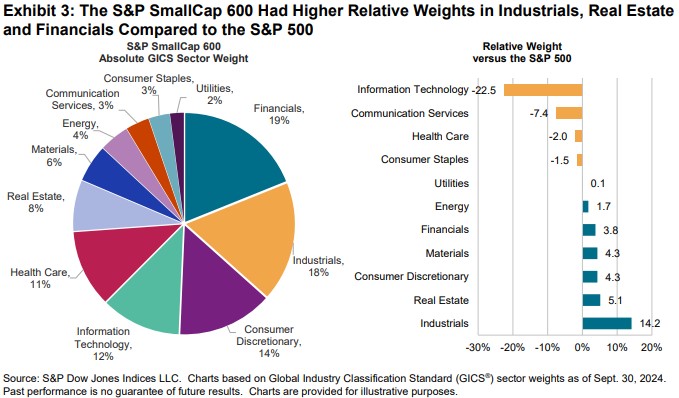
While the sheer size of the index explains why small caps are relevant to investors globally, the index’s differences in sector makeup from large-cap indices provides an interesting case as well. The S&P 600 has a higher weighting to more domestically focused and sensitive sectors such as Industrials, Financials and Real Estate, and a lower weight to segments such as Information Technology.


