IN THIS LIST

A Survey of Mexican Insurance Investment Officers - H2 2020

Indexing Risk Parity Strategies

Evaluating Passive Value Strategies

Sector Effects During Elections

Conviction, Confidence, and Courage

A Survey of Mexican Insurance Investment Officers - H2 2020

Contributor Image
Kelsey Stokes

Sales Head, Insurance

S&P Dow Jones Indices

OVERVIEW

In early 2020, S&P Dow Jones Indices and the Association of Mexican Insurance Companies (AMIS) conducted our second annual survey of insurance investment officers in Mexico to gather their perspectives on investments and the state of the local insurance industry. The survey closed at the end of February 2020, just before COVID-19 had begun to rapidly spread throughout North America.

Because of this, we felt it necessary to administer the survey again, this time in the second half of 2020, to better gauge investors' sentiments as they adjust to their "new normal." The objective of this survey was to better understand Mexican insurers' perspectives on the investment landscape, how companies invest and allocate their excess capital, and how their outlook and allocations may have changed in light of COVID-19.

This report summarizes insurers’ views on the following topics:

• Investment concerns and risks;
• Economic and credit rating expectations for the remainder of 2020;
• Investments and asset allocation, with a focus on excess capital; and
• Investment trends, including ESG and passive investing.

INVESTMENT CONCERNS AND RISKS

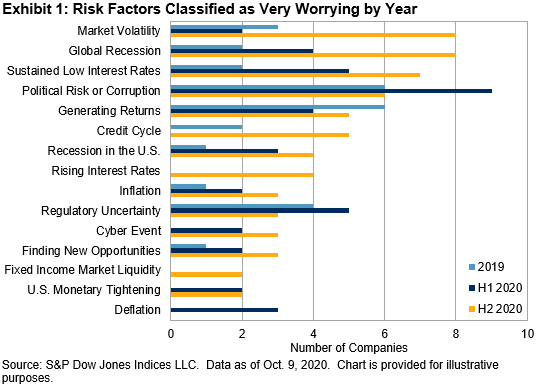
One of the most significant shifts the H2 2020 survey results highlighted was in insurers' investment concerns. Respondents indicated their level of worry—very worried, somewhat worried, not worried, and no opinion—about a number of investment-related risk factors. The number of risk factors they classified as very or somewhat worrying increased from 59% in H1 2020 to 72% in H2 2020.

While insurers were more concerned overall about a range of risks, the nature of which risks were most concerning also shifted. Exhibit 1 shows the frequency with which respondents described a risk as very worrying; risk factors like the credit cycle, a global recession, and market volatility, which were previously of lesser concern, now appeared to be more top of mind.

A Survey of Mexican Insurance Investment Officers - H2 2020: Exhibit 1

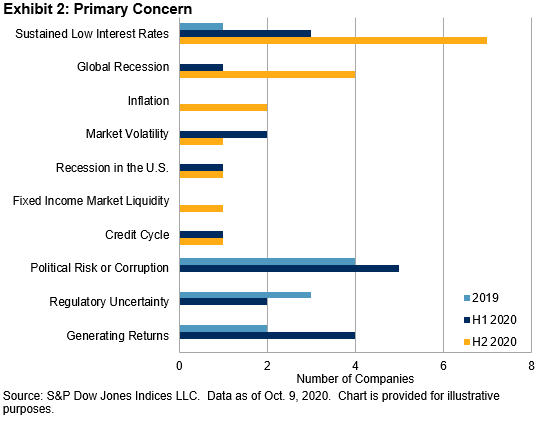
At the beginning of 2020, insurers were most concerned about political risk or corruption, generating returns, and the sustained low interest rate environment—only 16% of respondents cited low interest rates as their chief concern. The most recent data, however, tells a different story; 41% of respondents cited the sustained low interest rate environment as their greatest concern, followed by the threat of a global recession and inflation (see Exhibit 2). Additionally, insurers' three greatest concerns from 2019—political risk or corruption, regulatory uncertainty, and generating returns—were not among respondents' chief concerns in H2 2020.

A Survey of Mexican Insurance Investment Officers - H2 2020: Exhibit 2

Insurers' shifting concerns illustrate the impact COVID-19 has had; this impact also appears in respondents' outlook on credit ratings, asset allocation, and expected returns.

pdf-icon PD F Download Full Article

Indexing Risk Parity Strategies

Contributor Image
Phillip Brzenk

Managing Director, Global Head of Multi-Asset Indices

S&P Dow Jones Indices

INTRODUCTION

The S&P Risk Parity Index Series provides a transparent, rules-based benchmark for equal-risk-weighted parity strategies.  These indices construct risk parity portfolios by using futures to represent multiple asset classes and the risk/return characteristics of funds offered in the risk parity space.  Because risk parity funds can have different volatility targets, our series consists of four indices with different target volatility (TV) levels: 8%, 10%, 12%, and 15%.

Modern Portfolio Theory (MPT), introduced by Harry Markowitz in 1952, sets the framework for market participants to potentially maximize portfolio returns for a given level of risk.  The theory favors portfolio diversification by holding non-correlated assets.  That is, it does not view individual asset returns and volatilities in isolation; rather, it takes into account the co-movements, or correlations, of asset returns that comprise a portfolio.

The theory, along with the expectation that long-term asset class Sharpe ratios are similar (Dalio et al., 2015), act as foundational pieces of risk parity. Risk parity strategies propose that portfolio diversification, defined as achieving the highest return per unit of risk, can be maximized when a portfolio’s assets contribute equally to total portfolio risk.

Since the launch of the first risk parity fund, Bridgewater's All Weather Fund in 1996, many asset managers have offered their version of risk parity to clients. The risk parity industry especially gained traction in the aftermath of the 2008 global financial crisis, growing to an estimated USD 150-175 billion at year-end 2017 according to the IMF (Antoshin et al., 2018).

In the past, such strategies lacked an appropriate benchmark, leaving most investors to benchmark against a traditional 60/40 equity/bond portfolio. The problem with this approach is that a 60/40 portfolio reflects neither the construction nor the risk/return characteristics of risk parity strategies. While portfolio risk is generally considered to be diversified in U.S. dollar terms, the reality is that nearly all of the risk arises from the 60% allocation to equities. Additionally, when a portfolio is equal-risk weighted as opposed to equal weighted, it may lead to superior risk-adjusted returns.

In the first part of this paper, we cover the economic rationale for implementing a risk parity approach in a multi-asset portfolio construction. In the second part of the paper, we give an overview of the S&P Risk Parity Indices.

pdf-icon PD F Download Full Article

Evaluating Passive Value Strategies

Contributor Image
Jason Ye

Director, Factors and Thematics Indices

S&P Dow Jones Indices

EXECUTIVE SUMMARY

  • S&P Dow Jones Indices produces three families of value indices—the S&P Value Indices, the S&P Pure Value Indices, and the S&P Enhanced Value Indices. These families were developed with specific objectives in mind and have nuances of which market participants should be aware.  In this paper, we use the S&P 500® Value, the S&P 500 Pure Value, and the S&P 500 Enhanced Value Index to illustrate the differences.
  • The S&P 500 Value is a broad market, capitalization-weighted index with a large investment capacity for products tracking the index. This makes it a relevant benchmark for performance evaluation, as well as making it suitable for those seeking a traditional “buy-and-hold” index-linked investment implementation with a tilt toward value style.  By design, this index has lower value exposure than the S&P 500 Pure Value and the S&P 500 Enhanced Value Index, as well as a lower tracking error against the S&P 500. 
  • The S&P 500 Pure Value is a high conviction value index. It aims for a higher exposure to the value style than the S&P 500 Value. Its style score weighting tilts aggressively toward value securities, but may limit the investment capacity of the products tracking this index relative to those tracking the S&P 500 Value and the S&P 500 Enhanced Value Index.
  • The S&P 500 Enhanced Value Index balances the tradeoff between value exposure and the capacity of products tracking the index.  Its modified cap weighting targets the value factor while maintaining weights tied to market capitalization.

INTRODUCTION

Value investing is a well-known strategy that seeks to exploit perceived differences between a security’s price and an assessment of its true underlying worth.  As intuitive and straightforward as the strategy sounds, there are several nuances to consider when constructing a value portfolio.  At S&P Dow Jones Indices, we offer several value indices for investors with different purposes.  An investor should consider carefully which is the most appropriate value index to use.

The S&P 500 Value and the S&P 500 Pure Value are part of the S&P U.S. Style Indices.  The S&P 500 Enhanced Value Index is part of the S&P Factor Indices.  The style indices are derived from traditional style boxes and are broadly used to determine the investment style of a fund.  Factors are the underlying primary drivers of risk and return within a portfolio.  Decades of research have documented several factors that provide a premium, such as value, quality, and low volatility.  Factor indices are designed to capture those premiums.

The differences between the S&P 500 Value and the S&P 500 Pure Value have been well documented in research by S&P DJI. This paper aims to serve as a complement to the existing research, while focusing on identifying the differences between the S&P 500 Pure Value and the S&P 500 Enhanced Value Index.  We will look into the index construction differences among the S&P 500 Value, the S&P 500 Pure Value, and the S&P 500 Enhanced Value Index and then discuss how variations in index construction lead to differences in risk/return profiles, characteristics, and risk exposures.

pdf-icon PD F Download Full Article

Sector Effects During Elections

Contributor Image
Craig Lazzara

Managing Director, Index Investment Strategy

S&P Dow Jones Indices

Contributor Image
Anu R. Ganti

U.S. Head of Index Investment Strategy

S&P Dow Jones Indices

“When we got into office, the thing that surprised me most was to find that things were just as bad as we'd been saying they were.”

- John F. Kennedy

EXECUTIVE SUMMARY

The value of stock selection skill rises when dispersion is high; a larger gap between winners and losers means that active equity managers have a better chance to display their selection abilities.1  This logic also applies to active managers operating at a higher level of aggregation, for example by expressing tactical market views through sector rotation. The importance of sectors tends to be greater than average during the Novembers when U.S. federal (and especially presidential) elections take place. Sector allocation decisions can add (or subtract) greater value in these months.  British and Canadian data are consistent with the U.S. results.

BACKGROUND

Dispersion, or the index-weighted standard deviation of returns, gives us a convenient way to measure the potential benefit of active decisions.2  Successful active managers—be they stock pickers, sector rotators, or factor investors—can add more value when dispersion is high than when it is low.3  Dispersion also provides a useful framework for understanding the importance of sectors in generating returns.

pdf-icon PD F Download Full Article

Conviction, Confidence, and Courage

Contributor Image
Craig Lazzara

Managing Director, Index Investment Strategy

S&P Dow Jones Indices

Contributor Image
Anu R. Ganti

U.S. Head of Index Investment Strategy

S&P Dow Jones Indices

EXECUTIVE SUMMARY

Never wish to show courage, a wise man once counseled; courage can be displayed only in circumstances where one’s natural instinct is to be afraid, and fear is an unpleasant emotion.  This principle, with obvious qualifications, applies to investment management.  Successful portfolio management can require holding positions when one’s natural instinct is to sell.

ONCE UPON A TIME

It is Dec. 31, 1999.  You are a professional portfolio manager pondering long-term stock selections for your clients.  You share Warren Buffet’s view that “Our favorite holding period is forever,” and you decide to ask each of your four favorite Wall Street forecasters to recommend a stock to hold indefinitely.  They obligingly recommend four different names, denoted for now as Stocks A through D, which you carefully consider.

You’re well aware that some recommendations work out better than others.  What might cause you to lose confidence in any of these four stocks?  Since you will be buying the stocks in the expectation that they will go up, and in fact will outperform the market, a period of disappointing returns might weaken your determination to hold forever.

While contemplating all this, you have been holding a very old bottle of wine that a friend gave you for your last birthday.  You open the bottle, thinking that a taste might help resolve your perplexity.  As you remove the cork, suddenly vapor spews out and a genie emerges.  In gratitude for your having released him, he offers you a wish.

Of course, what you wish is to know which of the four stocks will be the best performer for the next 20 years.  Unfortunately, our genie has been corked up with the wine for a bit too long.  He knows a good bit about volatility but very little about the returns of individual stocks.  The genie does know that the market will go up in the next 20 years, and that individual stock returns will be highly skewed, as Exhibit 1 illustrates.  The median stock in the S&P 500® will appreciate by 52%, well below the average appreciation of 239%.  Only 267 of the 1,010 stocks that will appear in the S&P 500 for the next 20 years will beat the average.

Having been made aware that a relatively small number of stocks will determine your success or failure, you’re happy to have whatever specific information you can get, and ask the genie to tell you what he knows about the four recommendations.

pdf-icon PD F Download Full Article

Processing ...