S&P Global Offerings
Featured Topics
Featured Products
Events
Our Services
Investment Themes
Explore new territories with greater confidence
Equity
Fixed Income
Commodities
Multi-Asset
Sustainability
Dividends & Factors
Thematics
Our Exchange Relationships
S&P DJI combines global reach with local expertise, working with exchanges around the world to build indices for both the local and international investment communities.
Education
SPIVA®
For over 20 years, our renowned SPIVA research has measured actively managed funds against their index benchmarks worldwide.
Events & Webinars
Register to attend complimentary webinars and deepen your knowledge of current trends and issues impacting the index universe today.
Governance
Methodologies
SPICE
Your Gateway to Index Data
Our Services
Professional Resources
Equity
Fixed Income
Commodities
Multi-Asset
Sustainability
Dividends & Factors
Thematics
Digital Assets
Indicators
Other Strategies
By Region
Our Exchange Relationships
S&P DJI combines global reach with local expertise, working with exchanges around the world to build indices for both the local and international investment communities.
Research & Insights
Education
Performance Reports
SPIVA®
For over 20 years, our renowned SPIVA research has measured actively managed funds against their index benchmarks worldwide.
Events & Webinars
Register to attend complimentary webinars and deepen your knowledge of current trends and issues impacting the index universe today.
Methodologies
SPICE
Your Gateway to Index Data
S&P Global Offerings
Featured Topics
Featured Products
Events
Language
SPICE is a flexible, easy-to-use platform that delivers a wealth of data on more than 400,000 indices. With expanded asset class coverage, new tools and features, and an expanse of current and historical index and constituent data, SPICE is more convenient and powerful than ever.
SPICE is a subscription-based platform. Click here to login.
Request Access
Interested in gaining access to SPICE? Fill the fields and a representative will be in touch with you.

Solutions for Every User
If you’re a portfolio manager, advisor, analyst, or other investment professional who uses index data or passive products, SPICE can help you with research, reporting, and analysis.

- Monitor intraday announcements of index-impacting corporate actions.
- Download data for ad-hoc analysis or to include in reports.
- Explore and evaluate indices as the underlying for passive products.

- Discover specialized benchmarks not readily available on vendor platforms.
- Explore and evaluate indices as the basis of passive investments.

- Research indices that underlie investment products.
- Download historical returns to determine how indices might perform together in a portfolio.
We also offer special packages for redistributors of our data, and for custom index clients. Contact our Client Services team for more information.
Discover a World of Data
Our coverage of the markets is always expanding. Here’s a sampling of what you’ll find on SPICE.
- S&P 500 index-level data from 1928, constituents from 1964, and adds and drops from 1989.
- The S&P Global BMI family, which includes thousands of indices across developed and emerging markets, with index and constituent data dating back to 1989.
- A full suite of factor indices with more than 20 years of history.
- Risk-control indices including their excess returns and historical exposure levels.
- Multi-asset class indices with component breakdown.
- Commodity indices, including the S&P GSCI and Dow Jones Commodity Index.
SPICE Key Features
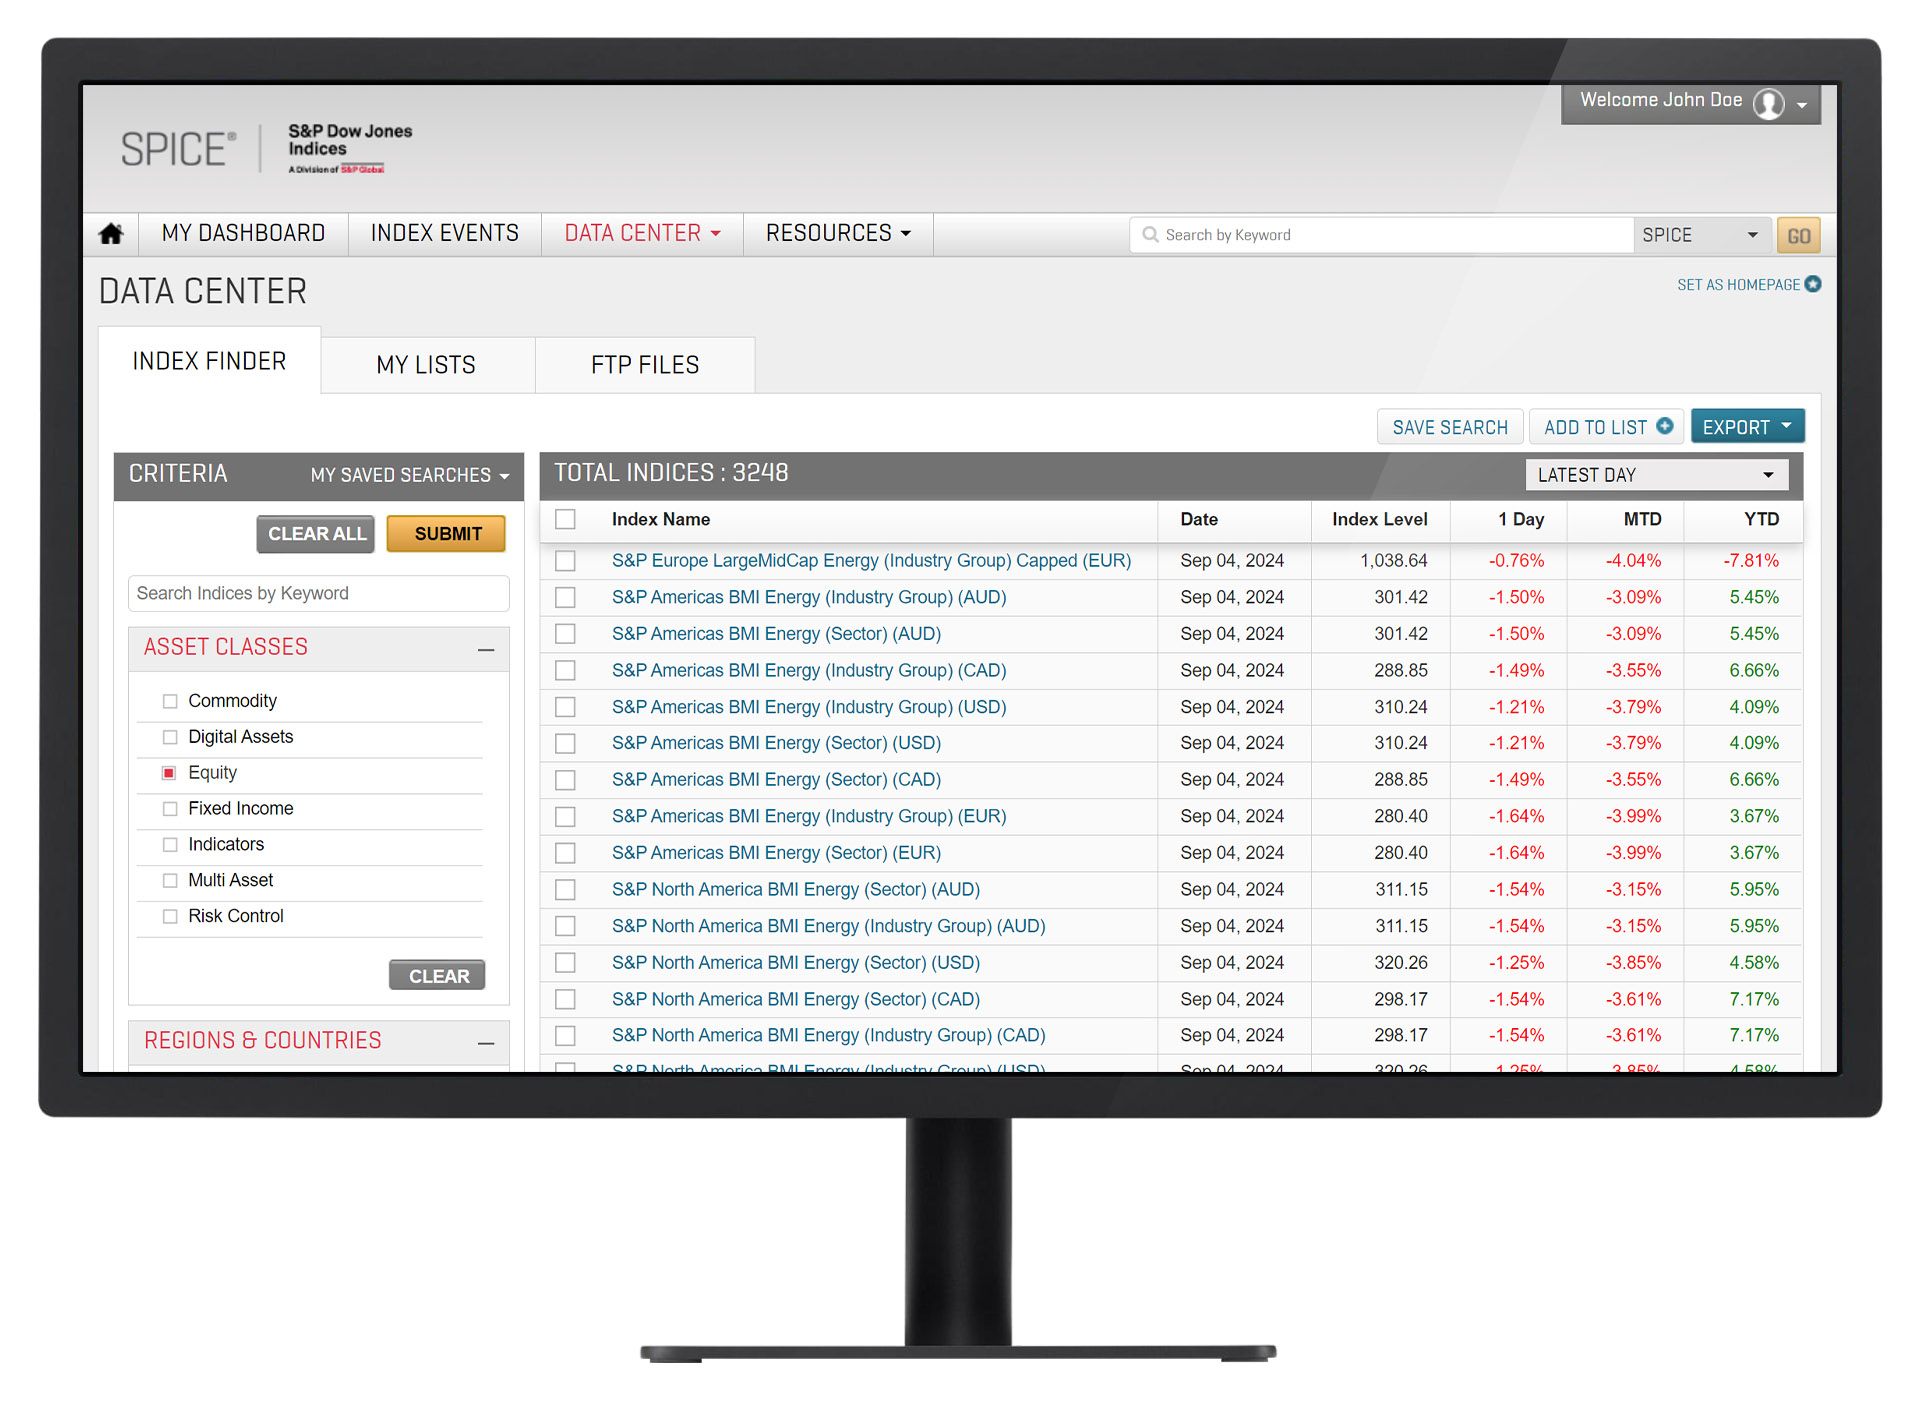
Index Finder lets you pinpoint indices that match your specifications.
- Search our database using detailed criteria for attributes such as asset class, country, region, sector, and size.
- Explore indices within theme-based categories such as ESG, dividends, and factors.
- Refine your results based on keyword.
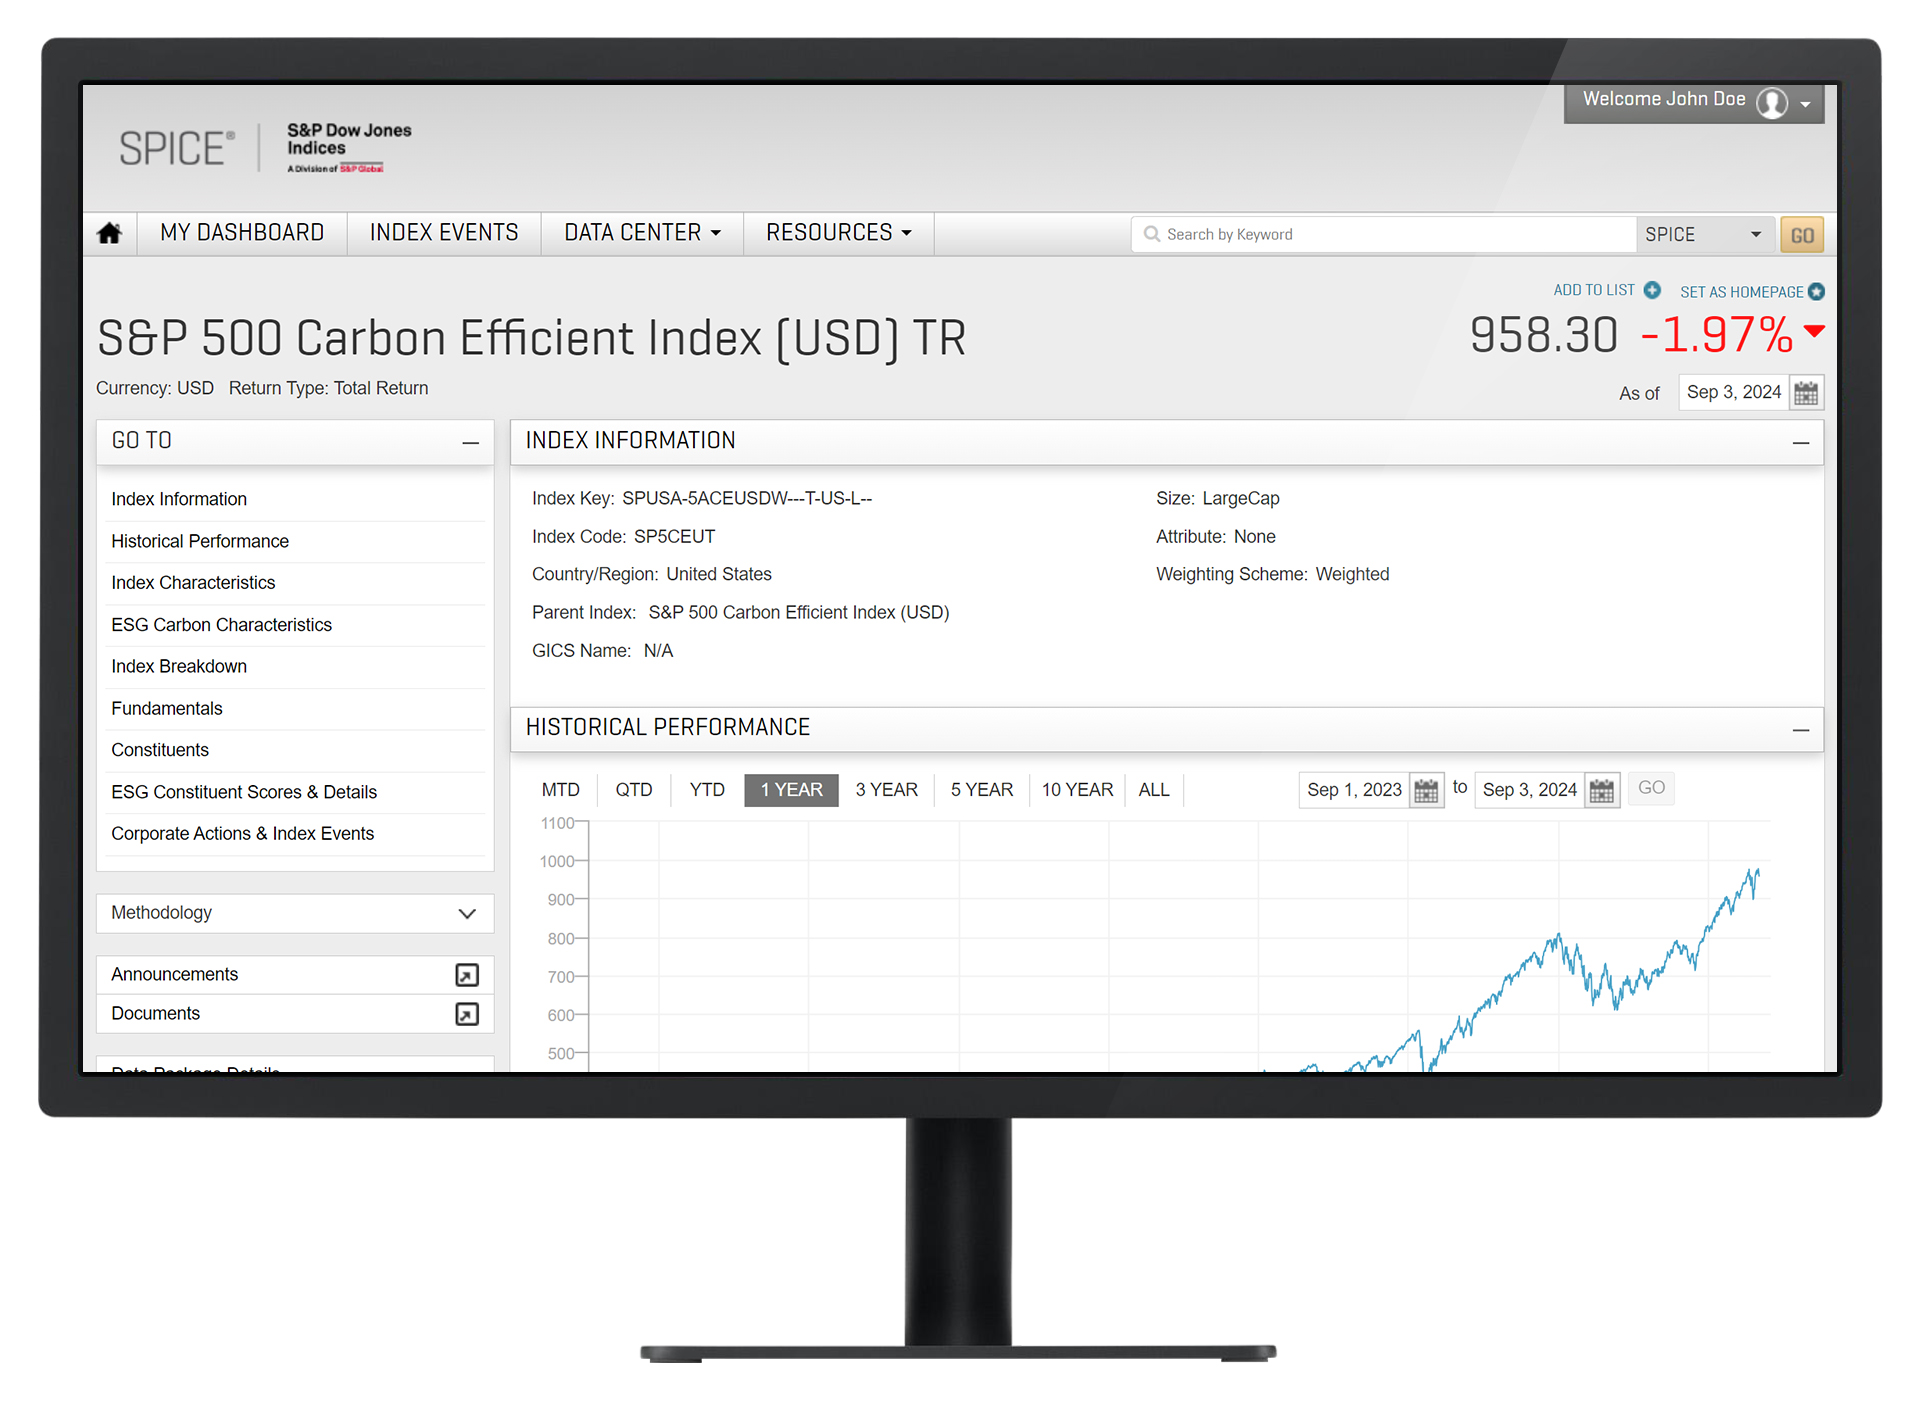
Index Pages serve up detailed data for ad-hoc analysis or to include in presentations.
- View historical performance graphs, constituent weights, scores, and upcoming corporate actions.
- Get at-a-glance information about index concentration with country and sector allocation charts.
- Compare the performance of up to five indices across asset classes.
- Access excess return, tracking error, top drawdowns, and more, benchmarked to an index of the user's choice.
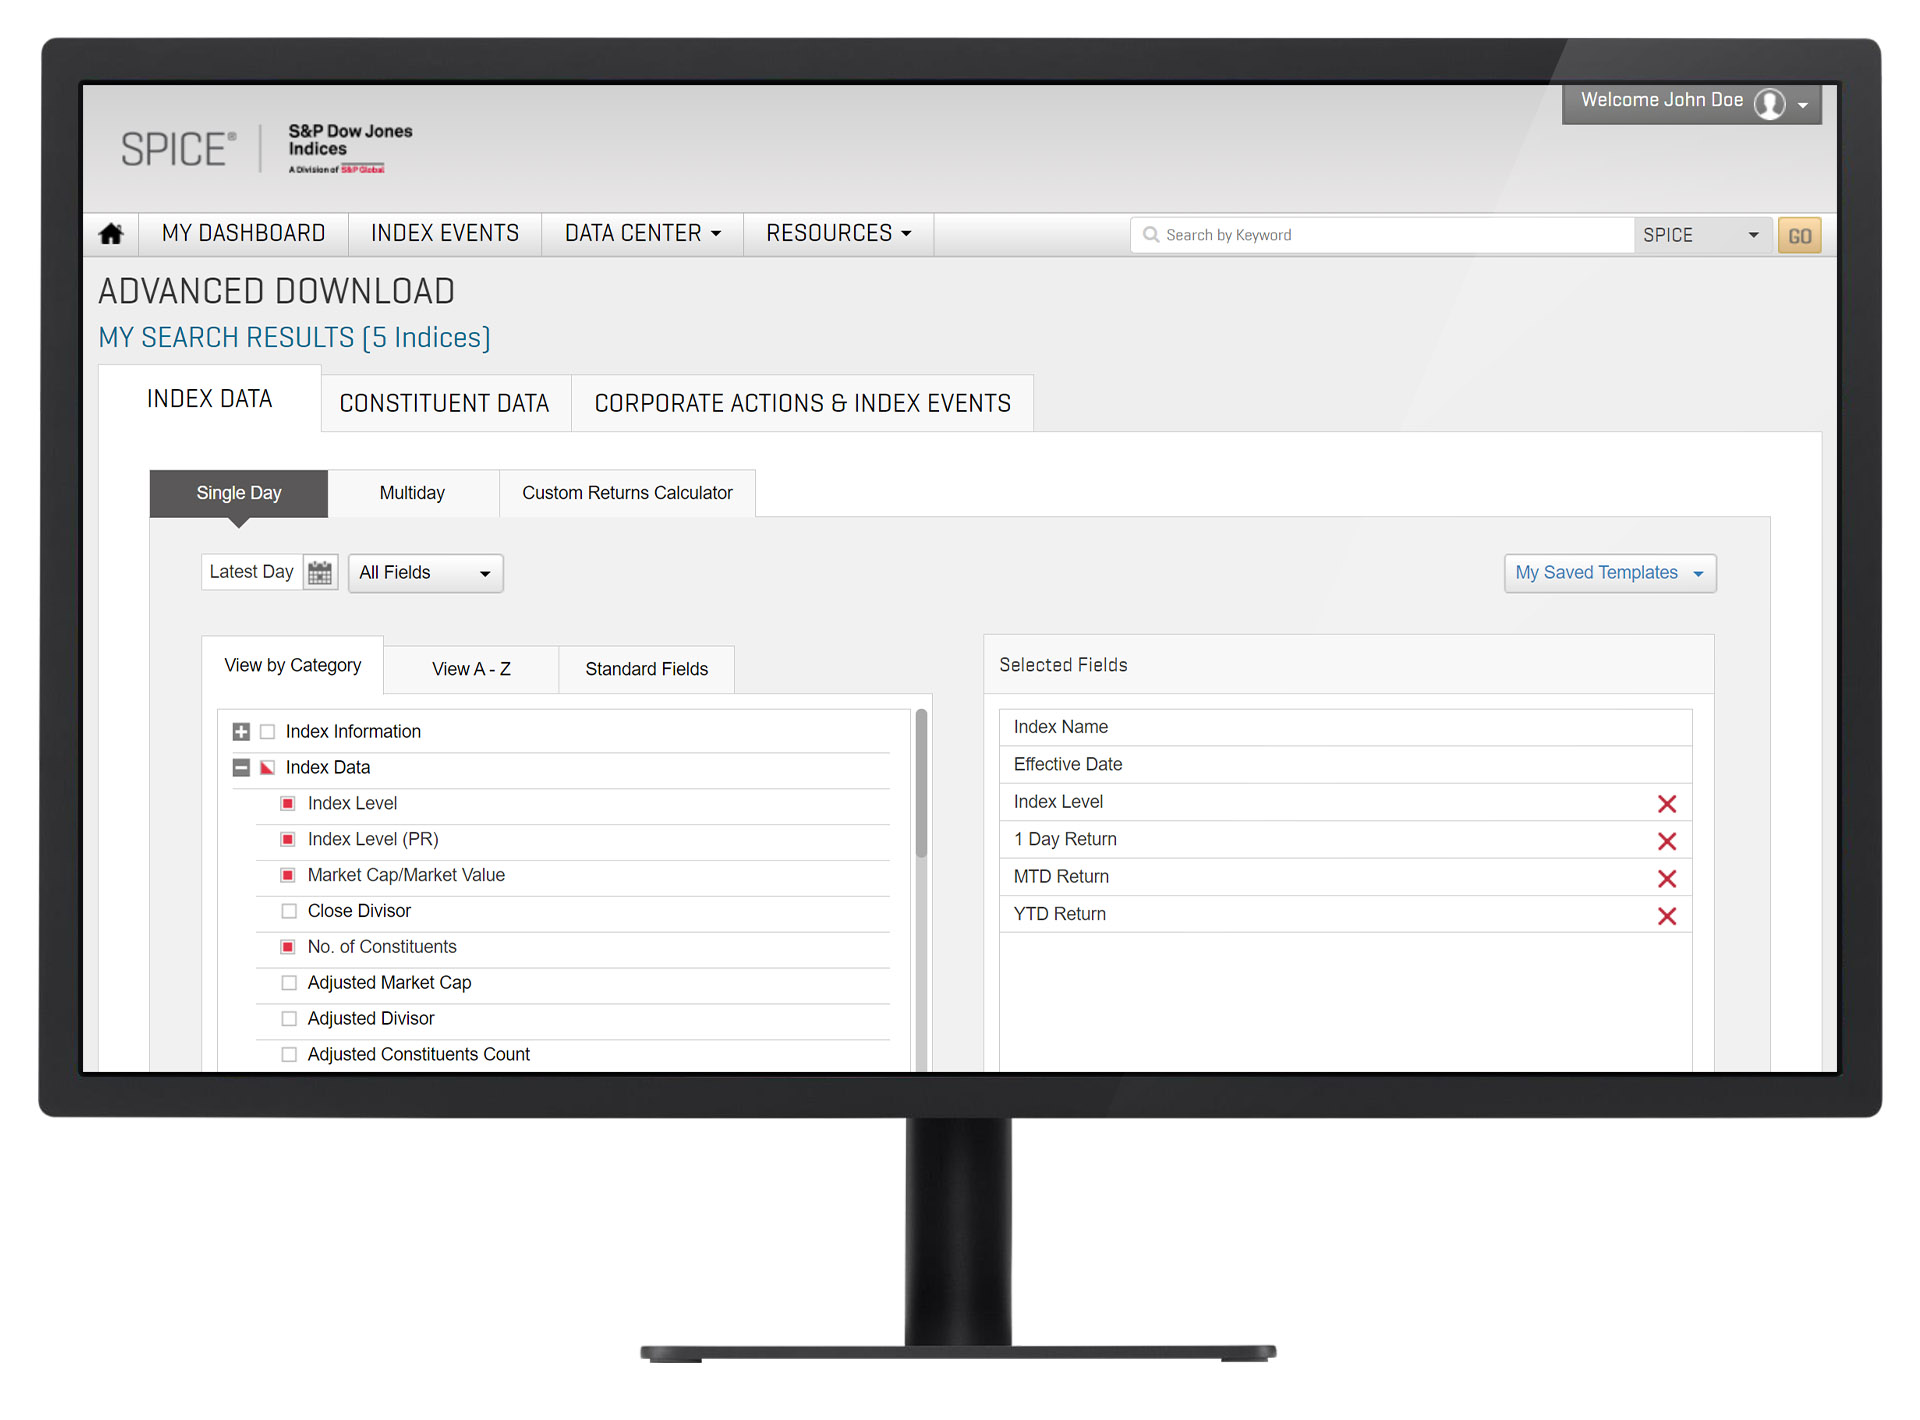
Advanced Download lets you export customized reports on one or more indices.
- Download index-level, constituent-level, or corporate action data.
- Easily add and remove fields, or adjust your data frequency and time period.
- Save your report templates and index lists for convenient future access.
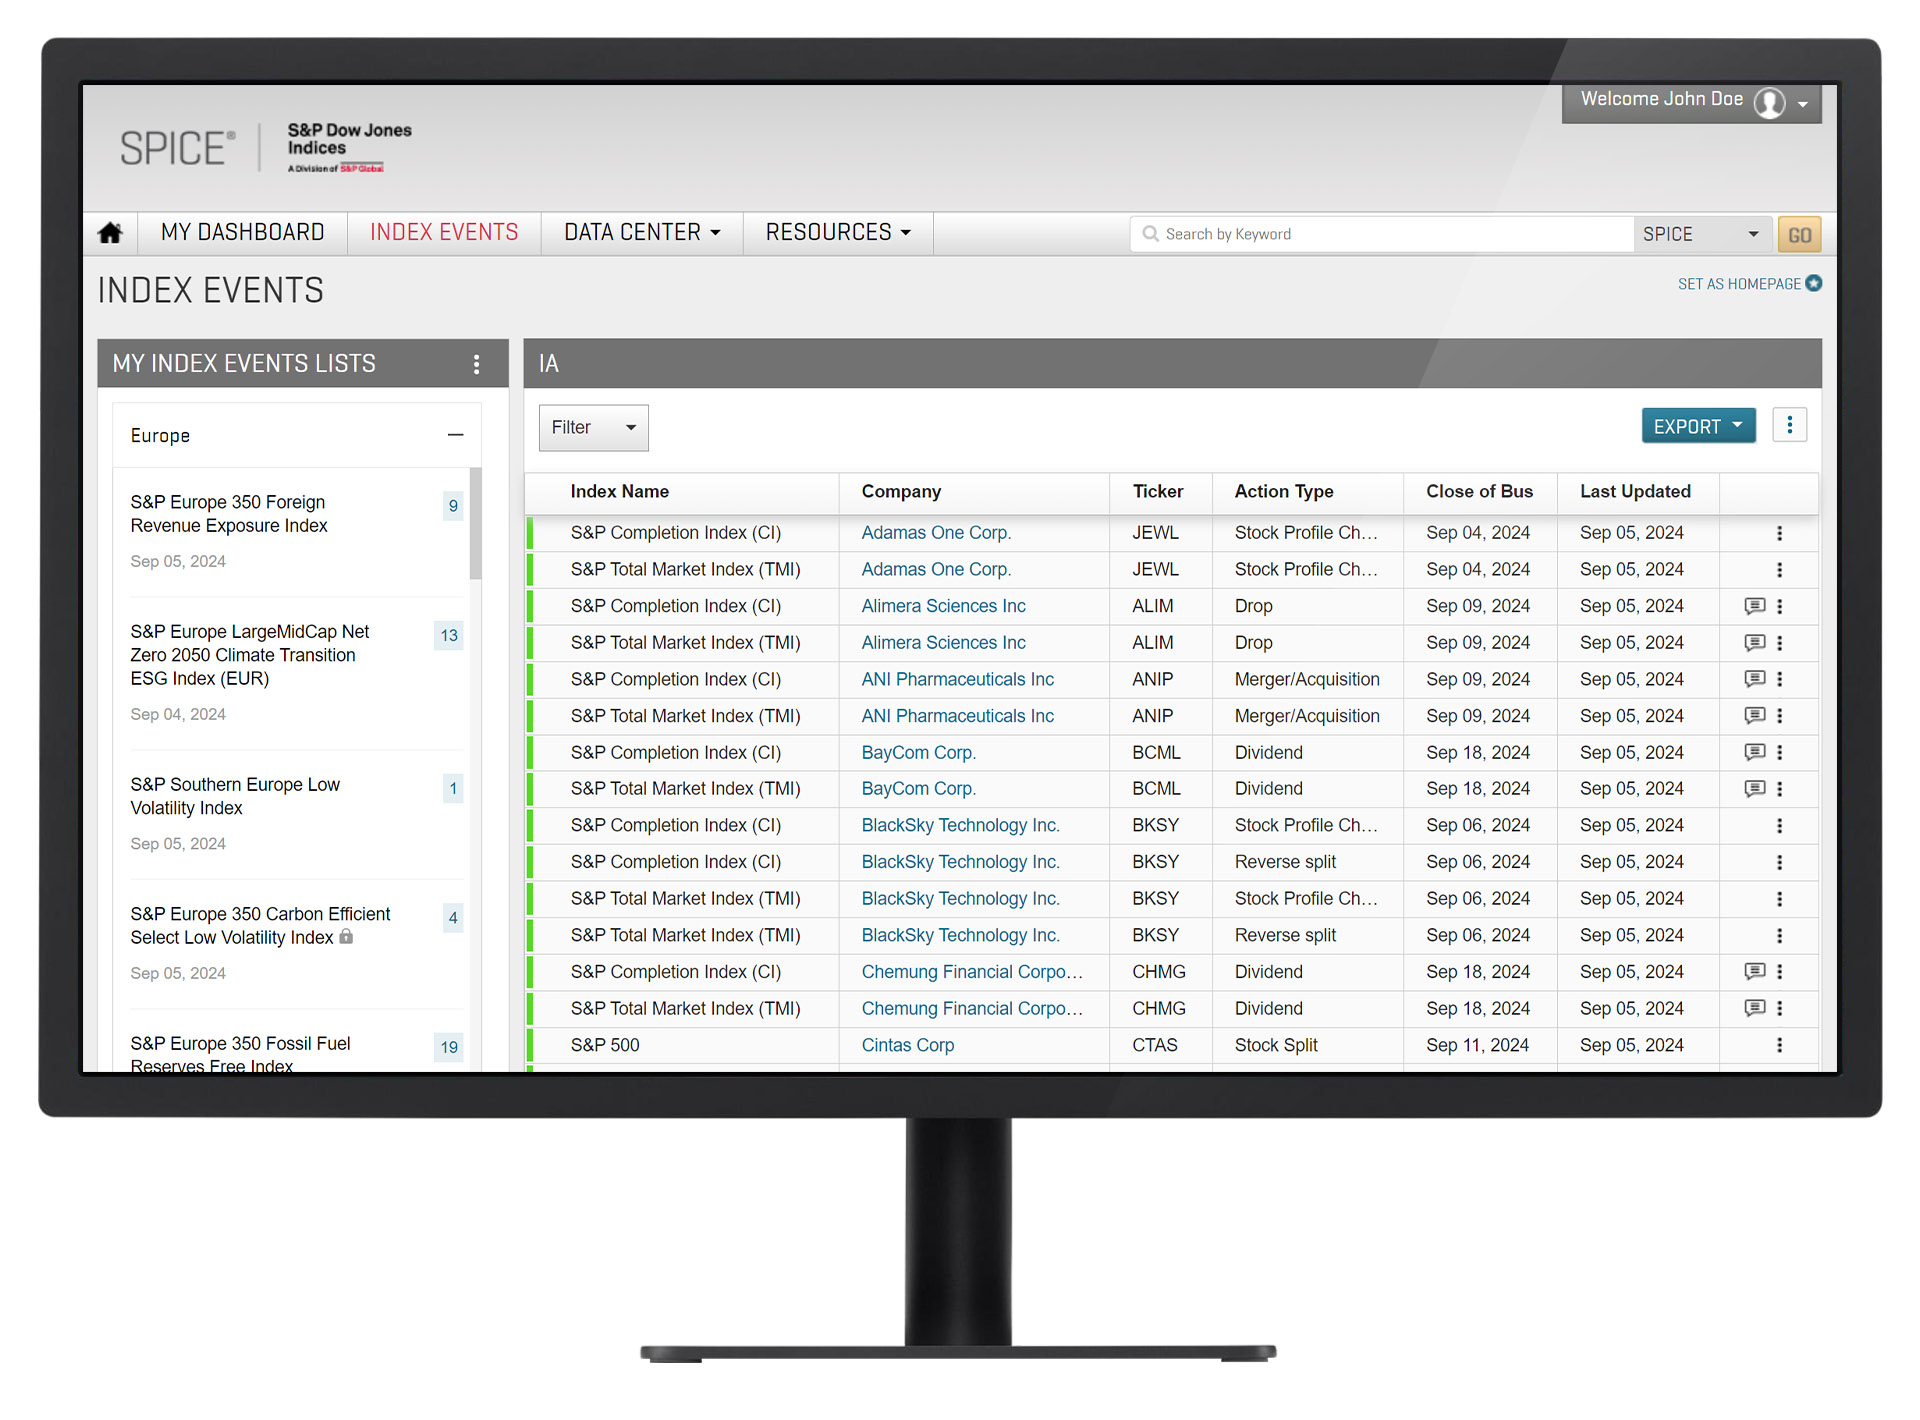
Index Events offers enhanced access to adds, drops, M&As, and more.
- Experience advanced index event management and monitoring up to 30 days forward.
- Create lists from over 1,700 headline indices for a tailored view.
- Quick access to multiple download options, including as-is downloads, advanced downloads, proforma files, EOD files and RSS feeds.
- Detailed summaries allow to effortlessly view events, download PDF summaries, or send enquiries.
- Create and save customized filters by event status, adds & drops, actionable events and more.
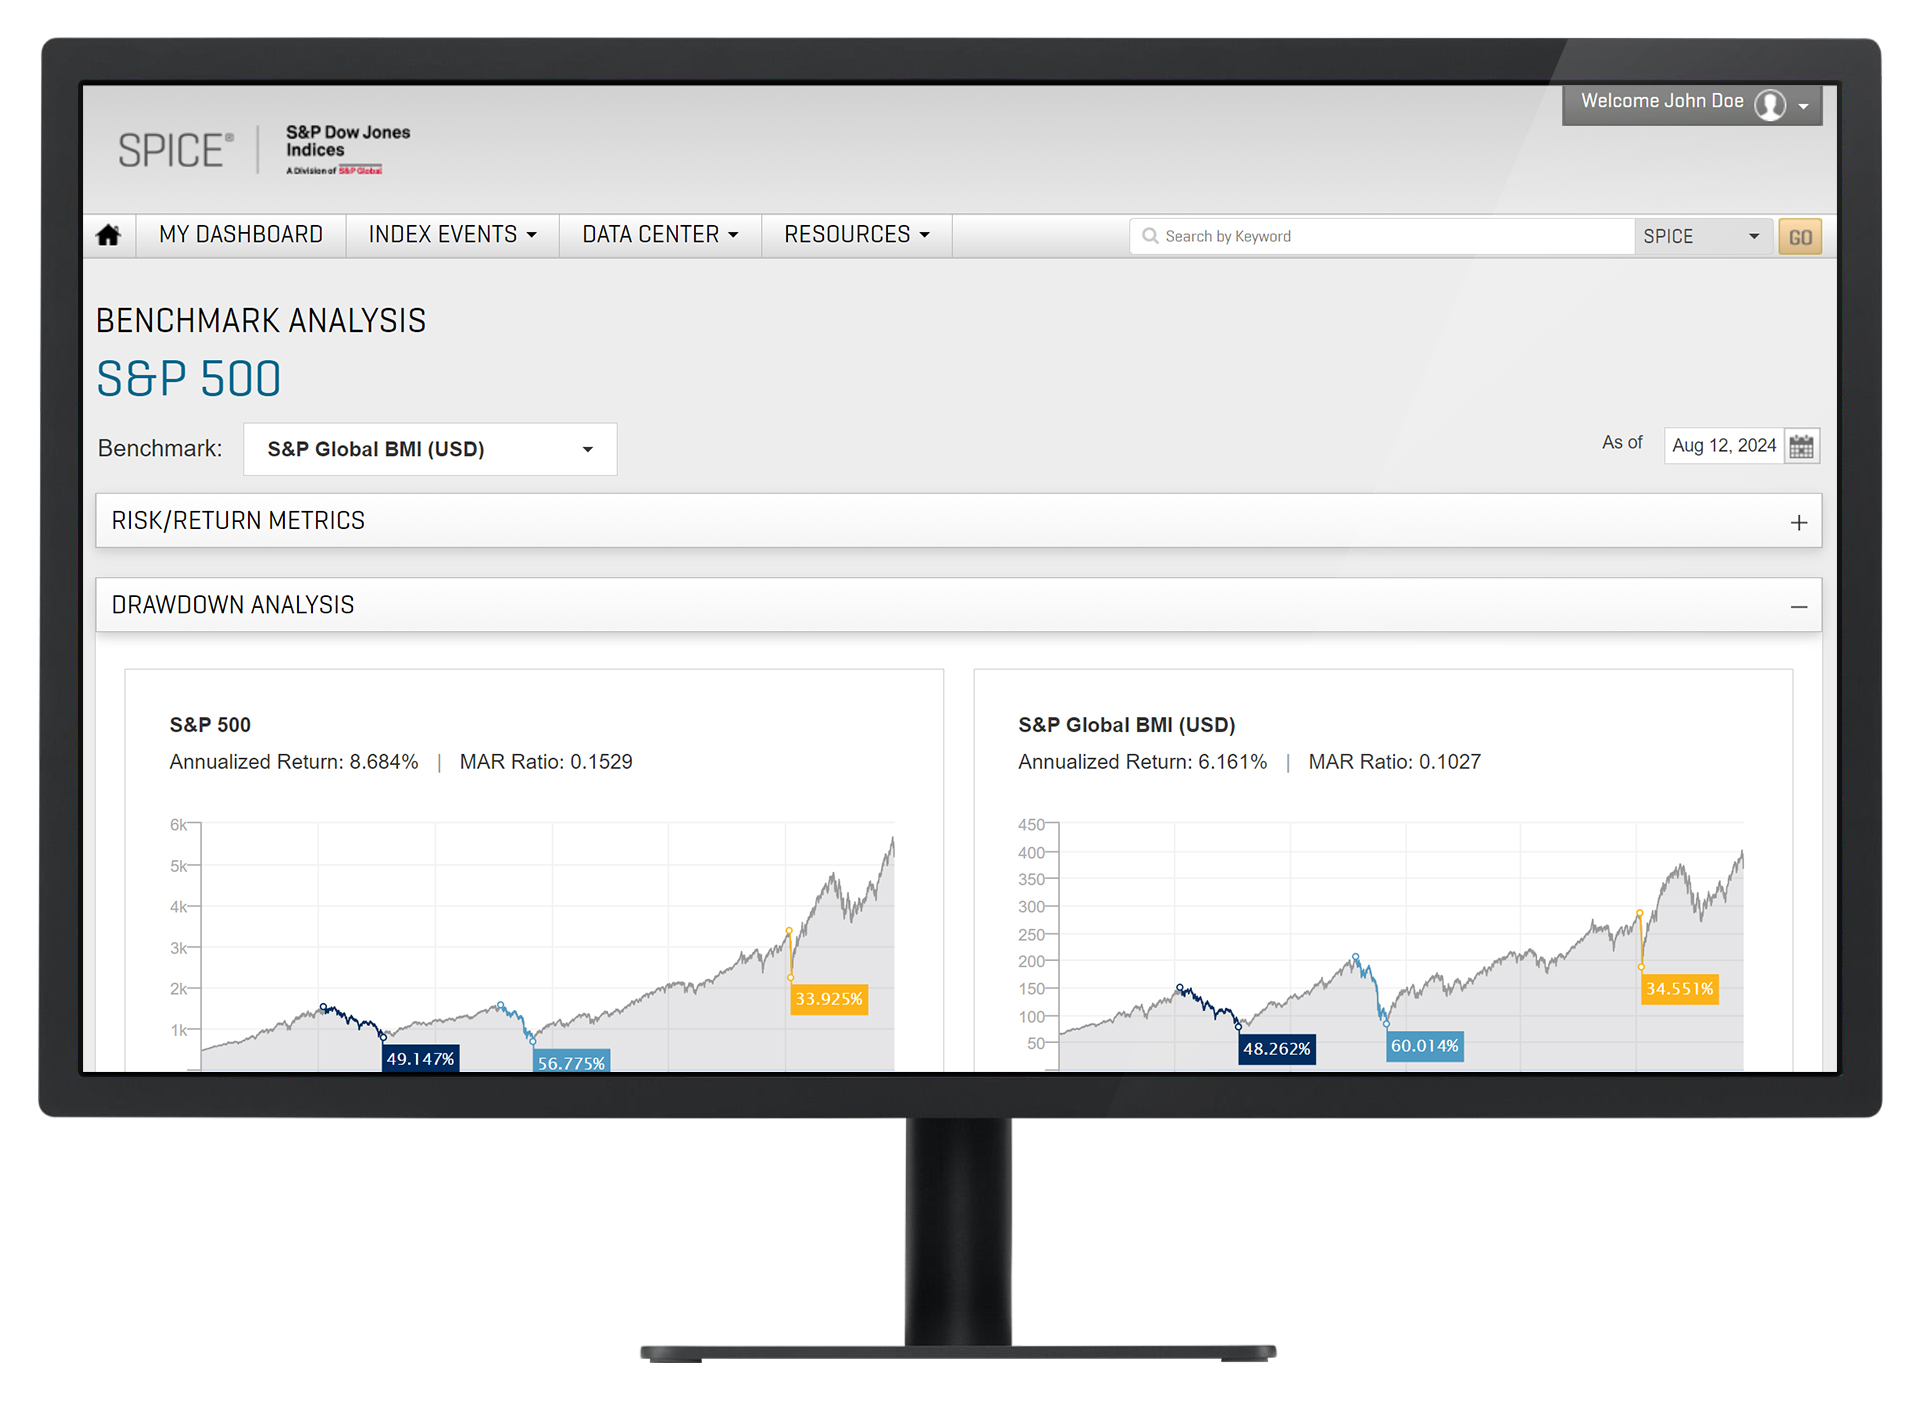
Benchmark Analysis provides seamless in-depth index comparisons.
- Evaluate indices side-by-side on key metrics, including annualized risk, risk-adjusted return, annualized excess return, and annualized tracking error.
- Conduct detailed, side-by-side comparisons of the maximum drawdowns experienced by indices, providing crucial insights into performance under stress.
- Compare historical annualized returns between indices with a clear, year-by-year view, helping you make informed decisions.
- Export comparison data for further analysis or reporting, tailored to your needs.
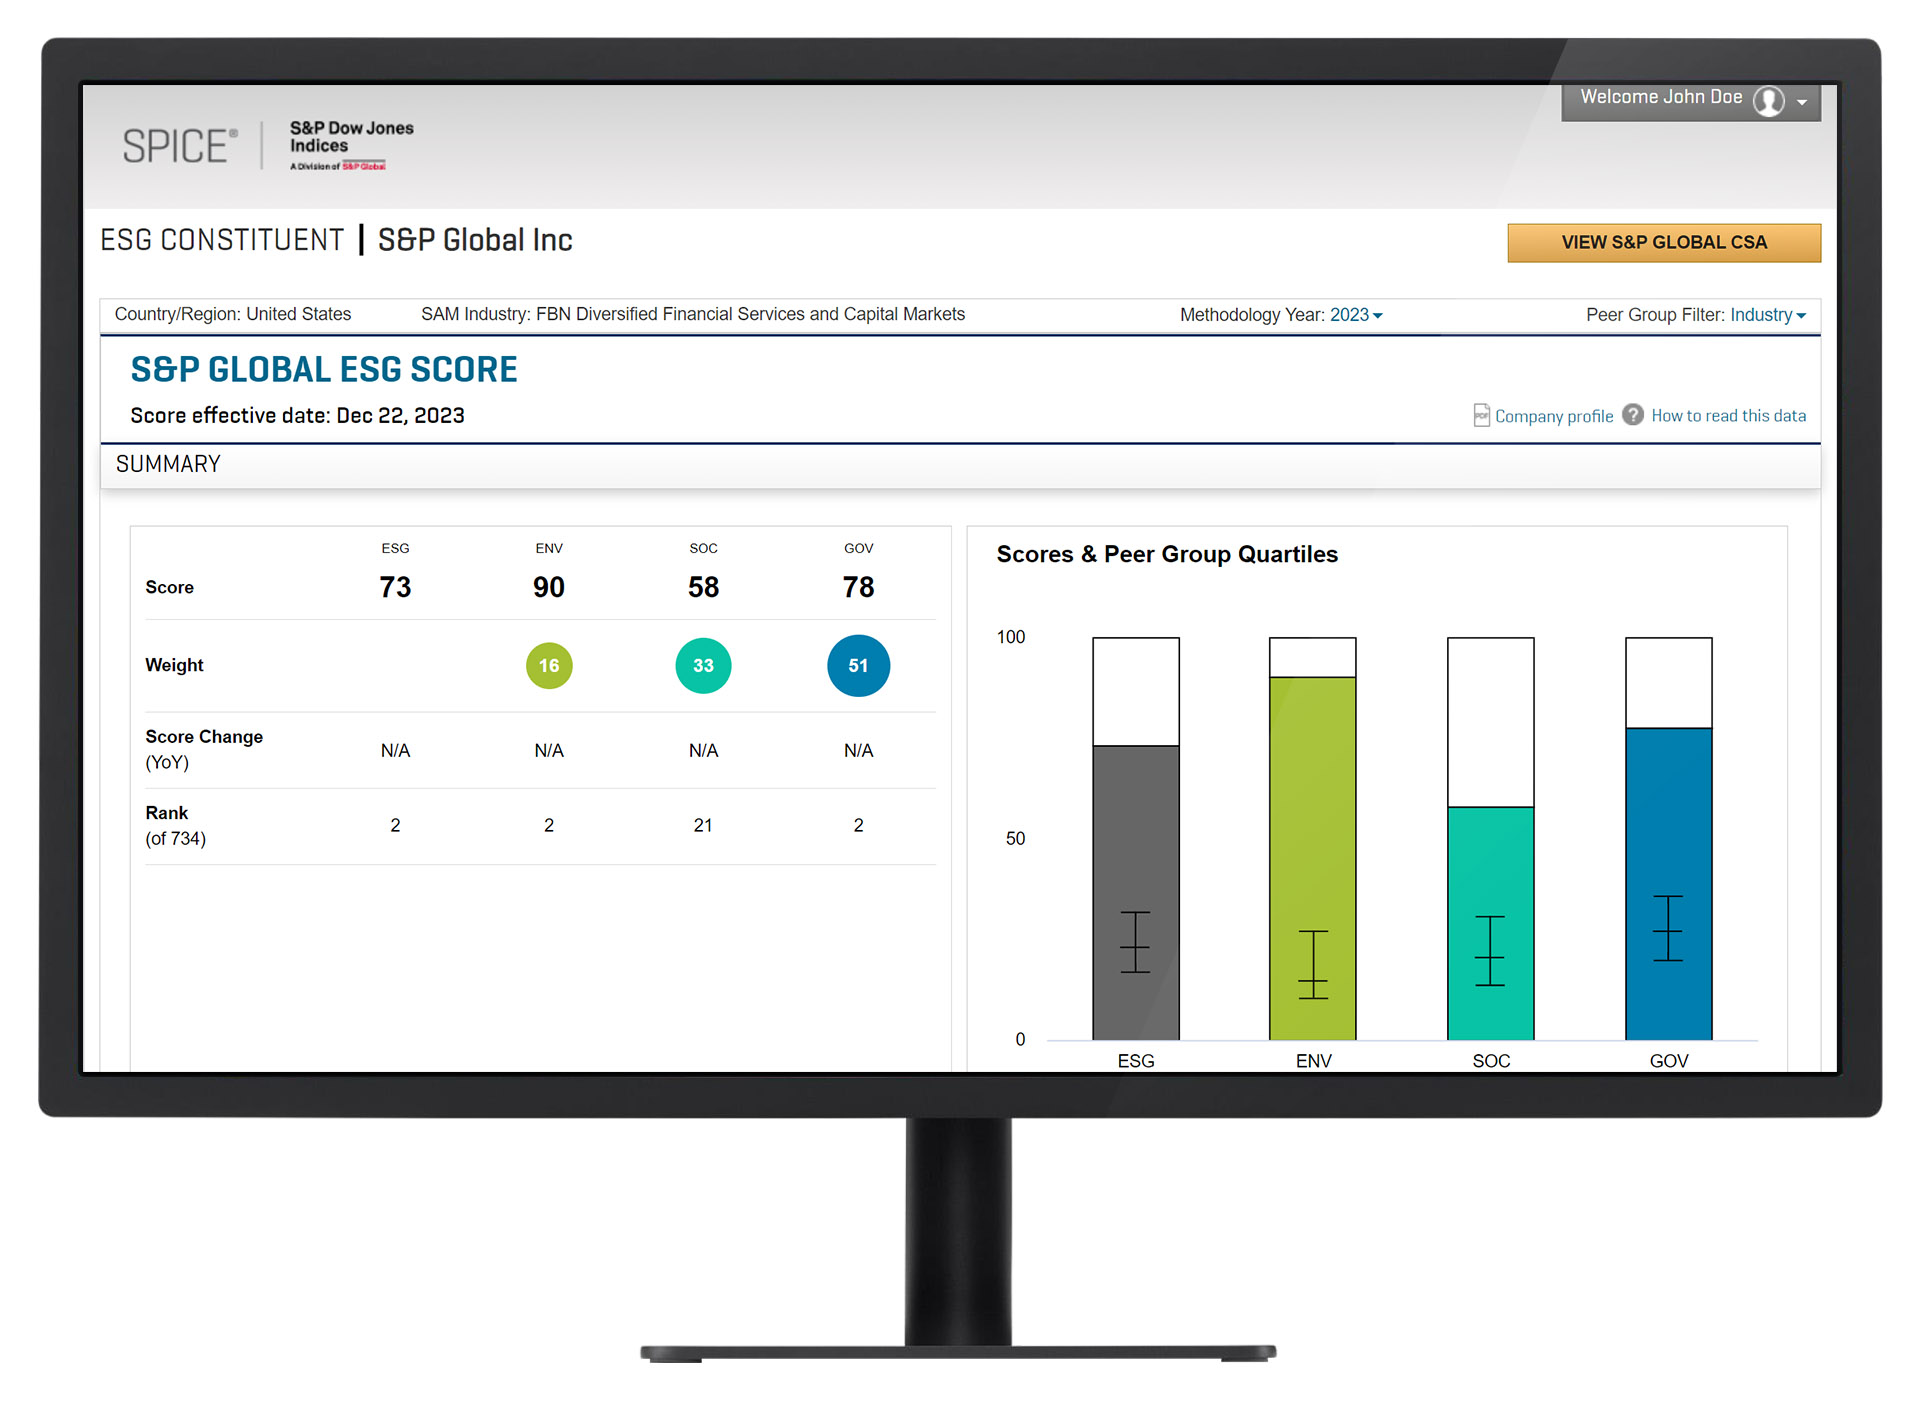
SPICE delivers rich ESG data on indices and companies alike.
- A comprehensive suite of broad based core ESG, clean energy, fossil-fuel-free, and sustainability indices.
- Index-level carbon characteristics, including carbon-to-value-invested, carbon-to-revenue, and more.
- Company-level ESG scores along with ESG dimension-level and criterial-level scores, with the ability to compare multiple companies.
- Industry peer comparisons are available globally, or within an index or country.


