NEW YORK, JANUARY 30, 2024: S&P Dow Jones Indices (S&P DJI) today released the latest results for the S&P CoreLogic Case-Shiller Indices, the leading measure of U.S. home prices. Data released today for November 2023 show that 12 out of the 20 major metro markets reported month-over-month price decreases. More than 27 years of history are available for the data series and can be accessed in full by going to www.spglobal.com/spdji/en/index-family/indicators/sp-corelogic-case-shiller.
YEAR-OVER-YEAR
The S&P CoreLogic Case-Shiller U.S. National Home Price NSA Index, covering all nine U.S. census divisions, reported a 5.1% annual gain in November, up from a 4.7% rise in the previous month. The 10-City Composite showed an increase of 6.2%, up from a 5.7% increase in the previous month. The 20-City Composite posted a year-over-year increase of 5.4%, up from a 4.9% increase in the previous month. Once again, Detroit reported the highest year-over-year gain among the 20 cities with an 8.2% increase in November, followed again by San Diego with an 8% increase. For the third month in a row, Portland fell 0.7% and remained the only city reporting lower prices in November versus a year ago.
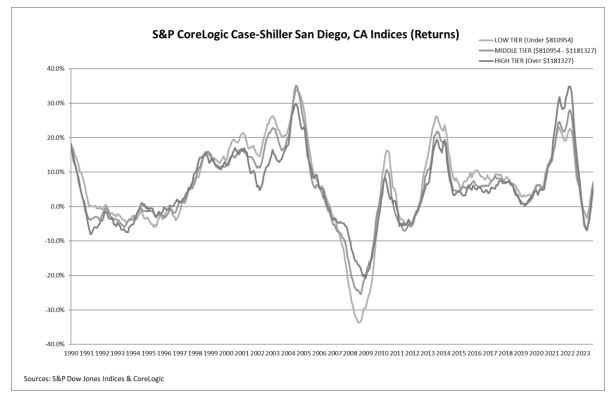
The chart on the following page compares year-over-year returns of different housing price ranges (tiers) for San Diego.

MONTH-OVER-MONTH
For the first time since January 2023, the U.S. National Index and 20-City Composite posted 0.2% month-over-month decreases in November, while the 10-City Composite posted a 0.1% decrease.
After seasonal adjustment, the U.S. National Index and the 10-City Composite posted month-over-month increases of 0.2%, while the 20-City Composite posted a month-over-month increase of 0.1%.
ANALYSIS
“U.S. home prices edged downward from their all-time high in November,” says Brian D. Luke, Head of Commodities, Real & Digital Assets at S&P DJI. “The streak of nine monthly gains ended in November, setting the index back to levels last seen over the summer months. Seattle and San Francisco reported the largest monthly declines, falling 1.4% and 1.3%, respectively.”
“November’s year-over-year gain saw the largest growth in U.S. home prices in 2023, with our National Composite rising 5.1% and the 10-city index rising 6.2%. Detroit held its position as the best performing market for the third month in a row, accelerating to an 8.2% gain. San Diego notched an 8% annual gain, retaining its second spot in the nation. Barring a late surge from another market, those cities will vie for the ‘housing market of the year’ as the best performing city in our composite.”
“Six cities registered a new all-time high in November (Miami, Tampa, Atlanta, Charlotte, New York, and Cleveland). Portland remains the lone market in annual decline. The Northeast and Midwest recorded the largest gains with returns of 6.4% and 6.3%, respectively. Other regions are not far behind with the slowest gains in the West of 3%. This month’s report revealed the narrowest spread of performance across the nation since the first quarter of 2021.”
“The tight disparity speaks to a rising tide across the country, with less evidence of micro-markets bucking the trend. The days of markets in the South rising double digits with markets in the Midwest remaining flat are over. The house price decline came at a time where mortgage rates peaked, with the average Freddie Mac 30-year fixed rate mortgage nearing 8%, according to Federal Reserve data. The rate has since fallen over 1%, which could support further annual gains in home prices.”
SUPPORTING DATA
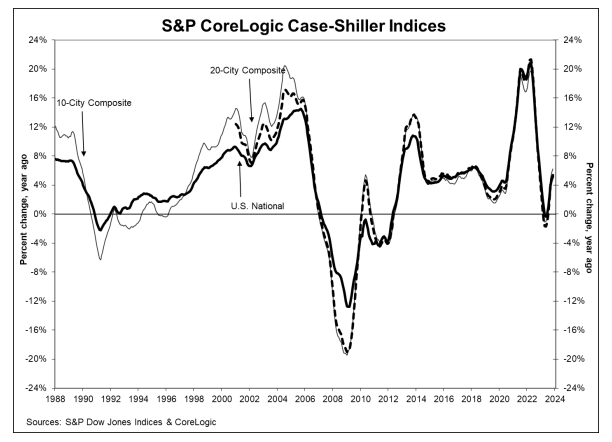
The chart below depicts the annual returns of the U.S. National, 10-City Composite, and 20-City Composite Home Price Indices. The S&P CoreLogic Case-Shiller U.S. National Home Price NSA Index, which covers all nine U.S. census divisions, recorded a 5.1% annual increase in November 2023. The 10-City and 20-City Composites reported year-over-year increases of 6.2% and 5.4%, respectively.


