


NEW YORK, JULY 25, 2023: S&P Dow Jones Indices (S&P DJI) today released the latest results for the S&P CoreLogic Case-Shiller Indices, the leading measure of U.S. home prices. Data released today for May 2023 show all 20 major metro markets reported month-over-month price increases for the third straight month. More than 27 years of history are available for the data series and can be accessed in full by going to www.spglobal.com/spdji/en/index-family/indicators/sp-corelogic-case-shiller.
YEAR-OVER-YEAR
The S&P CoreLogic Case-Shiller U.S. National Home Price NSA Index, covering all nine U.S. census divisions, reported a -0.5% annual decrease in May, down from a loss of -0.1% in the previous month.
The 10-City Composite showed a decrease of -1.0%, which is a tick up from the -1.1% decrease in the previous month. The 20-City Composite posted a -1.7% year-over-year loss, same as in the previous month.
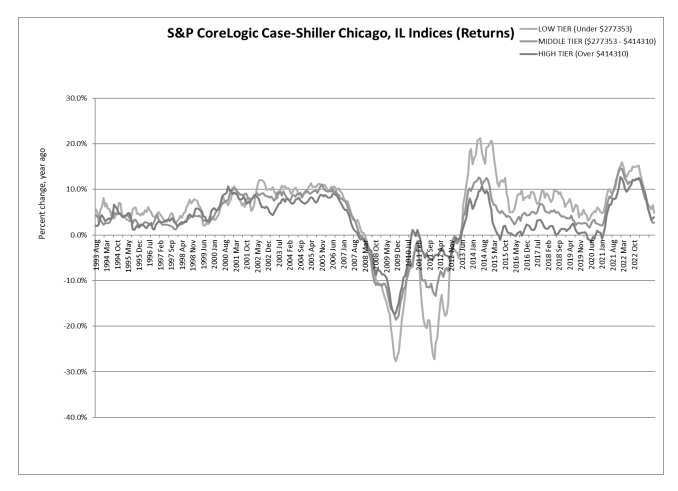
Chicago, Cleveland, and New York reported the highest year-over-year gains among the 20 cities in May. Chicago moved up one to the top spot with a 4.6% year-over-year price increase, while Cleveland came in at number two with a 3.9% increase, and New York entered the top three in third with a 3.5% increase. There was an even split of 10 cities reporting lower prices and those reporting higher prices in the year ending May 2023 versus the year ending April 2023. The chart on the following page compares year-over-year returns of different housing price ranges (tiers) for Chicago.
MONTH-OVER-MONTH
Before seasonal adjustment, the U.S. National Index posted a 1.2% month-over-month increase in May, while the 10-City and 20-City Composites both posted increases of 1.5%. After seasonal adjustment, the U.S. National Index posted a month-over-month increase of 0.7%, while the 10 City Composite gained 1.1% and 20-City Composites posted an increase of 1.0%.
ANALYSIS
“The rally in U.S. home prices continued in May 2023,” says Craig J. Lazzara, Managing Director at S&P DJI. “Our National Composite rose by 1.2% in May, and now stands only 1.0% below its June 2022 peak. The 10- and 20-City Composites also rose in May, in both cases by 1.5%.
“The ongoing recovery in home prices is broadly based. Before seasonal adjustment, prices rose in all 20 cities in May (as they had also done in March and April). Seasonally adjusted data showed rising prices in 19 cities in May, repeating April’s performance. (The outlier is Phoenix, down 0.1% in both months.) On a trailing 12-month basis, the National Composite is 0.5% below its May 2022 level, with the 10- and 20-City Composites also negative on a year-over-year basis.
“Regional differences continue to be striking. This month’s league table shows the Revenge of the Rust Belt, as Chicago (+4.6%), Cleveland (+3.9%), and New York (+3.5%) were the top performers. If this seems like an unusual occurrence to you, it seems that way to me too. It’s been five years to the month since a cold-weather city held the top spot (and that was Seattle, which isn’t all that cold). Since May 2018, the top-ranked cities have been Las Vegas (12 months), Phoenix (33 months), Tampa (5 months), and Miami (9 months).
“At the other end of the scale, the worst performers continue to cluster near the Pacific coast, with Seattle (-11.3%) and San Francisco (-11.0%) at the bottom. This month the Midwest (+2.7%) unseated the Southeast (+2.1%) as the country’s strongest region. The West (-6.9%) remains weakest.
“Home prices in the U.S. began to fall after June 2022, and May’s data bolster the case that the final month of the decline was January 2023. Granted, the last four months’ price gains could be truncated by increases in mortgage rates or by general economic weakness. But the breadth and strength of May’s report are consistent with an optimistic view of future months.”
SUPPORTING DATA
The chart below depicts the annual returns of the U.S. National, 10-City Composite, and 20-City Composite Home Price Indices. The S&P CoreLogic Case-Shiller U.S. National Home Price NSA Index, which covers all nine U.S. census divisions, recorded a -0.5% annual drop in May 2023. The 10-City and 20-City Composites reported year-over-year decreases of -1.0% and -1.7%, respectively.
