NEW YORK, MAY 28, 2024: S&P Dow Jones Indices (S&P DJI) today released the March 2024 results for the S&P CoreLogic Case-Shiller Indices. The leading measure of U.S. home prices shows that all of the major metro markets reported month-over-month price increases. More than 27 years of history are available for the data series and can be accessed in full by going to www.spglobal.com/spdji/en/index-family/indicators/sp-corelogic-case-shiller.
YEAR-OVER-YEAR
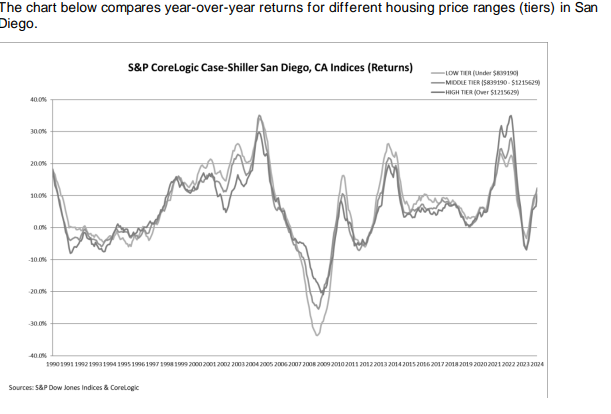
The S&P CoreLogic Case-Shiller U.S. National Home Price NSA Index, covering all nine U.S. census divisions, reported a 6.5% annual gain for March, the same increase as the previous month. The 10-City Composite saw an increase of 8.2%, up from a 8.1% increase in the previous month. The 20-City Composite posted a slight year-over-year increase to 7.4%, up from a 7.3% increase in the previous month. San Diego continued to report the highest year-over-year gain among the 20 cities this month with an 11.1% increase in March, followed by New York and Cleveland, with increases of 9.2% and 8.8%, respectively. Denver, which still holds the lowest rank after reporting three consecutive months of the smallest year-over-year growth, posted the same 2.1% annual increase in March as the previous month.

MONTH-OVER-MONTH
The U.S. National Index, the 20-City Composite, and the 10-City Composite all continued their upward trend from last month, showing pre-seasonality adjustment increases of 1.3%, 1.6% and 1.6%, respectively.
After seasonal adjustment, the U.S. National Index posted a month-over-month increase of 0.3%, while the 20-City and the 10-City Composite both reported month-over-month increases of 0.3% and 0.5%, respectively.
ANALYSIS
“This month’s report boasts another all-time high,” says Brian D. Luke, Head of Commodities, Real & Digital Assets at S&P Dow Jones Indices. “We’ve witnessed records repeatedly break in both stock and housing markets over the past year. Our National Index has reached new highs in six of the last 12 months. During that time, we’ve seen record stock market performance, with the S&P 500 hitting fresh all-time highs for 35 trading days in the past year.
“San Diego stands out with an impressive 11.1% annual gain, followed closely by New York, Cleveland, and Los Angeles, indicating a strong demand for urban markets. The two largest population centers make up about 30% of the 20-City Composite and have shown significant recovery, keeping pace with our national composite annualized return of 9.9% since 2020. San Francisco and Seattle are still trailing previous highs, currently 9.7% and 8.2% lower than in May 2022, respectively. While Southern California ranked among the best annually, Seattle and San Francisco recorded the strongest monthly gains,” according to Luke.
“Regionally, the Northeast remains the top performer with an 8.3% annual gain, showcasing robust growth compared to other metro markets. Conversely, cities like Tampa, Phoenix, and Dallas, which saw top-tier performance in 2020 and 2021, are now growing at a slower pace. COVID was a boom for Sunbelt markets, but the bigger gains the last couple of years have been the northern metro cities,” Luke reported. “On a seasonal adjusted basis, national home prices have reached their ninth all-time high within the past year, with all 20 metropolitan markets posting positive annual gains for the fourth consecutive month, indicating widespread and sustained growth in the housing sector.”


