NEW YORK, MARCH 26, 2024: S&P Dow Jones Indices (S&P DJI) today released the January 2024 results for the S&P CoreLogic Case-Shiller Indices. The leading measure of U.S. home prices shows that three out of the 20 major metro markets reported month-over-month price increases. More than 27 years of history are available for the data series and can be accessed in full by going to www.spglobal.com/spdji/en/index-family/indicators/sp-corelogic-case-shiller.
YEAR-OVER-YEAR
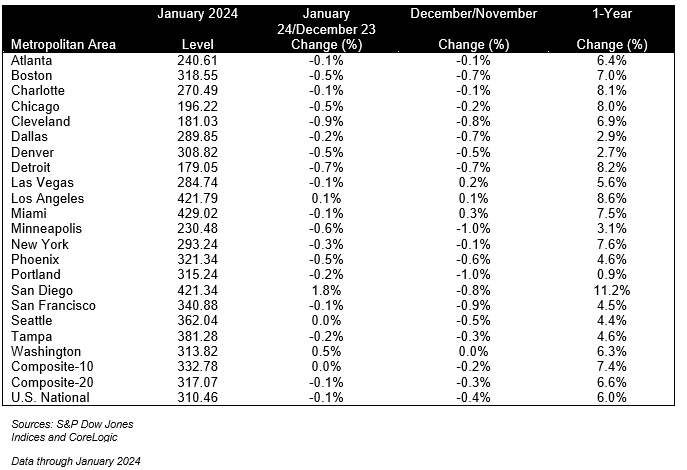
The S&P CoreLogic Case-Shiller U.S. National Home Price NSA Index, covering all nine U.S. census divisions, reported a 6.0% annual gain in January, up from a 5.6% rise in the previous month. The 10-City Composite showed an increase of 7.4%, up from a 7.0% increase in the previous month. The 20-City Composite posted a year-over-year increase of 6.6%, up from a 6.2% increase in the previous month. San Diego again reported the highest year-over-year gain among the 20 cities with an 11.2% increase in January, followed by Los Angeles, with an increase of 8.6%. Portland, though holding the lowest rank after reporting the smallest year-over-year growth, retained an upward trend with a 0.9% increase this month.
MONTH-OVER-MONTH
The U.S. National Index and the 20-City Composite showed a continued decrease of 0.1%, and 10-City Composite remained unchanged in January.
After seasonal adjustment, the U.S. National Index, the 20-City Composite, and the 10-City Composite all posted month-over-month increases of 0.4%, 0.1%, and 0.2% respectively.
ANALYSIS
“U.S. home prices continued their drive higher,” says Brian D. Luke, Head of Commodities, Real & Digital Assets at S&P Dow Jones Indices. “Our National Composite rose by 6% in January, the fastest annual rate since 2022. Stronger gains came from our 10- and 20-City Composite indices, rising 7.4% and 6.6%, respectively. For the second consecutive month, all cities reported increases in annual prices, with San Diego surging 11.2%. On a seasonal adjusted basis, home prices have continued to break through previous all-time highs set last year.”
“We've commented on how consistent each market performed during 2023 and that continues to be the case. While there is a large disparity between leaders such as San Diego versus laggards such as with Portland, the broad market performance is tightly bunched up. This is also true of high and low tiers. The average annual gains between high and low tiers across cities tracked by the indices is just 1.1%. Low price tiered indices have outperformed high priced indices for 17 months. Homeowners most likely saw healthy gains in the last year, no matter what city you were in, or if it was in an expensive or inexpensive neighborhood. No matter which way you slice it, the index performance closely resembled the broad market.”
“On a monthly basis, home prices continue to struggle in the face of elevated borrowing costs. Seventeen markets dropped over the last month, while Minneapolis has posted a 2.4% decline over the prior three months. Only Southern California and Washington D.C. have stood up the rising wave of interest rates and deliver positive returns to start the year. San Diego rose 1.8% in January, followed by DC with 0.5% and Los Angeles at 0.1%.”
SUPPORTING DATA
Table 1 below shows the housing boom/bust peaks and troughs for the three composites along with the current levels and percentage changes from the peaks and troughs.

Table 2 below summarizes the results for January 2024. The S&P CoreLogic Case-Shiller Indices could be revised for the prior 24 months, based on the receipt of additional source data.


