Executive Summary
The high yield bond market is fragmented in nature and primarily trades over the counter. Each bond carries unique credit risk, coupons, maturities, optionality and levels of liquidity. Bilateral trades introduce counterparty risk, which investors consider in addition to the credit analysis of high yield bond issuers.
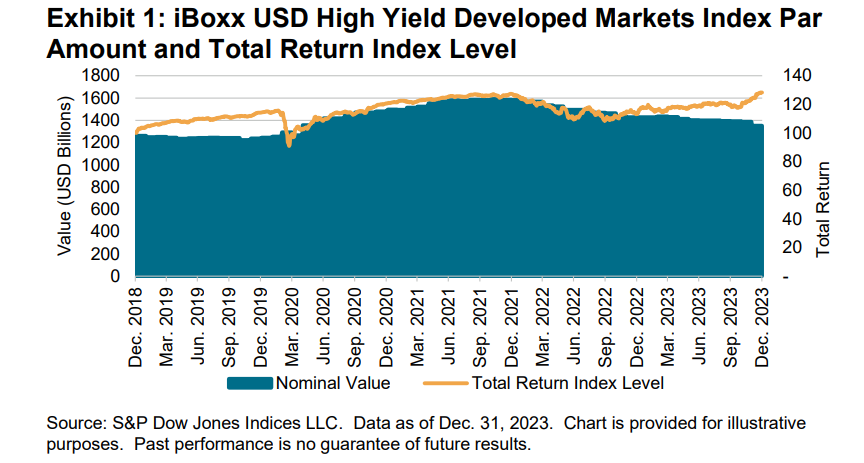
High yield indices reflect the high yield market and aid investors with price discovery. For instance, as measured by the iBoxx® USD High Yield Developed Markets Index, we can understand that the notional size of the USD high yield bond market has grown by only 6.5% over the past five years, to approximately USD 1.4 trillion, while delivering an aggregate total return of 28.2% over the same five-year period.

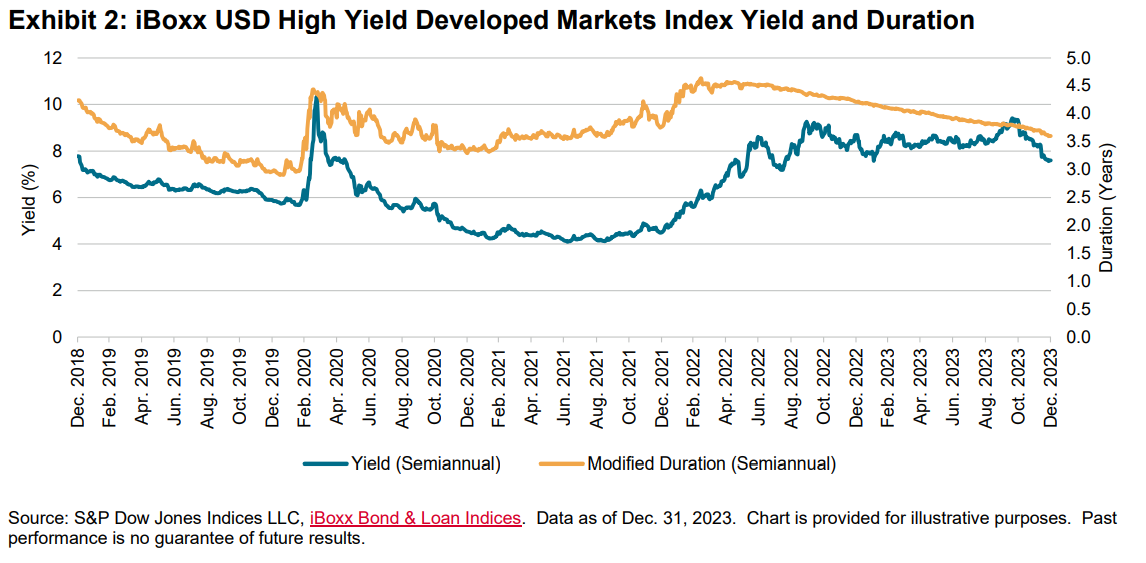
We can also understand that, with a yield of 7.6% and a duration of 3.6 years as of Dec. 31, 2023, USD high yield bond yields are approximately 100 bps higher than the prior five-year average, while index duration is 0.2 years lower than the five-year average. This detail helps summarize the overall market in single point figures, creating clarity from the noise.

High yield indices help enable understanding of these and other market characteristics because they include risk/return statistics at the index level and underlying bond level published daily, along with static data such as rating, sector and maturity breakdowns. Bond prices fuel daily index calculations, so reliable pricing that powers high yield indices is paramount. The Pricing Team of the S&P Global Market Intelligence division provides component pricing for the iBoxx USD Liquid High Yield Index and CDX High Yield, including end-of-day and intraday pricing. Pricing is determined by several factors, including executed trades, dealer quotes, banks’ books of record and model inputs like issuer curves and comparable assets. The pricing process is overseen by expert pricing analysts who cover specific markets and who review the algorithmic pricing process.
This pricing visibility informs index-tracking tradeable products, like ETFs, futures, total return swaps and swaps on credit default swap indices. Options markets linked to such instruments provide investors with new ways to trade high yield credit volatility. Each instrument becomes an additional source of market color for investors, which drives greater market efficiency, including for those who do not trade index-linked products.
So, high yield indices help standardize and describe the market. At the same time, high yield index-tracking tradeable products provide high yield investors with ways to trade and invest according to these standard definitions. Tradeable high yield index products have evolved to primarily trade within a centrally cleared framework, which mitigates counterparty risk.


