IN THIS LIST

Unlocking Yield: Harnessing Dividend Opportunities in China A-Shares

TalkingPoints: Get to Know the S&P 500 Daily Covered Call Indices

S&P/ASX Australian Fixed Interest Indices – A Look Back on the Past Decade

TalkingPoints: How Glass-Box Optimization Brings Transparency to Sustainability

Factor Strategies in Brazil: A Practitioner's Guide

Unlocking Yield: Harnessing Dividend Opportunities in China A-Shares

Contributor Image
Izzy Wang

Senior Analyst, Factors and Dividends

S&P Dow Jones Indices

Contributor Image
Jason Ye

Director, Factors and Thematics Indices

S&P Dow Jones Indices

Introduction

In our previous study titled "Exploring China A-Share Dividends and High Yield Strategy Performance," we delved into the Chinese dividend market.  We found that historically, portfolios composed of high dividend yield stocks in China A-shares have consistently outperformed hypothetical broad market portfolios and those comprised of low dividend yield stocks.  In this paper, we aim to show how indexing methods can be employed to harness opportunities presented by high dividend yield strategies in the China A-shares market.

The Importance of Dividends

Dividends play a pivotal role in China A-shares equity investments for three reasons: 1) They constitute a substantial portion of total return in the equity market; 2) Dividend strategies can offer an alternative source of income; 3) Empirical research has shown that dividends as a factor have historically generated excess returns.

Dividend Contribution to Total Returns

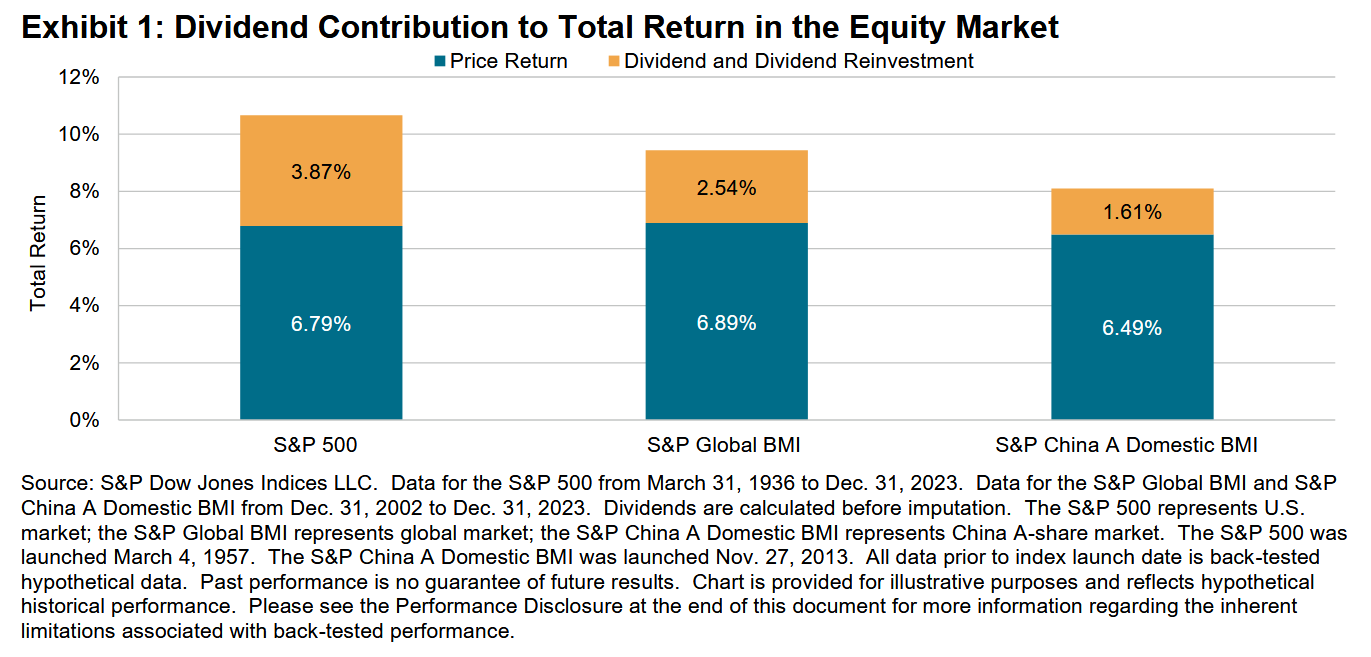
While the significance of dividends in contributing to equity total return is widely acknowledged globally, particularly in the U.S. market where dividends and dividend reinvestment have accounted for over one-third of the S&P 500® total return since 1936, the situation in the China A-shares market differs.  Here, dividends contribute to almost 20% of the total returns, a notable but comparatively smaller proportion compared to the U.S. stock market.  Interestingly, despite similarities in the long-term price return between the China A-shares market, the U.S. and the global market, differences in dividend contributions play a crucial role in the variance of total returns.  This suggests significant potential for growth in dividend payments within the China A-shares market (see Exhibit 1).

Dividend Contribution to Total Return in the Equity Market: Exhibit 1

Alternative Income Strategy

Traditionally, fixed income has been the primary asset class for income-seeking investors.  However, from 2008 to 2022, we witnessed a prolonged period of declining interest rates, especially in the U.S., posing challenges for investors aiming to generate income.  In response, some market participants have turned to dividend strategies within the equity market to explore yield opportunities.  Since 2022, led by the U.S. Federal Reserve, major markets like the U.S. have transitioned into a new phase of rising interest rates, with the federal funds rate exceeding 5% as of February 2024.  In contrast, China has experienced a downward trend in interest rates, making dividend strategies more relevant in the China A-shares market.  Further insights into the yield comparison will be provided in a following

pdf-icon PD F Download Full Article

TalkingPoints: Get to Know the S&P 500 Daily Covered Call Indices

Contributor Image
Arlene Habib

Senior Analyst, Multi-Asset Indices, Product Management

S&P Dow Jones Indices

Contributor Image
Parth Shah

Director, Derivative Indices

S&P Dow Jones Indices

The S&P 500® Daily Covered Call Index assesses the performance of a daily buy-write strategy, combining hypothetical long positions in the S&P 500 (TR) with hypothetical short positions in daily, PM-settled S&P 500 options using a dynamic strike selection. Including two subindices, the index series offers valuable insights into the value and potential income of its underlying components. This innovative approach serves as a distinctive mix of indexing and options and is a potential tool for those seeking equity performance with a focus on income.

   1. What is the S&P 500 Daily Covered Call Index Series?

The S&P 500 Daily Covered Call Indices measure the performance of the components of a daily buy-write strategy using an S&P 500 (TR) equity position and listed S&P 500 WeeklysSM Options one day from their maturity date. The series is comprised of a broad, commingled index strategy and two subindices intended to provide specific views of the strategy’s components.

    2. What are the component indices of the S&P 500 Daily Covered Call Index Series? The series is composed of the main S&P 500 Daily Covered Call Index along with the:

   3. How do the S&P 500 Daily Covered Call Indices reflect an income component?

The strategy reflected by the index combines the benefits of indexing with the theoretical income-generating potential of covered call options. One of the primary characteristics of covered call strategies is their ability to generate consistent income, which may potentially be increased by selling a call option daily.

The income story is further complemented by the theoretical dividends paid on the long S&P 500 (TR) position, which accounts for the daily reinvestment of all ordinary dividends on the S&P 500.

Additionally, hypothetical premiums collected daily may act as a supplementary source of returns beyond asset appreciation, providing potential downside protection and incremental return in flat markets.

Based on back-tested data, the index would have demonstrated a 23.03% gross premium yield, reflective of the cumulative sum of option premiums over the index value, and a net premium yield (premium adjusted by payout value) of 0.54% from June 1, 2022, to Dec. 29, 2023.

Talking Points: Get to Know the S&P 500 Daily Covered Call Indices: Exhibit 1

pdf-icon PD F Download Full Article

S&P/ASX Australian Fixed Interest Indices – A Look Back on the Past Decade

Contributor Image
Jessica Tan

Principal, Fixed Income Indices

S&P Dow Jones Indices

Contributor Image
Kangwei Yang

Director, Fixed Income Indices

S&P Dow Jones Indices

Introduction

Launched in October 2011, the S&P/ASX Australian Fixed Interest Index provides a broad measure of the performance of the Australian bond market.  Since its inception, the index and its subindices have been widely utilized among asset managers, including serving as benchmarks for Australian-focused ETFs.

Evolution of the Market

In 1983, the Australian dollar was moved to a floating exchange rate, which led to its internationalization.  Trading activity in the Australian dollar grew significantly and it is now one of the most actively traded currencies globally.  This has played an important role in the development of the AUD bond market, which is a key market for investors both domestically and internationally.

Over the past 10 years, the overall size (by notional outstanding) of the AUD bond market—as represented by the S&P/ASX Australian Fixed Interest 0+ Index—more than doubled, increasing from AUD 615 billion in late 2013 to AUD 1,327 billion at the end of 2023 (see Exhibit 1).  The outstanding notional of AUD-denominated Australian government bonds grew at a faster pace than corporate bonds during the past decade, increasing 127.3% and 82.5%, respectively.

As the market grew, Australian government and semi-government bonds remained the cornerstone of the bond market, representing close to 90% of the overall notional outstanding of the index.

pdf-icon PD F Download Full Article

TalkingPoints: How Glass-Box Optimization Brings Transparency to Sustainability

Contributor Image
Andrew Innes

Head of Global Research & Design

S&P Dow Jones Indices

Contributor Image
Leonardo M. Cabrer

Director, Global Research & Design

S&P Dow Jones Indices

Motivated by the continuing need for transparency in how sustainability and climate-related objectives are incorporated into the index construction process, S&P Dow Jones Indices (S&P DJI) has developed and deployed its own glass-box optimization method across a wide range of sustainability-focused indices. The approach aims to provide risk-efficient solutions with targeted outcomes while improving the interpretability and explainability of the selection and weighting of constituents. This is achieved by ensuring the sustainability-related data is the key driver for each company’s relative weight change to the underlying index. The end result is a clearer relationship between each company’s resultant weight in the index and its sustainability characteristics.

1. How does S&P DJI's glass-box optimization work?

In its simplest form, the glass-box optimization method minimizes active share, subject to the condition of proportional redistribution. It does this by minimizing the sum of the squared differences in constituent weights between those in the underlying benchmark, divided by each company’s weight in the benchmark.

Exhibit 0: The glass-box optimization method

In practice, when combined with a single constraint to improve an index-level sustainability metric (e.g., ESG scores) to a predefined target, we observe that the relationship between the proportional changes in each company’s weight and the sustainability metric is perfectly correlated. In other words, only the sustainability data is driving the constituent weight changes—and so they are completely explainable.

Exhibit 1: Relationship between Proportional Change in Weights with ESG Scores – Simple Glass-Box Index

2. Why do proportional weight changes matter?

S&P DJI’s glass-box optimization process ensures weight changes are related to the company’s underlying benchmark weight. For instance, two equally sustainable constituents—one large, one small—will be fairly rewarded within the simple glass-box-optimized index highlighted above. For example, both may increase proportionally by 1.2 times, rather than both receiving an additional two percentage points in index weight absolutely. The added benefit is that since the final index baskets are anchored to the weights of the float-adjusted market-capitalization-weighted benchmark, they may naturally inherit much of its enhanced liquidity and lower turnover.

pdf-icon PD F Download Full Article

Factor Strategies in Brazil: A Practitioner's Guide

Contributor Image
Rupert Watts

Head of Factors and Dividends, Product Management

S&P Dow Jones Indices

Contributor Image
Hugo Barrera

Senior Analyst, Factors and Dividends Product Management

S&P Dow Jones Indices

What Are Factor Indices?

Capturing market idiosyncrasies and desired risk/return characteristics has been a fundamental component in the active management space for decades.  Taking the fundamental ideology behind an investment strategy and democratizing it within an index allows for it to provide at minimum a gauge for relative performance and at best the ability to systematically track alpha.

When looking at factor strategies in Brazil, we will be focusing on four different strategies.

When looking at factor strategies in Brazil, we will be focusing on four different strategies.

Enhanced Value: At the most basic level, the goal of investing in value stocks is to buy stocks that are “cheap” or trading at a discount relative to their peers based on company fundamentals.

Momentum: The goal of momentum investing is to capture the stocks that have had the highest price appreciation relative to their peers with the expectation that they will further outperform in a rising market.

Quality: Investing in companies that have quality characteristics seeks to capture stocks that have fundamentals that exemplify a well-run company relative to their peers.

Low Volatility/Inverse-Risk Weighted: Low volatility or inverse-risk weighted strategies allow for participation in the market even during turbulent or volatile times.

Each strategy has its own risk/return characteristics that we will discuss throughout this paper.

pdf-icon PD F Download Full Article

Processing ...