IN THIS LIST

TalkingPoints: The S&P New China Sectors Index: Accessing the Growth Drivers of the “New China” Economy

FAQ: EU Low Carbon Benchmark Regulation

FAQ: Custom Cryptocurrency Indexing Capabilities

Frequently Asked Questions
ESG Back-Testing: Backward Data Assumption Overview

The S&P/BMV Total Mexico ESG Index: A New Benchmark for Sustainability and Investment

TalkingPoints: The S&P New China Sectors Index: Accessing the Growth Drivers of the “New China” Economy

Contributor Image
Michael Orzano

Head of Global Exchanges Product Management

S&P Dow Jones Indices

Take a look at how the S&P New China Sectors Index helps market participants see China’s changing economy in a novel way.

  1. What is the rationale behind the construction of the index?

    Historically, China’s growth has been driven by companies in the banking, natural resources, and manufacturing sectors—many of which are state-owned enterprises. However, as China’s economy matures, consumption and service-related industries are becoming structurally more important. Because the country’s stock market continues to have significant exposure to these “old economy” sectors, many market participants are seeking alternative index solutions to participate more directly in China’s fastest growth areas. We believe the S&P New China Sectors Index meets this need in the marketplace, given its focus on companies operating in industries poised to benefit from China’s transition to a consumer- and service-oriented economy.

  1. How does the index work?

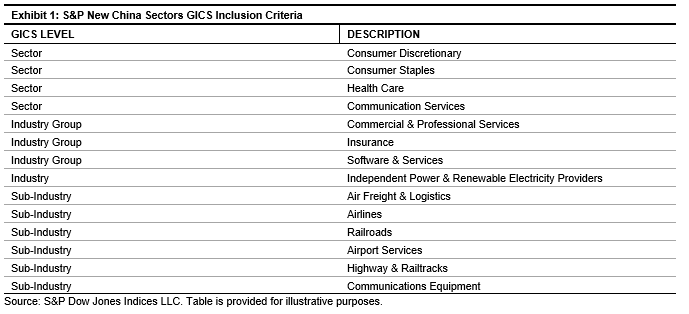
    Subject to meeting minimum size and liquidity requirements, all companies domiciled in China and Hong Kong are eligible, including A-shares and offshore listings in Hong Kong, the U.S., and Singapore. Companies classified within the Global Industry Classification Standard® (GICS®) sectors and industries listed in Exhibit 1 are then selected for inclusion.

    If more than 300 companies are selected, only the largest 300 by float-adjusted market cap are included. The index is weighted by float-adjusted market cap, subject to a single-stock cap of 10%, and it is rebalanced semiannually in June and December.

    TalkingPoints: The S&P New China Sectors Index: Accessing the Growth Drivers of the “New China” Economy: Exhibit 1

    />

pdf-icon PD F Download Full Article

FAQ: EU Low Carbon Benchmark Regulation

The EU Low Carbon Benchmark Regulation requires administrators of benchmarks (other than interest rate and FX) to comply with new requirements to disclose ESG factors in their methodology documents and benchmark statements.  The delegated regulations ((EU) 2020/1816 and (EU) 2020/1817) for ESG disclosure (“Delegated Regulations”) are effective as of Dec. 23, 2020.

EU LOW CARBON BENCHMARK REGULATION

  1. What are the regulations, and what do they aim to achieve? The EU Low Carbon Benchmark Regulation amends the EU Benchmark Regulation in two ways: first, it introduces two new benchmark classifications—EU Climate Transition Benchmarks (EU CTB) and EU Paris-Aligned Benchmarks (EU PAB)—and second, it requires administrators of ESG benchmarks to publish certain information.  Administrators of benchmarks that pursue ESG objectives must (i) publish an explanation of how key elements of the methodology reflect ESG factors; and (ii) explain in the benchmark statement how ESG factors are reflected for each benchmark or family of benchmarks.  The aims of the Delegated Regulations are to:
    • Create a common framework of requirements that promotes consistency, leading to greater comparability between benchmarks;
    • Clearly state if a benchmark pursues ESG objectives, helping investors to identify them; and
    • Generate greater transparency of a benchmark’s objectives to help investors understand them more easily.
  1. When did the Delegated Regulations come into effect? The Delegated Regulations are effective as of Dec. 23, 2020.
  2. Where does the EU Low Carbon Benchmark Regulation originate from? The European Commission published its action plan for financing EU sustainable growth in March 2018.[1]  A primary objective of the sustainable finance action plan is to channel private investment into the transition to a climate-neutral economy.  One of the initiatives that the EU has implemented to help achieve this goal is the amendment of the EU Benchmark Regulation.  This amendment enhances the ESG transparency of benchmark methodologies and specifies minimum methodology standards for low carbon benchmarks in the EU. 
  3. What are the disclosures required by the Delegated Regulations? The EU Low Carbon Benchmark Regulation requires benchmark administrators to make ESG disclosures in two separate documents: the benchmark methodology and the benchmark statement.  In addition, the Delegated Regulations mandate the use of specific disclosure templates.

pdf-icon PD F Download Full Article

FAQ: Custom Cryptocurrency Indexing Capabilities

  1. Who is your provider for cryptocurrency data?  Our cryptocurrency pricing and reference data is provided by Lukka, through their leading data products: Lukka Prime and Lukka Reference Data.  Lukka is the leading crypto asset software and data services provider for institutions, including fund administrators and fund auditors that serve over 160 active crypto funds today.  Founded in 2014, Lukka serves the largest digital asset institutions with middle and back office software and data solutions.
  2. What pricing is used as end of day for index calculation?  S&P Dow Jones Indices uses Lukka Prime Fair Market Value end-of-day prices for cryptocurrency index calculation.  This methodology is the first methodology designed specifically for determining the fair-value pricing of liquid crypto assets and is offered with institutional data quality standards.
  3. What is the Fair Market Value Pricing Methodology?  Lukka Prime Fair Market Value Pricing uses a proprietary methodology with both quantitative and qualitative factors to determine the primary market of each asset at any given time, in order to determine that asset’s fair market value.
  4. Why use Fair Market Value Pricing?  The Fair Market Value Pricing Methodology was designed to align to both GAAP and IFRS guidelines.  Additionally, Lukka Prime infrastructure and data quality adheres to the standards set by the AICPA for Service Organizations.  Lukka was the first AICPA SOC 1 Type 2 and AICPA SOC 2 Type 2 middle and back office crypto Service Organization.
  5. When are the cryptocurrency indices calculated?  The indices are calculated on the same day prices are captured. Currently, our standard end-of-day pricing is reported overnight at 3:30 a.m. EST.  Alternative capture times are available. Once the prices are captured, the S&P DJI system will perform index calculations and deliver index files. Index files will follow our standard file delivery format.
  6. Which cryptocurrencies are covered by Lukka?  Lukka Prime covers over 550 assets, representing the most liquid crypto assets, including the top-traded cryptocurrencies such as Bitcoin, Ethereum, Ripple, Tether, and Litecoin.  Prices are compiled from over 10 sources, including the largest and most trusted crypto exchanges, which represent the most liquidity.  Historical prices are available starting in 2014.

pdf-icon PD F Download Full Article

Frequently Asked Questions
ESG Back-Testing: Backward Data Assumption Overview

  1. What does “Backward Data Assumption” mean with respect to ESG data?  Typically, when S&P DJI creates back-tested index data, we use data from relevant databases, or actual live data.  Examples include constituent-level data such as historical price, market capitalization, and corporate action data.  As ESG investing is still in the early stages of development, certain data points used to calculate S&P DJI’s ESG indices may not be available for the entire desired period of back-tested history.  In such cases, S&P DJI may employ a process called “Backward Data Assumption (or pulling back) of ESG data for the calculation of back-tested historical performance.

    “Backward Data Assumption” is a process that applies the earliest actual live data point available for an index constituent company to all prior historical instances in the index universe.  For example, if an index methodology requires all eligible constituents to have product involvement data, and actual product involvement data is only available for a company from 2015 forward, then S&P DJI will use the 2015 product involvement data for that company for the purposes of calculating back-tested data for the years 2010 through 2014.

  1. Why is “Backward Data Assumption” for ESG data sometimes necessary?  Employing the Backward Data Assumption technique generally provides a more indicative depiction of index characteristics and risk/return profile than would be provided by limiting back-tests to actual live data. The Backward Data Assumption also allows the hypothetical back-test to be extended over more historical years than would be feasible using only actual live data.

    Many ESG data providers started with limited coverage and have been increasing their historical coverage over the past few years, so creating back-tests that use only actual historical live data would often lead to unrepresentative index constituent characteristics.  Without Backward Data Assumption of ESG data, far fewer companies would be eligible for or selected from the index universe in the back test compared with the same index’s more recent and on-going index universe of eligible and selected constituents.

    Therefore, S&P DJI may employ a Backward Data Assumption methodology to provide a longer and more representative back-test period.

  2. Are any live index rebalances affected by the practices of Backward Data Assumption?  Actual live data is used in the rebalance calculation of an index immediately prior to launch and in all rebalances after the launch of the index.  Backward Data Assumption may only affect the historical back-test prior to then.
  3. Which indices have back-tested history that uses Backward Data Assumption?  S&P DJI uses Backward Assumption Data with respect to Sustainalytics and Arabesque data, and sometimes uses it with respect to data from Trucost and SAM, both part of S&P Global.  Therefore, back-tested history for indices that use data from any of those sources may be affected by the Backward Data Assumption method.

    The methodology and factsheets of any index that uses Backward Assumption Data in back-tested history will explicitly state so.  The methodology will include a table setting forth the specific data points and relevant time period for which Backward Data Assumption was used.

  4. When do indices typically have back-tested history that uses Backward Data Assumption of ESG data?  For indices launched from 2020 onward, Backward Data Assumption is used in all indices that use exclusionary screens based on Sustainalytics’ product involvement data and Arabesque’s United Nations Global Compact (UNGC) data.

    For indices launched prior to 2020, Backward Data Assumption of ESG exclusionary screen data was limited only to Sustainalytics and Arabesque data for historical rebalances prior to 2013.

    S&P DJI may also employ Backward Data Assumption to S&P DJI’s ESG Scores and/or Trucost datapoints, if based on historical coverage it is determined that attaining the index objective would be severely restricted otherwise.  Historical coverage is assessed year-by-year, both in terms of the number of constituents and weight of those constituents in the underlying universe.

pdf-icon PD F Download Full Article

The S&P/BMV Total Mexico ESG Index: A New Benchmark for Sustainability and Investment

Contributor Image
María Sánchez

Director, Sustainability Index Product Management, U.S. Equity Indices

S&P Dow Jones Indices

Contributor Image
Cristopher Anguiano

Senior Analyst, U.S. Equity Indices

S&P Dow Jones Indices

INTRODUCTION

Indices that integrate environmental, social, and governance (ESG) data are moving from the margins to the mainstream, as investors increasingly seek to align their values with their investments.  A new type of ESG index is emerging to facilitate this change in Mexico: the S&P/BMV Total Mexico ESG Index.  Jointly developed by S&P Dow Jones Indices (S&P DJI) and the Mexican stock exchange (Bolsa Mexicana de Valores [BMV]), this index not only highlights strong ESG companies—as ESG indices have traditionally done—but it also enables investors to allocate to such companies without requiring them to take on major risks relative to the market.

THE EVOLUTION OF ESG INDICES

In 1999, S&P DJI launched the first global ESG index, the Dow Jones SustainabilityTM World Index (DJSI World).  By including the top 10% of companies, industry by industry, according to their ESG performance, as determined by the Corporate Sustainability Assessment (CSA) conducted by SAM, part of S&P Global, this groundbreaking index encouraged companies to incorporate many ESG factors in their decisions, extending beyond short-term financial considerations.

In the years that followed, other indices, including regional versions of the DJSI World, and local indices, such as the S&P/BMV IPC Sustainable Index, were launched with this same philosophy in mind: to highlight best-in-class companies and thereby inspire companies to improve their ESG approaches in order to qualify for inclusion in these indices.

Though these indices have been successful and have indeed inspired companies to change in positive ways, aspects of their methodologies present challenges for many investors.  Some strategies can be too narrow for investors who want to remain broadly diversified.  Though many high-conviction investors use the narrow, best-in-class indices for investment, we saw a need from market participants for ESG indices with returns more in line with the broader market, while providing a more sustainable portfolio of companies.  An example of an index that launched in 2019 that typifies this investor-oriented methodology is the S&P 500® ESG Index.

pdf-icon PD F Download Full Article

Processing ...