The S&P 500® Daily Covered Call Index assesses the performance of a daily buy-write strategy, combining hypothetical long positions in the S&P 500 (TR) with hypothetical short positions in daily, PM-settled S&P 500 options using a dynamic strike selection. Including two subindices, the index series offers valuable insights into the value and potential income of its underlying components. This innovative approach serves as a distinctive mix of indexing and options and is a potential tool for those seeking equity performance with a focus on income.
1. What is the S&P 500 Daily Covered Call Index Series?
The S&P 500 Daily Covered Call Indices measure the performance of the components of a daily buy-write strategy using an S&P 500 (TR) equity position and listed S&P 500 WeeklysSM Options one day from their maturity date. The series is comprised of a broad, commingled index strategy and two subindices intended to provide specific views of the strategy’s components.
2. What are the component indices of the S&P 500 Daily Covered Call Index Series? The series is composed of the main S&P 500 Daily Covered Call Index along with the:
-
- S&P 500 Daily Covered Call Index - Call Only, which measures the performance of only the short call component the S&P 500 Daily Covered Call Index and the cash component.
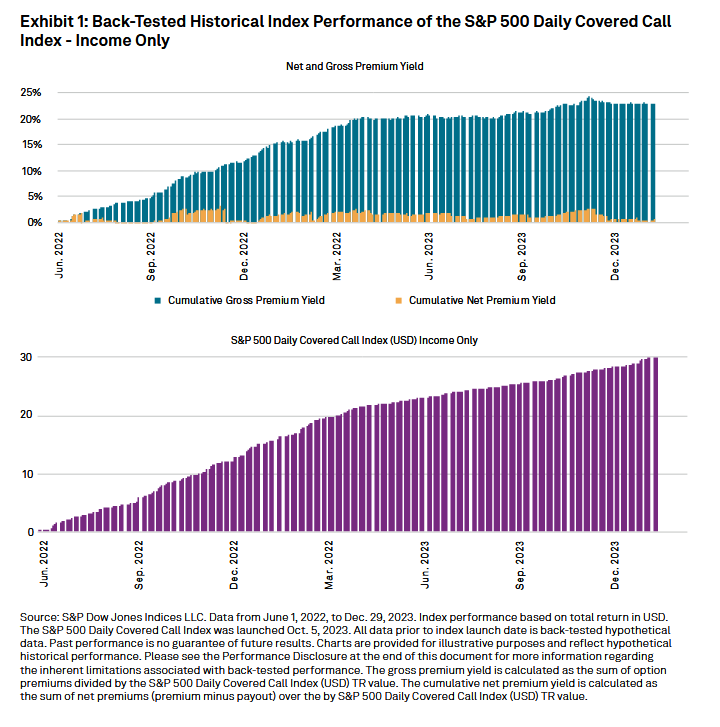
- S&P 500 Daily Covered Call Index - Income Only, which measures the total theoretical cash from call writing and the dividends from the S&P 500 Daily Covered Call Index.
3. How do the S&P 500 Daily Covered Call Indices reflect an income component?
The strategy reflected by the index combines the benefits of indexing with the theoretical income-generating potential of covered call options. One of the primary characteristics of covered call strategies is their ability to generate consistent income, which may potentially be increased by selling a call option daily.
The income story is further complemented by the theoretical dividends paid on the long S&P 500 (TR) position, which accounts for the daily reinvestment of all ordinary dividends on the S&P 500.
Additionally, hypothetical premiums collected daily may act as a supplementary source of returns beyond asset appreciation, providing potential downside protection and incremental return in flat markets.
Based on back-tested data, the index would have demonstrated a 23.03% gross premium yield, reflective of the cumulative sum of option premiums over the index value, and a net premium yield (premium adjusted by payout value) of 0.54% from June 1, 2022, to Dec. 29, 2023.