EXECUTIVE SUMMARY
- The S&P PACTTM Indices (S&P Paris-Aligned & Climate Transition Indices) have recently undergone methodology changes based on market feedback, as well as a name change to include “Net Zero 2050.”
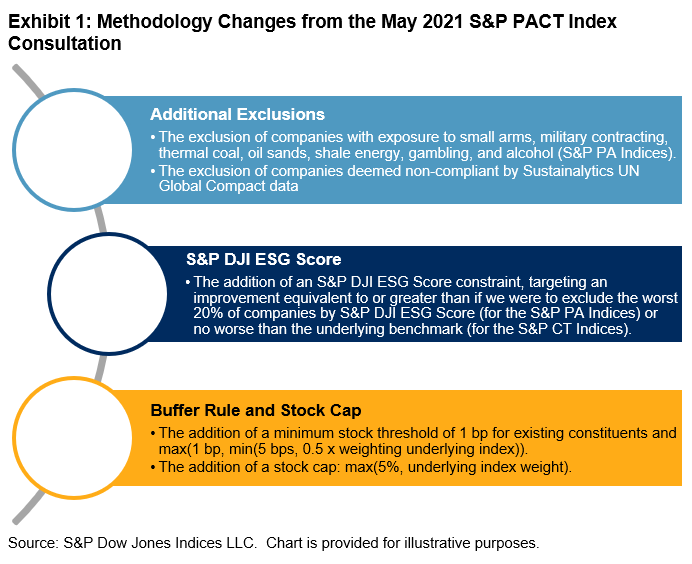
- The S&P PACT Indices now use the S&P DJI ESG Scores, exclude companies based on more business activities, and include a buffer rule and revised stock cap.
- The changes mean that choosing between a broad ESG index and a net zero/1.5°C-aligned index is no longer necessary.
- The S&P 500 PACT Indices show excess return historically, which can be largely explained by factor and sector exposures.
INTRODUCTION
Over the year since the launch of the S&P PACT Indices, the market has pushed for an index methodology evolution: the addition of an S&P DJI ESG Score improvement, further exclusions, a buffer rule, and revised stock capping (see Exhibit 1). The series comprises two types of indices: the S&P Climate Transition (CT) Indices and their more ambitious cousins, the S&P Paris-Aligned (PA) Indices. Both of these index series are aligned with the EU’s minimum standards for low carbon benchmarks under the EU Benchmark Regulation, which follow a 1.5°C scenario toward net zero by 2050, thus the name change to include “Net Zero 2050.” These methodology changes mean investors no longer need to choose between broad ESG indices and net zero/1.5°C-compatible indices—a first for the market.
In this paper, we outline how these methodology enhancements modify the index composition and the differences between the S&P CT and PA Indices, compare to the previous methodology, and provide a brief analysis of exposures and historical performance.


