IN THIS LIST

Introducing the S&P/ASX 200 High Dividend Index

Navigating Dividend Yield in the Hong Kong Market: The S&P Access Hong Kong Low Volatility High Dividend Index

Demystifying Volatility-Controlled Indices

FAQ: S&P/B3 Ibovespa VIX

U.S. High Yield Index Trading: The Kinetic Chain of High Yield Liquidity

Introducing the S&P/ASX 200 High Dividend Index

Contributor Image
Izzy Wang

Senior Analyst, Factors and Dividends

S&P Dow Jones Indices

Contributor Image
Jason Ye

Director, Factors and Thematics Indices

S&P Dow Jones Indices

Introduction

The S&P/ASX 200 High Dividend Index seeks to measure the performance of 50 companies with the highest 12-month forecast dividend yield from the S&P/ASX 200.  From July 2011 to December 2023, the index had an average trailing 12-month dividend yield of 5.6% and an annual excess return of 2.2% compared with the S&P/ASX 200.

The Australian equity market is well known for its high dividend yield and well-cultivated dividend culture.  With over AUD 5 billion AUM in exchange-traded products (ETPs), dividend income has become one of the most popular factor strategies in Australia.

However, strategies chasing the highest-yielding stocks could be vulnerable to “dividend traps.”  High dividend yield may come from decreasing stock prices rather than increasing dividend payments.  In addition, selecting stocks based on historical dividend payments may not reflect a company’s prospects.

The S&P/ASX 200 High Dividend Index seeks to mitigate common risks faced by high dividend yield strategies using two tactics.  First, it applies momentum screens.  Excluding stocks with low price momentum could avoid high-yield stocks driven by deteriorating prices, thus may help to eliminate the dividend trap.  Second, it uses forecast dividend data.  Selecting stocks based on 12-month forecast dividend data that is forward-looking may help to reflect the latest market expectations on a company’s future dividend payments.

Over the 12-year back-tested period, the S&P/ASX 200 High Dividend Index has shown significant outperformance, with higher dividend yield and cheaper valuation than the broad market benchmark.  For market participants seeking high yield and diversification benefits, the S&P/ASX 200 High Dividend Index could help to complement broad market allocation as well.

Index Construction

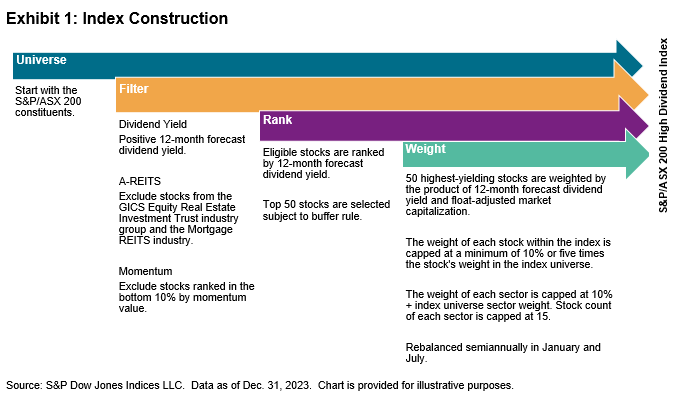
First, starting from the S&P/ASX 200 universe, all A-REITs and stocks without a positive 12-month forecast dividend yield are excluded.  Second, eligible stocks ranked in the bottom 10% by momentum value are screened out.  Finally, the 50 constituents with the highest 12-month forecast dividend yield are selected.

To balance between the index yield and index capacity, the 50 selected names are weighted by the product of the 12-month forecast dividend yield and the float market capitalization.  To avoid stock concentration risk, the weight of each stock within the index is capped at a minimum of 10% or five times the stock’s weight in the index universe.  In terms of sector diversification, each sector can have maximum of 15 stocks, and its weight cannot exceed the sector weight in the index universe plus 10%.  The index is rebalanced semiannually in January and July.

Introducing the S&P/ASX 200 High Dividend Index: Exhibit 1

pdf-icon PD F Download Full Article

Navigating Dividend Yield in the Hong Kong Market: The S&P Access Hong Kong Low Volatility High Dividend Index

Contributor Image
Jason Ye

Director, Factors and Thematics Indices

S&P Dow Jones Indices

Introduction

Amid the prolonged decline in the Hong Kong equity market spanning from 2020 to 2023, investors faced formidable challenges navigating the landscape of listed stocks in Hong Kong.  However, during this turbulence, a strategy that combines high dividends with a low volatility screen emerged as a strong performance generator.  S&P Dow Jones Indices (S&P DJI) has been at the forefront of integrating low volatility and high dividend factors since 2012, when we launched the first index of its kind, the S&P 500® Low Volatility High Dividend Index.  In previous research studies like "The Beauty of Simplicity: The S&P 500 Low Volatility High Dividend Index" and "Blending Low Volatility with Dividend Yield in the China A-Share Market,"  S&P DJI's research team underscored the efficacy of integrating these factors in both the U.S. and China A-Shares markets.  Building upon this foundation, our index offering extends to the Hong Kong-listed stock market.

In this paper, we introduce the S&P Access Hong Kong Low Volatility High Dividend Index, a pioneering index that tracks 50 high dividend yield stocks within the S&P Access Hong Kong Index universe.  Through our exploration, we shed light on the historical performance and characteristics of this index.

Empirical Study

In a related paper, “Exploring China A-Share Dividends and High-Yield Strategy Performance,” we performed an empirical study of quintile analysis on hypothetical portfolios sorted by dividend yield in the China A-Shares market.  We extended the same framework to conduct an analysis of stocks in the Hang Seng Composite Index (HSCI) universe.

We sorted dividend-paying stocks according to their trailing 12-month dividend yield and allocated them to five hypothetical portfolios based on dividend yield, ranging from highest to lowest, with non-dividend-paying companies assigned to a separate sixth portfolio.  We rebalance the hypothetical portfolios semi-annually at the end of January and July.

pdf-icon PD F Download Full Article

Demystifying Volatility-Controlled Indices

Contributor Image
Sara Pollock

Director, Multi-Asset Indices

S&P Dow Jones Indices

Volatility-controlled indices are widely used crediting options within fixed index annuities and indexed universal life insurance policies.  However, the nomenclature sounds more complex than what the indices aim to achieve.

Here we will demystify what volatility-controlled indices are, their general mechanics, and the potential benefits they provide to the insurance ecosystem.

What Is a Volatility-Controlled Index?

A volatility-controlled index (also referred to as a risk control index) is one that is designed to manage to a target volatility level.

The most common components of a volatility-controlled index are an underlying index and a theoretical cash component. While equity indices seem to be the most frequently used indices in the insurance industry, multi-asset indices, such as the S&P MARC 5% Index, have also increased in usage in recent years.

As a general principle, when market volatility is higher than the target volatility level of the index, the index will allocate weight to the cash component to dampen volatility.  On the other hand, when market volatility is lower than the target, the index can allocate more than 100% weight to the underlying index.

The ability to either move component weighting to cash or increase exposure above 100% helps the index as it seeks to maintain a target volatility level.

An Overview of a Risk Control Index Mechanic: Exhibit 1

What Are the Potential Benefits?

  • Increased Stability: When an index is managed to a volatility target, it typically realizes a more consistent volatility level than an index without a risk overlay.
  • Simplicity: A volatility-controlled index provides a simple, transparent methodology based on the underlying index’s historical volatility.
  • Hedging Efficiencies: The more stable volatility experience may improve hedging efficiencies for insurance products based on the index, which may in turn lead to cost savings.

It is important to note that certain potential benefits of volatility-controlled indices work in tandem with the specific features of insurance products, which are entirely within the control of the insurance carrier.

Insurance carriers may consider the combination of a volatility-controlled index and the insurance product implementation to look to provide an improved outcome for the carrier’s customers.


pdf-icon PD F Download Full Article

FAQ: S&P/B3 Ibovespa VIX

  1. What is the S&P/B3 Ibovespa VIX?  The S&P/B3 Ibovespa VIX seeks to measure the 30-day implied volatility in the Brazilian stock market.  It is a real-time index that reflects investor sentiment about the expected volatility in the Brazilian benchmark equity index, the Bovespa index (Ibovespa B3). It is the first implied volatility index designed for the domestic market and uses the same methodology framework as the widely followed Cboe Volatility Index (VIX®), which measures near-term volatility implied by S&P 500® options prices.
  2. How is the index calculated?  The S&P/B3 Ibovespa VIX is calculated throughout each trading day by averaging the weighted prices of a specific group of Ibovespa index options. The index generally uses put and call options in the two nearest-term expiration months in order to bracket a 30-day calendar period. Variances at these two different expirations are derived and are interpolated to calculate a constant 30-day variance. VIX is derived by transforming this variance into a standard deviation and multiplying by 100. Please see the methodology document for complete details regarding the calculation methodology.
  3. How does VIX indicate market sentiment?  Implied volatility typically increases when markets are turbulent and the economy is faltering. In contrast, if stock prices are rising and no dramatic changes seem probable in the near-term, VIX tends to fall or remain steady at the lower end of its range. Since VIX reaches its highest levels when the stock market is most unsettled, the media tend to refer to VIX as a “fear gauge.”

  1. What is the difference between implied and realized volatility?  Implied volatility refers to the market’s assessment of future volatility based on options prices, whereas realized volatility measures historical volatility of returns. VIX measures implied volatility, specifically 30 days in the future.
  2. What does a VIX level signify?  The index level represents an annualized volatility statistic. For example, an index level of 20 corresponds to an expectation for a standard deviation of 20% in Ibovespa returns over the next 30 days. VIX also projects the probable range of movement in the equity market above and below its current level, over the next 30 days. When implied volatility is high, the VIX level is high and the range of values is broad. When implied volatility is low, the VIX level is low and the range is narrow. Mathematically, a relatively low VIX level of 10 implies an expected range of the Ibovespa of plus/minus 2.9%. A relatively high VIX of 35 implies an expected range of the Ibovespa of plus/minus 10.1%.
  3. What is the relationship between the S&P/B3 Ibovespa VIX and the Ibovespa?  Volatility indices and their associated equity indices are typically negatively correlated—meaning they tend to move in opposite directions. Based on back-tested data from May 6, 2021, we’ve observed a negative correlation between the S&P/B3 Ibovespa VIX and the Ibovespa of -0.59. 

pdf-icon PD F Download Full Article

U.S. High Yield Index Trading: The Kinetic Chain of High Yield Liquidity

Contributor Image
Nicholas Godec

Senior Director, Head of Fixed Income Tradables & Private Markets

S&P Dow Jones Indices

Executive Summary

The high yield bond market is fragmented in nature and primarily trades over the counter.  Each bond carries unique credit risk, coupons, maturities, optionality and levels of liquidity.  Bilateral trades introduce counterparty risk, which investors consider in addition to the credit analysis of high yield bond issuers.

High yield indices reflect the high yield market and aid investors with price discovery.  For instance, as measured by the iBoxx® USD High Yield Developed Markets Index, we can understand that the notional size of the USD high yield bond market has grown by only 6.5% over the past five years, to approximately USD 1.4 trillion, while delivering an aggregate total return of 28.2% over the same five-year period.

U.S. High Yield Index Trading: The Kinetic Chain of High Yield Liquidity: Exhibit 1

We can also understand that, with a yield of 7.6% and a duration of 3.6 years as of Dec. 31, 2023, USD high yield bond yields are approximately 100 bps higher than the prior five-year average, while index duration is 0.2 years lower than the five-year average.  This detail helps summarize the overall market in single point figures, creating clarity from the noise.

U.S. High Yield Index Trading: The Kinetic Chain of High Yield Liquidity: Exhibit 2

High yield indices help enable understanding of these and other market characteristics because they include risk/return statistics at the index level and underlying bond level published daily, along with static data such as rating, sector and maturity breakdowns.  Bond prices fuel daily index calculations, so reliable pricing that powers high yield indices is paramount.  The Pricing Team of the S&P Global Market Intelligence division provides component pricing for the iBoxx USD Liquid High Yield Index and CDX High Yield, including end-of-day and intraday pricing.  Pricing is determined by several factors, including executed trades, dealer quotes, banks’ books of record and model inputs like issuer curves and comparable assets.  The pricing process is overseen by expert pricing analysts who cover specific markets and who review the algorithmic pricing process.

This pricing visibility informs index-tracking tradeable products, like ETFs, futures, total return swaps and swaps on credit default swap indices.  Options markets linked to such instruments provide investors with new ways to trade high yield credit volatility.  Each instrument becomes an additional source of market color for investors, which drives greater market efficiency, including for those who do not trade index-linked products.

So, high yield indices help standardize and describe the market.  At the same time, high yield index-tracking tradeable products provide high yield investors with ways to trade and invest according to these standard definitions.  Tradeable high yield index products have evolved to primarily trade within a centrally cleared framework, which mitigates counterparty risk.

pdf-icon PD F Download Full Article

Processing ...