U.S. mega caps have become increasingly important in driving equity returns in recent years amid outperformance from some of the largest companies. Given this elevated importance, this paper provides an overview of the S&P 500® Top 50 Index, which seeks to measure the performance of mega-cap U.S. equities by selecting the largest 50 companies in the S&P 500 annually. Specifically, this paper:
• Highlights the potential relevance of U.S. mega-caps;
• Outlines the S&P 500 Top 50 Index's construction and analyzes the index's historical risk/return characteristics, and;
• Shows how incorporating U.S. mega-caps could help investors alleviate domestic sector biases.
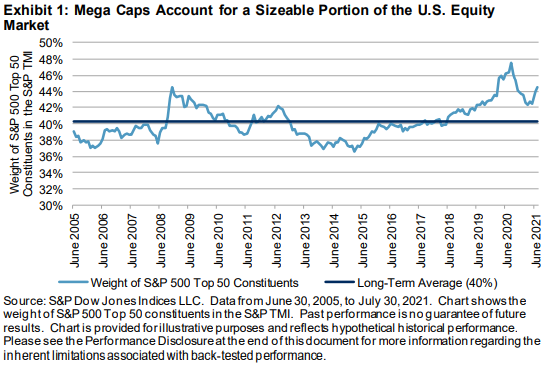
Exhibit 1 shows that S&P 500 Top 50 Index constituents accounted for around 60% of the U.S. large-cap equity market, as represented by the S&P 500, at the end of June 2025. This figure ranked in the top 10% of quarter-end readings since December 1970 and was far above the long-term average of 51%.
Potential Relevance of U.S. Mega-Cap Companies to Global Market Participants
The breadth and depth of the U.S. equity market means that trends affecting U.S. companies tend to be relatively important in driving global equity returns. For example, U.S.-domiciled companies accounted for 62% of the weight of the S&P Global BMI as of June 30, 2025, more than 10 times larger than the index’s second-largest country, Japan.
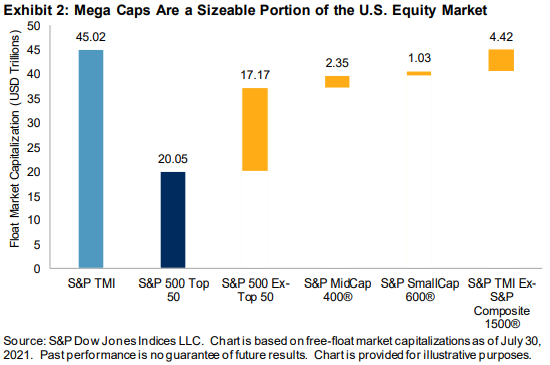
Exhibit 1 showed that mega-cap companies represented a sizeable portion of the U.S. large-cap equity market, as represented by the S&P 500. Exhibit 2 reinforces the potential relevance of mega-cap U.S. equities by comparing the float market capitalization of the S&P 500 Top 50 Index to the entire U.S. equity market—as measured by the S&P Total Market Index (TMI)—and various size segments therein as of June 30, 2025. While smaller U.S. equity segments are as large as certain countries’ equity markets, S&P 500 Top 50 Index constituents are collectively an order of magnitude larger.
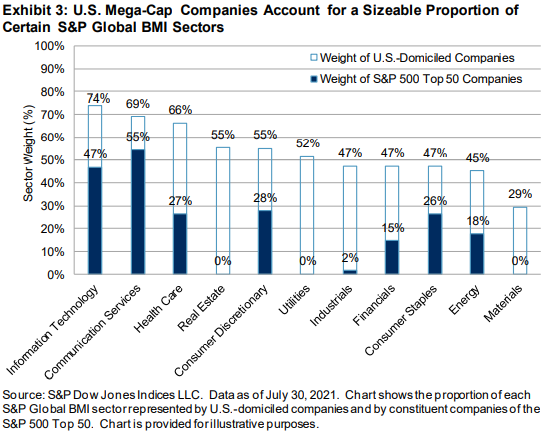
Perhaps unsurprisingly, U.S. mega-cap companies can have an outsized impact on global equity returns and measuring their performance may help to identify prevailing market narratives. This is especially the case for certain global equity sectors: Exhibit 3 shows that, as of June 30, 2025, U.S. companies accounted for the majority of the float market capitalization in most S&P Global BMI sectors, and U.S. mega-cap companies accounted for a sizeable proportion of this weight.
For example, U.S.-domiciled companies accounted for 80% of the S&P Global BMI Information Technology sector’s float market capitalization, while S&P 500 Top 50 Index constituents represented 62% of the global Information Technology sector’s weight. In other words, more than three-quarters of the U.S. Information Technology sector representation—or 62% of the 80%—came from S&P 500 Top 50 constituents.