IN THIS LIST

Collaborating Efficiently in the Rise of Remote Work

Gauging Opportunities from the Hydrogen Economy

FAQ: S&P Carbon Control Indices

The Resilience and Relevance of Global Sukuk

FAQ: S&P Cryptocurrency Index Series

Collaborating Efficiently in the Rise of Remote Work

Contributor Image
Jason Ye

Director, Factors and Thematics Indices

S&P Dow Jones Indices

The onset of the COVID-19 pandemic has caused tremendous changes to the economic and social world, completely revamping the way we communicate and collaborate in the work environment.  Corporations globally have been rethinking work models as we start to consider the post-pandemic world.  Even as some countries start to open up gradually, more flexible work arrangements seem to be popular options going forward, and corporations will need strategies that help workers collaborate efficiently.

Enterprise collaboration might be the answer.  Enterprise collaboration is a set of solutions designed to help users communicate and complete work tasks within their enterprise.  It includes various tools, platforms, groupware, and networks, which are intended to empower enterprise-wide coordination.  The enterprise collaboration market size is expected to grow from USD 47.2 billion in 2021 to USD 85.8 billion by 2026.  S&P Dow Jones Indices launched the S&P Kensho Enterprise Collaboration Index to track companies involved in the enterprise collaboration market.

From 2020 to 2022, during which 55% of global businesses offered the capacity to work from home, enterprise collaboration shaped the online working style by enabling individuals and teams to work together via the internet.  Since the COVID-19 outbreak, the demand for better enterprise collaboration solutions has continued to evolve and likely be a main trend for the long term.

pdf-icon PD F Download Full Article

Gauging Opportunities from the Hydrogen Economy

Contributor Image
Jason Ye

Director, Factors and Thematics Indices

S&P Dow Jones Indices

EXECUTIVE SUMMARY

The Fourth Industrial Revolution will be driven by renewable energy, and in the context of energy transition, hydrogen could play a vital role.  According to the International Energy Agency (IEA), to achieve net zero emissions by 2050, an investment of USD 1.2 trillion in low-carbon hydrogen supply and use would be required. The hydrogen council projected a USD 2.5 trillion global hydrogen market by 2050. The U.S. Department of Energy projected an estimated USD 750 billion annual revenue and a cumulative 3.4 million jobs created by 2050 under the hydrogen economy. Leveraging advanced machine learning and natural language processing technology, S&P Dow Jones Indices launched the S&P Kensho Hydrogen Economy Index, which is designed to track companies involved in the hydrogen economy, including companies focused on the production, transportation, and storage of hydrogen.  In this paper, we will introduce the hydrogen economy, and how we measure the opportunity from it through an indexing approach.

INTRODUCTION

Hydrogen is the simplest and smallest element in the periodic table.  It is also the most abundant chemical substance in the universe, constituting roughly 75% of all normal matter.  On Earth, hydrogen is mostly found in molecular forms such as water and organic compounds.  Like electricity, hydrogen is also secondary energy.  Hydrogen can be produced from water; when molecular hydrogen and oxygen are combined and react, the process generates energy, and either water or hydrogen peroxide is produced.  The heating value of the process is 141.80 MJ/kg, which is 3 times the heat value of diesel (44.80 MJ/kg), and 4.3 times the heat value of coal (32.50 MJ/kg). Unlike burning diesel or coal, the combustion process of hydrogen generates zero carbon emissions.  If we can reduce or eliminate the carbon emission in the hydrogen production process, it could be a clean, efficient, and sustainable energy source that would likely play an essential role in the decarbonization movement of the next few decades.

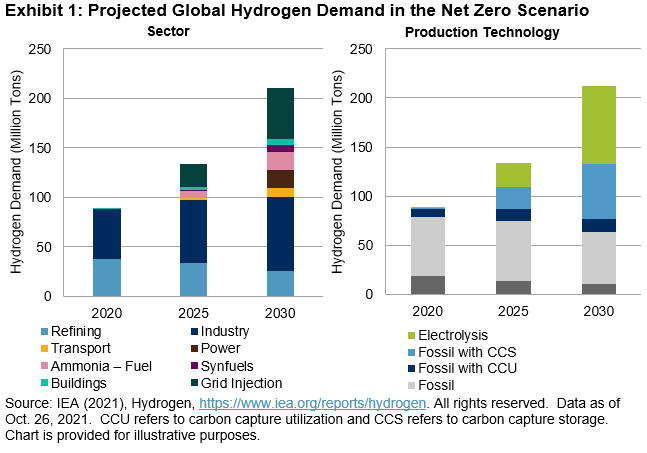
Professor John Bockris came up with the term “hydrogen economy” in his speech at the General Motors Technical Center in 1970.  However, the process of establishing a hydrogen economy has historically been slow and challenging, primarily due to the large scale of infrastructural investment required and high hydrogen production costs.  As of 2020, the global demand for hydrogen was about 70 million tons (see Exhibit 1).  Almost all this demand was for refining and industrial use, such as decreasing sulfur content in diesel fuel and production of ammonia and methane.  In the future, hydrogen can replace natural gas to provide heat for buildings, and be used for oil refinement, cement production, and steelmaking in the industrial sector.  It can serve as an alternative to fossil fuel for vehicles such as buses, trains, ships, and even airplanes.  In addition, hydrogen can be used as a storage of low-cost, excess renewable electricity, which could support the integration of renewable electricity systems.  Under the net zero by 2050 scenario, global hydrogen demand could almost triple by 2030, reaching over 200 million tons (see Exhibit 1).

On the production side, currently, hydrogen is produced mainly from fossil fuels (gray hydrogen), resulting in close to 900 million tons of CO2 emissions per year. Under the net zero scenario, the growth of hydrogen demand would be supplied by the production of blue hydrogen and green hydrogen (see Exhibit 1).

Gauging Opportunities from the Hydrogen Economy: Exhibit 1

pdf-icon PD F Download Full Article

FAQ: S&P Carbon Control Indices

S&P Carbon Control Indices

  1. Who is S&P Dow Jones Indices?  S&P Dow Jones Indices (S&P DJI) is the largest global resource for essential index-based concepts, data, and research, and it is home to iconic financial market indicators, such as the S&P 500® and the Dow Jones Industrial Average®. S&P Dow Jones Indices has been a pioneer in environmental, social, and governance (ESG) indexing for more than 20 years, starting with the 1999 launch of the Dow Jones Sustainability World Index. Today, we offer an extensive range of indices to fit varying risk/return and ESG expectations, from core ESG and low-carbon climate approaches to thematic and fixed income ESG strategies.
  2. Who is S&P Global Trucost?  S&P Global Trucost is a leader in carbon and environmental data and risk analysis and assesses risks relating to climate change, natural resource constraints, and broader ESG factors.
  3. Where does S&P DJI get its ESG data?  S&P Global provides the data that powers the globally recognized Dow Jones Sustainability Indices (DJSI), S&P 500 ESG Index, and others in the S&P ESG Index Series. Each year, S&P Global conducts the Corporate Sustainability Assessment (CSA), an ESG analysis of over 11,000 companies. The CSA has produced one of the world’s most comprehensive databases of financially material sustainability information and serves as the basis for the scores that govern S&P DJI’s ESG indices.
  4. S&P CARBON CONTROL INDICES

  5. What are the S&P Carbon Control Indices? These indices are designed to measure the performance of eligible securities from an underlying benchmark index, selected and weighted to minimize the weighted average carbon intensity, subject to index active share, active industry group weight, active country weight, and diversification constraints. The indices also apply exclusions based on companies’ involvement in specific business activities, performance against the principles of United Nations’ Global Compact, involvement in relevant ESG controversies, and companies with low ESG scores relative to global averages in each Global Industry Classification Standard (GICS®) industry group.
  6. Why were the S&P Carbon Control Indices created?  Each index in the series aims to (a) greatly reduce average carbon intensity of the underlying benchmark; (b) screen out companies that derive significant revenue from objectionable practices, industries, or product lines, as well as those identified as ESG laggards; and (c) offer broad diversification across a range of companies in the underlying index.

pdf-icon PD F Download Full Article

The Resilience and Relevance of Global Sukuk

Contributor Image
Jason Giordano

Director, Fixed Income

S&P Dow Jones Indices

INTRODUCTION

The global sukuk market has proven itself as an effective measure of some of the fastest-growing economies in the world, while also providing steady cash flow. Unlike traditional fixed income investments, sukuk offer a stake in the underlying assets and pay investors a percentage of profit at predefined regular intervals. Sukuk could be attractive to both Muslim and non-Muslim investors as an alternative to conventional bonds for those looking for diversification options.

As evidenced during the start of the global pandemic in early 2020, the sukuk market witnessed a more muted downturn relative to traditional bond markets and experienced a quick recovery afterward.  This resilience during volatile times is often tied to the high-quality nature of issuers and strong credit fundamentals of the underlying sukuk structure.

Despite a small decrease in market size for 2020, the U.S. dollar-denominated sukuk market has experienced a compound annualized growth rate of nearly 20% since 2013, as measured by the Dow Jones Sukuk Total Return Index (ex-Reinvestment) and the S&P Global High Yield Sukuk Index. As capital needs evolve and investor awareness broadens, the global sukuk market is well positioned to build on its current momentum.

pdf-icon PD F Download Full Article

FAQ: S&P Cryptocurrency Index Series

S&P Cryptocurrency Indices

  1. What are the S&P Cryptocurrency Indices? These indices are designed to measure the performance of a selection of cryptocurrencies, also referred to as “coins” in this document, that meet minimum liquidity and market capitalization criteria and are listed on trading facilities (referred to within this document as “exchanges”) included among the primary markets covered by the Lukka Prime data product published by Lukka, Inc. In the cryptocurrency context, market capitalization refers to the product of coin supply (explained in question 18) at a given point in time multiplied by coin price. The term exchange as used in this FAQ does not refer to a “national securities exchange” that has registered with the Securities Exchange Commission (SEC) or other comparable securities exchange registered in another jurisdiction.
  2. Why was the S&P Cryptocurrency Index Series created?  The S&P Cryptocurrency Index Series was launched to bring transparency to the emerging cryptocurrency market. For more background, visit https://www.spglobal.com/spdji/en/landing/investment-themes/sp-cryptocurrency-indices/.

  1. What indices are in the S&P Cryptocurrency Index Series? As of Feb. 4, 2022, the S&P Cryptocurrency Index Series includes the following 16 indices:
  • S&P Bitcoin Index: This index is designed to track the performance of the digital asset Bitcoin.
  • S&P Ethereum Index: This index is designed to track the performance of the digital asset Ethereum.
  • S&P Cryptocurrency MegaCap Index: This index is designed to track the performance of the digital assets Bitcoin and Ethereum weighted by market capitalization.
  • S&P Cryptocurrency Broad Digital Market (BDM) Index: This index is designed to measure the performance of digital assets that meet minimum liquidity and market capitalization criteria and that are covered by our price provider Lukka. The index is meant to reflect a broad investable universe.
  • S&P Cryptocurrency LargeCap Index: This index is a subset of the S&P Cryptocurrency BDM Index designed to track the constituents with the largest market capitalization.
  • S&P Cryptocurrency BDM Ex-MegaCap Index: This index is designed to track the constituents of the S&P Cryptocurrency Broad Digital Market Index, excluding the constituents of the S&P Cryptocurrency MegaCap Index.

pdf-icon PD F Download Full Article

Processing ...