IN THIS LIST

Carbon Accounting for Climate Aware Commodity Indexing

Introducing the Dow Jones Taiwan Technology Dividend 30 Index

TalkingPoints: U.S. Equities and Sectors in Election Years

The iBoxx USD Liquid Emerging Markets Sovereigns & Sub-Sovereigns: A New Tool for the Emerging Market Bond Ecosystem

FAQ: S&P Dow Jones Indices’ June 2024 Quarterly Rebalance of the Technology Select Sector Index

Carbon Accounting for Climate Aware Commodity Indexing

Contributor Image
Brian D. Luke

Senior Director, Head of Commodities, Real & Digital Assets

S&P Dow Jones Indices

Introduction

Commodities have largely remained outside the purview of environmental investment frameworks, creating a gap in investing across all asset classes.  The global investment landscape is witnessing a transformative shift toward sustainability, in part driven by increasing awareness of the environmental impact of commodity production and the clean energy transition.  According to the latest S&P GSCI® world production average, over 25 billion barrels of oil are produced each year.  Combining that with the S&P Global Trucost estimate that one barrel of oil produces over 400 kilograms of CO2 equivalent (kgCO2e), the total carbon emissions for oil are over 10 trillion kgCO2e.

Investors in commodities primarily access the market through derivatives, such as oil futures.  These derivatives serve as vital tools for commodity producers, consumers and investors.  This paper explores how index-based commodity investing could be seen through a sustainable investing lens and examines the challenges and opportunities in integrating environmental considerations across asset classes.  It also delves into the role of commodity derivatives in financial markets and outlines a framework for carbon accounting to measure environmental impact.  Additionally, it highlights how the S&P Global Commodity Environmental dataset can be leveraged to measure carbon intensity for commodity indices.

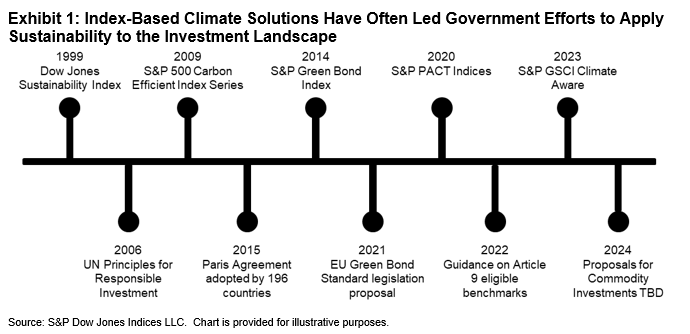
Finally, this paper highlights the significance of benchmarks for environmental investing, offering an introduction to the S&P GSCI Climate Aware as a forward-thinking approach to climate-focused commodity investments.  The S&P GSCI Climate Aware is a prominent example in the past quarter century of incorporating environmental, social and governance (ESG) considerations into leading benchmarks before policy makers and regulators adopt similar rules into investment practices (see Exhibit 1).

Carbon Accounting for Climate Aware Commodity Indexing: Exhibit 1

Looking at Commodities through a Sustainable Investing Lens

The paradox in sustainable commodity investing lies in the fact that while there are extensive proposals affecting sustainable investments in stocks and bonds, commodities—one of the largest contributors to environmental degradation—remain largely untouched.  Governments around the world have introduced several regulatory measures to enhance sustainable investing practices, but the scope of these regulations has mainly focused on equity and fixed income investment products.  The European Union (EU) has led the march toward transparency and accountability for investors, asset managers and companies.

Commodity production and consumption is considered one of the leading causes of environmental degradation. While the physical production of a commodity can have a direct impact on the environment, investing in commodity derivatives could be viewed in the same light as investing in equities and bonds.  Buying stock in a company that emits carbon isn’t the same as emitting the carbon oneself, but there is an association.  While such a throughline exists for stocks and bonds, financial instruments associated with commodities, like commodity derivatives, are not subject to specific sustainability regulations.  We will discuss two elements used to create sustainability metrics in a commodity index.  First, we look at the use of transparent data to measure the impact of commodity production, and second, the connection with the physical production of commodities and the financial instruments that support the commodities market.

pdf-icon PD F Download Full Article

Introducing the Dow Jones Taiwan Technology Dividend 30 Index

Contributor Image
Izzy Wang

Senior Analyst, Factors and Dividends

S&P Dow Jones Indices

Contributor Image
Jason Ye

Director, Factors and Thematics Indices

S&P Dow Jones Indices

Introduction

The Dow Jones Taiwan Technology Dividend 30 Index takes an innovative approach to linking growth potential from technology companies with high dividend yield.  It seeks to measure the performance of 30 Information Technology and Communication Services companies with the highest indicated annual dividend (IAD) yield in the Taiwan market, subject to fundamental and dividend sustainability criteria.  From April 2013 to June 2024, the index had an average trailing 12-month dividend yield of 5.7% and an annual total return of 15.88%, outperforming the S&P Taiwan BMI by 2.59%.

In most markets, high-dividend-yield stocks are often associated with the Financials sector and defensive sectors such as Utilities, rather than growth sectors such as Information Technology.  This implies that searching for yield could mean giving up growth exposure for many market participants.  However, Taiwan is a unique exception.

In the 1960s, Taiwan emerged as a hub for integrated circuit (IC) assembly and packaging for foreign companies and later started to accumulate chip engineering and manufacturing know-how domestically.  After a half-century of development, it is now home to 314 semiconductor companies, accounting for over 90% of worldwide production of below-7nm semiconductors. Its Information Technology sector, which is predominately represented by semiconductor manufacturers, has evolved to be the core of Taiwan’s economy.  As of June 30, 2024, the Information Technology sector makes up 71.45% of the S&P Taiwan BMI.

Cultivated over nearly a half-century, technology companies in Taiwan grew to be mature enough to maintain a profit distribution policy.  In the Information Technology sector, 91.5% of companies paid a dividend during the 2023 calendar year with an average payout ratio of 63.7%, and 71.6% of companies had paid a dividend for five consecutive years.  In 2023, dividends from the Information Technology sector accounted for 57.8% of total dividends paid in the Taiwan market.

Additionally, surging global demand for semiconductor and related electrical components in recent years has benefited technology stocks in the Taiwan market.  In 2023, the Information Technology sector of the S&P Taiwan BMI posted a positive price return of 41.63% in USD terms, outperforming the S&P 500® by 17.4%.

Taiwan’s unique economic development and the characteristics of its market today provide a potential opportunity to track high-dividend-yielding technology companies.  Over the 11-year back-tested period, the Dow Jones Taiwan Technology Dividend 30 Index was able to maintain a level of price appreciation comparable to that of its broad market benchmark, while also delivering significant outperformance in terms of total return, showing the index’s historical ability to track high-dividend-yielding companies while maintaining growth exposure.

Dow Jones Taiwan Technology Dividend 30 Index Construction

The starting universe for the Dow Jones Taiwan Technology Dividend 30 Index are stocks from the Information Technology and Communication Services GICS® sectors in the S&P Taiwan BMI that meet size and liquidity criteria, and that have paid dividends for five consecutive years.  Then, those eligible stocks must pass two out of three fundamental screenings: positive free cash flow, positive ROE and positive five-year dividend growth.  Finally, the 30 constituents with the highest IAD yield are selected.

pdf-icon PD F Download Full Article

TalkingPoints: U.S. Equities and Sectors in Election Years

Contributor Image
Hamish Preston

Head of U.S. Equities

S&P Dow Jones Indices

1. Why is the U.S. market relevant to investors worldwide?

The U.S. equity market is the largest in the world, with U.S.-domiciled companies representing 60% of the index market capitalization of S&P Dow Jones Indices’ (S&P DJI’s) global equity barometer—the S&P Global BMI—at the end of March 2024. The U.S. also accounts for most of the index market capitalization in 10 of the 11 S&P Global BMI GICS sectors.

Hence, market participants that do not have a U.S. view risk overlooking a sizeable portion of the global equity opportunity set. Not only might this make it more difficult to explain the impact of narratives on global equity returns, but the distinct makeup of the U.S. equity market means that overlooking U.S. equities may impact investors’ abilities to gain strategic or tactical exposures.

2. What role can indices play in measuring equity markets?

Since Charles Dow and Edward Jones began publishing the first ever index—the Dow Jones Railroad Average—towards the end of the 19th century, indices have allowed investors to monitor the impact of trends on different market segments and to benchmark the performance of active managers.

While the first indices were equity market measures, transparent, rules-based indices have since been created for a variety of asset classes. Nowadays, indices also measure the performance of more complex strategies previously thought to be solely within the realm of active management.

Accompanying—and to a large extent, driving—the proliferation of index information, indices have come to serve as the basis for investment products, globally. The substantial adoption of index-based investment products has been driven by the increased awareness of the substantial body of evidence that shows that most active managers underperformed on an absolute and risk-adjusted basis most of the time. For example, more than 90% of U.S. Large-Cap funds based in the U.S. underperformed the S&P 500® over a 20-year period ending on Dec. 31, 2023.European Equity funds focused on large-cap U.S. equities posted similar underperformance rates: more than 90% of such active funds underperformed the S&P 500 over the 10-year period ending on Dec. 31, 2023.

3. The S&P 500 Equal Weight Index has been a popular strategy recently. What are the drivers behind this?

A notable trend in U.S. equities over the past year has been the outperformance of some of the largest companies as investors expressed their views on the potential impact of artificial intelligence on companies’ growth prospects. Against this backdrop, the representation of mega-cap companies in the S&P 500 reached multi-decade highs: the cumulative weight of the largest five companies in the S&P 500 was 25.3% at the end of March 2024—a level that has not been seen since December 1970. 

Although elevated stock-level concentration demonstrates that the S&P 500 continues to meet its stated objective of measuring the performance of large-cap U.S. equities, many investors have turned to an equal weight approach to reduce exposure to the largest names and to express views on mean reversion in equity market concentrations.

The relevance of the S&P 500 Equal Weight Index in these considerations comes from its smaller size exposure: assigning egalitarian allocations to the S&P 500’s component companies on a quarterly basis means that the equal weight index has less weight in the largest names. This methodology helped to explain most of the S&P 500 Equal Weight Index’s relative performance versus the S&P 500 over the past year, and it provides a tangible link between changes in market concentration and the equal weight index’s relative returns.

Typically, when the largest companies (to which equal weight has less sensitivity) outperformed, concentration rose, and equal weight underperformed its cap-weighted benchmark. Conversely, outperformance among smaller companies (to which equal weight has greater exposure) led to reduced concentration and greater likelihood of equal weight outperformance.

Exhibit 1: Weight of Largest Five S&P 500 Companies and Cumulative Relative Total Returns for the S&P 500 Equal Weight Index Versus the S&P 500

pdf-icon PD F Download Full Article

The iBoxx USD Liquid Emerging Markets Sovereigns & Sub-Sovereigns: A New Tool for the Emerging Market Bond Ecosystem

Contributor Image
Catalina Zota

Associate Director, Fixed Income Product Management

S&P Dow Jones Indices

Contributor Image
Nicholas Godec

Senior Director, Head of Fixed Income Tradables & Private Markets

S&P Dow Jones Indices

Executive Summary

The iBoxx USD Liquid Emerging Markets Sovereigns & Sub-Sovereigns index tracks the performance of U.S. dollar-denominated bonds from sovereign and sub-sovereign issuers in emerging markets.  The index provides a broad measure of emerging market bonds while adhering to stringent liquidity criteria.  The index could serve as a basis for tradable products such as futures, total return swaps (TRS) and exchange-traded funds (ETFs).

Debt issued by sovereign and sub-sovereign issuers with a notional amount of at least USD 1 billion and at least one year to maturity from rebalance date are eligible for entry.  Similarly to the benchmark, the index uses the IHS Markit Global Economic Development Classification Methodology to catalogue a country as emerging or developed.  Except for the Gulf Cooperation Council (GCC) members, regions with a Global National Income (GNI) per capita higher than two times the World Bank GNI high income cut-off during the past five years are excluded.  The index uses a novel country capping methodology, reviewed annually in December.  

The capping is based on two variables: 1) the average country weight, defined as one divided by the number of countries in the index; and 2) weight-based capping defined as three times the average country weight, rounded to the nearest 2.5%. Exhibit 1 illustrates how the capping methodology was applied starting Dec. 31, 2023.  The 7.5% capping became effective in January 2024.

The iBoxx USD Liquid Emerging Markets Sovereigns & Sub-Sovereigns: A New Tool for the Emerging Market Bond Ecosystem: Exhibit 1

The index uses bid-side pricing; however, new securities are included at the ask price.  Coupons are reinvested at the end of the month and the index is rebalanced monthly, on the last business day.  The index excludes floating rate bonds.

The oldest benchmark in the market is J. P. Morgan’s Emerging Markets Bond Index Global Core (EMBIG CORE), which is based on J. P. Morgan’s EMBI Global.  The EMBIG CORE tracks liquid, U.S. dollar-denominated, emerging market fixed and floating rate bonds issued by sovereign and quasi-sovereign entities.  The main differences between the iBoxx USD Liquid Emerging Markets Sovereigns and Sub-Sovereigns and the J. P. Morgan EMBI Global are outlined in Exhibit 2.

The iBoxx USD Liquid Emerging Markets Sovereigns & Sub-Sovereigns: A New Tool for the Emerging Market Bond Ecosystem: Exhibit 2

pdf-icon PD F Download Full Article

FAQ: S&P Dow Jones Indices’ June 2024 Quarterly Rebalance of the Technology Select Sector Index

Company Background

S&P Dow Jones Indices (S&P DJI) is home to iconic financial market indicators, such as the S&P 500® and the Dow Jones Industrial Average® and is the largest global resource for essential index-based market concepts, data, and research.

Today, S&P DJI offers an extensive range of indices and index-based solutions to address varying performance objectives. These include the Select Sector Index Series, which is designed to track major economic sectors, such as Information Technology.

1. What is the Technology Select Sector Index? All components of the S&P 500 are assigned to 1 of the 11 Select Sector Indices, which track major economic segments and are highly liquid benchmarks. Stock classifications are based on the Global Industry Classification Standard (GICS®).

The Technology Select Sector Index is part of the Select Sector Index Series and is governed by the S&P U.S. Indices methodology. Per the methodology document, capping is applied to ensure diversification among companies within each index.

Further, S&P Dow Jones Indices initiated calculation of the Select Sector Indices as of Jan. 28, 2011. The Technology Select Sector Index was launched on Dec. 16, 1998. Prior to that date, the indices were calculated by affiliates of the New York Stock Exchange. Total return versions of the Select Sector Indices were launched on Jan. 28, 2011, with a launch value of 1000.

2. How is the Technology Select Sector Index constructed? As mentioned, the Technology Select Sector Index is part of the Select Sector Index Series and is governed by the S&P U.S. Indices methodology. The Technology Select Sector Index comprises all S&P 500 companies that are classified as Information Technology companies under the GICS framework. The assignment of companies under the GICS framework is outlined in the GICS methodology.

The Select Sector Indices are rebalanced quarterly after the close of the third Friday in March, June, September and December. The Select Sector Indices also employ a secondary rebalancing check on the second-to-last business day of March, June, September and December.

Each index within the Select Sector Index Series is capped market-capitalization weighted.

3. Why does the Select Sector Index Series use a capping mechanism?  Capping is applied to ensure diversification among companies within each index. The capping thresholds defined in the Select Sector weighting section of the S&P U.S. Indices methodology document are intended to reflect certain diversification requirements imposed on regulated investment companies under the United States Internal Revenue Code (the “Code”) and the Investment Company Act of 1940 (the “40 Act”).

For more information on the capping thresholds, please refer to the Regulatory Capping Requirements section of S&P Dow Jones Indices’ Equity Indices Policies & Practices Methodology.

pdf-icon PD F Download Full Article

Processing ...