IN THIS LIST

A Look into the iBoxx ABF Pan-Asia

Impactful Short Duration: Green Bonds and Yield Curve Strategies

TalkingPoints: Assessing the Impact of 20 Years of SPIVA

Exploring Korean Dividend Opportunities

Measuring Board Gender Diversity across S&P ESG Indices

A Look into the iBoxx ABF Pan-Asia

Contributor Image
Kangwei Yang

Director, Fixed Income Indices

S&P Dow Jones Indices

Contributor Image
Jessica Tan

Principal, Fixed Income Indices

S&P Dow Jones Indices

Introduction

Launched in 2005, the iBoxx Asian Bond Fund (ABF) Pan-Asia is the official benchmark for the Asian Bond Fund 2 (ABF2) initiative of the Executives’ Meeting of East Asia-Pacific (EMEAP) central banks.  The initiative was set up to promote the development of local currency bond markets in the region through investments into nine passive local currency bond funds.  One of the key objectives of the ABF2 initiative was to provide a cost-effective means of accessing local bond markets to encourage market participation, including the attraction of foreign investment into the region.  Another goal of the initiative was to raise investor awareness of the (then) relatively new asset class—and general interest in Asian bonds.

As an index with limited exposure to credit risk, the iBoxx ABF Pan-Asia is made up of local currency-denominated sovereign and sub-sovereign debt from eight Asian markets, namely China, Hong Kong, Indonesia, Malaysia, Singapore, South Korea, Thailand and the Philippines.

Since inception, the index and the underlying markets have undergone significant changes.  In this paper, we will highlight some of the key developments and provide insights into notable changes in the index methodology since its launch in 2005.  We will also take a closer look at the performance and demand for Asian local currency bonds in recent years, as well as how Asian bonds could benefit investors in a diversified global portfolio.

Market Development

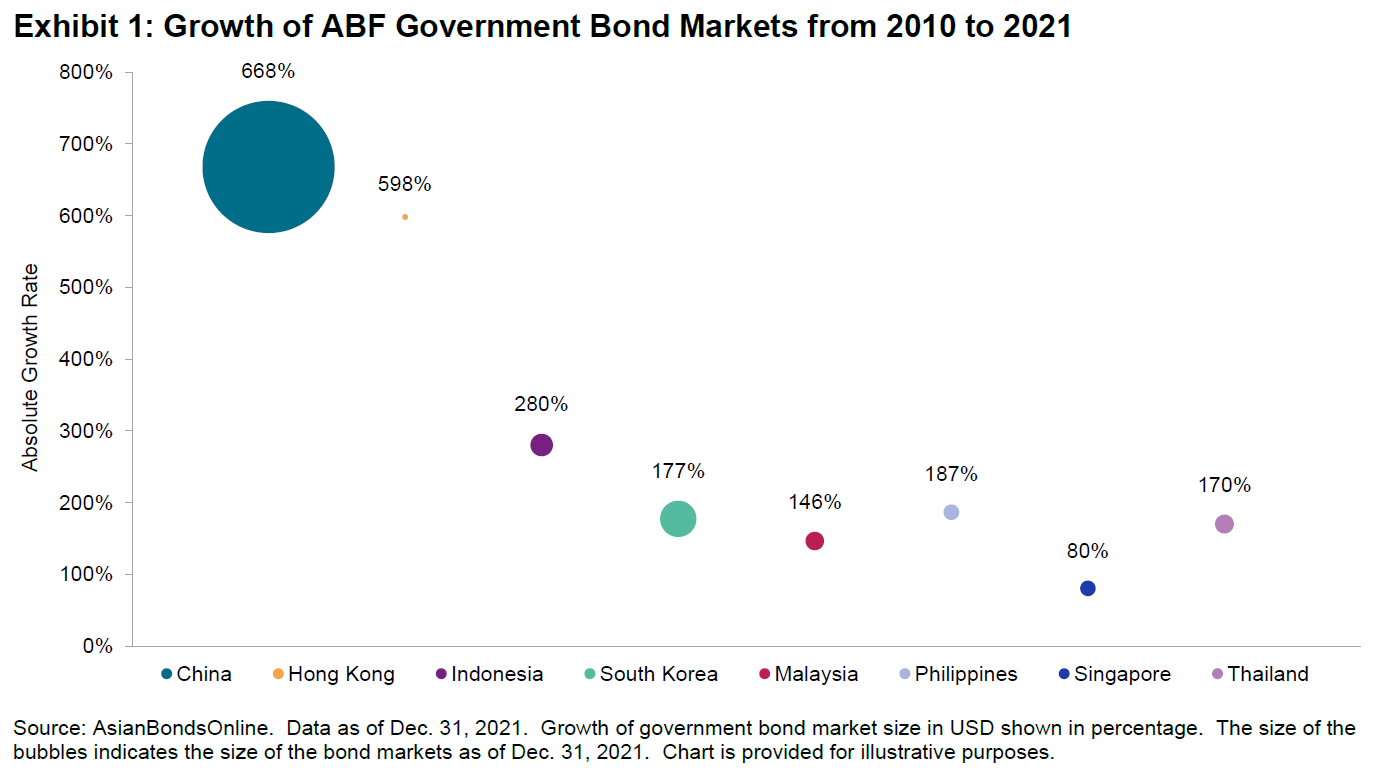
The size of the local government bond markets in the iBoxx ABF Pan-Asia grew at a compound annual growth rate (CAGR) of 16.2% since 2010.  Growth rates between individual bond markets differed, which underscored the disparity across the iBoxx ABF Pan-Asia economies in terms of their development, financial reform, trade dependency and market maturity, as well as the supply and demand of local government debt.

As shown in Exhibit 1, among the eight markets in the index, China registered the fastest growth rate (668%) over the 12-year period ending Dec. 31, 2021, while Singapore logged the slowest growth, at 80%.  In the same period, the Hong Kong government bond market expanded at a pace of 598%, but it still remained the smallest in U.S. dollar terms among the ABF markets.  Notably, after growing at a CAGR of 9.2% as compared with Singapore’s 5.0% over the same time span, the size of the Philippines government bond market (USD 159.0 billion) marginally exceeded that of Singapore (USD 158.9 billion) as of Dec. 31, 2021.

A Look Into the Iboxx ABF Pan-Asia: Exhibit 1

pdf-icon PD F Download Full Article

Impactful Short Duration: Green Bonds and Yield Curve Strategies

Contributor Image
Paulina Lichwa-Garcia

Associate Director, Fixed Income Indices

S&P Dow Jones Indices

In Search of Impact

The rising interest rate cycle and growing importance of sustainability-oriented strategies have been at the forefront of the fixed income market this year.  Investors’ focus on sustainable investing has shown no signs of abating, despite the magnitude and speed of rate hikes.

One rapidly growing area in the sustainable finance space is green bonds, often referred to as impact finance.  They are defined by the use of their proceeds, which are to be used for specific projects to make a direct impact in an environmentally friendly way, as defined by the International Capital Market Association (ICMA).  The market at first was tapped by supranational borrowers such as the European Investment Bank and the World Bank, but now most issuers in this space are corporates (see Exhibit 1).

Impactful Short Duration: Green Bonds and Yield Curve Strategies: Exhibit 1

pdf-icon PD F Download Full Article

TalkingPoints: Assessing the Impact of 20 Years of SPIVA

Contributor Image
Tim Edwards

Managing Director and Global Head of Index Investment Strategy

S&P Dow Jones Indices

Contributor Image
Craig Lazzara

Managing Director, Index Investment Strategy

S&P Dow Jones Indices

  1. What is SPIVA® and why did S&P DJI start putting these reports out 20 years ago?


    Tim: “SPIVA” stands for “S&P Indices Versus Active,” and it is the name for a regular series of research reports that compare the performances of actively managed funds to appropriate benchmarks. The primary role of the SPIVA Scorecards is to help inform a sometimes unfortunately noisy debate over the relative merits of active and passive investing. The scorecards do this by providing data on where (and when) actively managed funds have been performing well (or poorly), over both short- and long-term horizons, in various markets around the world—as well as offering a range of deeper statistics and analysis on active fund performance. 

  1. How do we ensure that the SPIVA report isn’t biased considering it’s coming from an index provider?

    Tim: One important thing to mention is that we don’t just publish the results when they suit us, instead sticking to a predetermined calendar (which is in most cases semiannual). There have been, and perhaps will be again, years when a majority of actively managed U.S. equity funds outperformed the S&P 500®. We’ll report it when they do. More generally, the SPIVA Scorecards frequently acknowledge outperformance in individual fund categories: particularly over short-term horizons, there are usually plenty of examples to be found in the range of global reports. I’d add that, from a practical perspective, the scorecards are based on publicly available data, with a fully disclosed methodology—an interested third party can check our results, and sometimes they do.

    Craig: Any analytic effort, SPIVA included, is no better than the data on which it is based, and we source our data carefully. But ours is by no means the first or only study to examine similar data and reach similar conclusions. The first study of active management versus indices of which we’re aware was published 90 years ago. Its conclusion would sound familiar to any reader of our current SPIVA reports: “Statistical tests of the best individual records failed to demonstrate that they exhibited skill, and indicated that they more probably were results of chance.”


  2. How has the report evolved over the past 20 years?


    Craig: SPIVA has broadened its coverage considerably. Our first SPIVA report was U.S.-centric, and it covered only 12 comparison categories (large-, mid- and small-cap; growth, value, blend and all styles). Since then, SPIVA has expanded to 9 different geographies, and now reports on the performance of over 100 different active fund categories around the world. 

pdf-icon PD F Download Full Article

Exploring Korean Dividend Opportunities

Contributor Image
Jason Ye

Director, Factors and Thematics Indices

S&P Dow Jones Indices

Contributor Image
Izzy Wang

Senior Analyst, Factors and Dividends

S&P Dow Jones Indices

Introduction

In the paper Analyzing High Dividend Yield Strategy in Korea, we studied the Korean dividend market and concluded that a portfolio formed by Korean high-dividend yield stocks has historically outperformed the broad market portfolio.  In this paper, we will introduce how practitioners can track opportunities from high dividend strategies in the Korean market through an indexing approach.

The Importance of Dividends

Dividend can be critical in equity investments for three reasons: 1) dividends are a significant source of total returns in the equity market; 2) dividend strategies can serve as an alternative for income-generating investors; and, 3) dividends as a factor have historically generated excess total returns in empirical research.

Dividend Contribution to Total Returns

In the U.S., dividends and dividend reinvestment accounted for over one-third of S&P 500® total return since 1936.  Exhibit 1 shows the breakdown of market total returns into price return and return from dividends and dividend reinvestment.  Globally, over 25% of total returns in the past 10 years came from dividends and dividend reinvestment.  In Korea, return from dividends and dividend reinvestment contributed to nearly one-half of the total returns of the Korean equity market in the past decade.

Exploring Korean Dividend Opportunities: Exhibit 1

pdf-icon PD F Download Full Article

Measuring Board Gender Diversity across S&P ESG Indices

Introduction

According to numerous studies,1 having a gender-diverse board is a key indicator of good corporate governance.2  The gender diversity of a board of an investee company is also one of the mandatory sustainability indicators3  that financial market participants are required to assess and report on under the EU’s Sustainable Finance Disclosure Regulation (SFDR).4  Using the S&P Global SFDR dataset,5  we examine this metric in the context of the S&P ESG Indices.

First, we observe how the proportion of women on boards varies across countries (see Exhibit 1).  On average, French firms have the most gender-balanced boards.  This is unsurprising, given that the French government enforces a minimum of 40% women on boards,6  a requirement that may follow across the EU.7  Meanwhile, all Qatari firms have an entirely male board.

Measuring Board Gender Diversity across S&P ESG Indices: Footnote

Measuring Board Gender Diversity across S&P ESG Indices: Exhibit 1

In terms of sectors, firms operating in Energy, Consumer Staples, Information Technology and Health Care have a greater-than-average number of women on their boards, while Materials has the lowest average (see Exhibit 2).

Measuring Board Gender Diversity across S&P ESG Indices: Exhibit 2

pdf-icon PD F Download Full Article

Processing ...