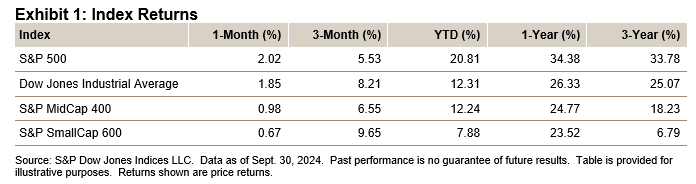
IN THIS LIST

U.S. Equities Market Attributes September 2024

iBoxx USD Emerging Markets Monthly Commentary: August 2024

Daily Index Insights

iBoxx USD Asia Ex-Japan Monthly Commentary: August 2024

iBoxx Asian Local Currency Indices Monthly Commentary: August 2024

U.S. Equities Market Attributes September 2024

Contributor Image
Howard Silverblatt

Senior Index Analyst, Product Management

S&P Dow Jones Indices

Key Highlights

Index Returns - U.S. Equities September 2024: Exhibit 1

Market Snapshot

Expectations were low for September, as the month with the worst track record (averaging -1.16% per month since 1926 for the S&P 500) started off with the worst week, down 4.25%, since March 2023 (-4.55%).  The Street’s motto for September then became “plan for the worst and pray that it won’t be that bad.”  But a funny thing happened on the way to the bear—nothing. The economy continued on, inflation was under control, the Fed delivered a 0.50% rate decrease, with two 0.25% decreases expected later this year, and the feared yen carry trade issue was not spoken of again. Additionally, Q2 2024 earnings officially set a record (while sales fell 0.3% short of one), with more earnings records expected for Q3 and Q4, and even China chipped in at the end of the month (and will need to continue to do so to achieve its goals of supporting real estate and encouraging consumer spending), which also helps to ensure low-cost U.S. supplies. The result was five new closing highs (43 YTD), with the index closing at one of those highs (5,762.48), with The Dow® posting seven new closing highs (33 YTD), and also closing at one of them (42,330.15). The S&P 500’s year-end target price rose (6,000; 4.1% away), along with gold, and both gasoline and energy stocks fell. For the month, the index posted a satisfying 2.02% gain (2.14% with dividends) and was up 20.81% YTD (22.08%). All was well at Broad and Wall, as brokers sent out quarterly statements showing the S&P 500 was up 34.38% (36.35%) over the past year. Optimism was alive and well on the Street, and no one wanted to talk about any potential gloom and doom ahead.

The S&P 500’s market value increased USD 1.263 trillion for the month (up USD 1.059 trillion last month) to USD 48.701 trillion and was up USD 8.662 trillion YTD; it was up USD 7.906 trillion for 2023 and down USD 8.224 trillion in 2022.

The Dow Jones Industrial Average set seven new closing highs in September (33 YTD), as it traded (and closed) above 42,000 (42,330.15 closing high and 42,628.32 intraday high), after setting four new closing highs in August and three in July. For the month, The Dow closed at 42,313.00, up 1.85% (1.96% with dividends) from last month’s close of 41,563.08, when it was up 1.76% (2.03%) from the prior month’s close of 40,842.79 (4.41%, 4.51%).  For the three-month period, The Dow was up 8.21% (8.72%), as the YTD period was up 12.31% (13.93%).  The one-year return was 26.33% (28.85%), 2023 was up 13.70% (16.18%) and 2022 posted a decline of 8.78% (-6.86% with dividends).

Target prices continued up, as the S&P 500’s one-year Street consensus target price increased for the 10th consecutive month to 6,265, an 8.7% gain (10.4% last month) from the current price and up from last month’s 6,238 (6,119 the month before that), after declining for 2 consecutive months, which followed 11 consecutive months of gains (which was after 9 consecutive months of declines). The Dow target price also increased for the 10th consecutive month to USD 44,468, a 5.1% gain (6.5% last month) from now (44,282, 44,097), after two consecutive months of declines, which was after three consecutive months of gains.

The second U.S. presidential debate, this time between Vice President Kamala Harris and Republican nominee Donald Trump (the prior one was between President Joe Biden and Trump) produced no clear victor, but the consensus was that Harris won the debate.  No additional debates between Harris and Trump have been arranged; the Harris campaign wanted one but the Trump campaign didn’t.  A second assassination plan on Trump was stopped prior to the attempt, with no incident. Congress passed (both the House, 341-82, and Senate, 78-18) and the president signed a short-term government funding bill, avoiding a potential shutdown starting Sept. 30, 2024; the funding is through Dec. 20, 2024.

pdf-icon PD F Download Full Article

iBoxx USD Emerging Markets Monthly Commentary: August 2024

Contributor Image
Catalina Zota

Associate Director, Fixed Income Product Management

S&P Dow Jones Indices

August 2024 Commentary

Market Overview

August 2024 was an unseasonably active month for the markets.  On August 5, the Nikkei 225—Japan’s benchmark index—suffered a collapse of 12%, the largest single-session drop since Black Monday in 1987.  This sent chills throughout global markets, with the S&P 500® dipping 3% on the same day, while the Dow Jones Industrial Average® fell 2.6%.  The CBOE Volatility Index (VIX®) had its largest one-day spike in history at 65.7 intraday, closing at 38.57, 15.18 above its previous day close.  The “culprit” was the “yen carry trade” triggered by Bank of Japan’s historic interest rate hike of 0.25%. 

In the U.S., on August 2, the Bureau of Labor Statistics released the unemployment rate, which rose to 4.3%,1 while non-farm payrolls increased by only 114,000, a sharp slowdown from previous months.  The second release from the Bureau of Economic Analysis confirmed that U.S. GDP increased at an annual rate of 3%2 in Q2 2024, while Q1 2024 GDP growth was revised from X% to 1.4%.  The CPI rose by 0.2%3 on a seasonally adjusted basis, after a decline of 0.1% in June.  Considering these statistics, the U.S. Federal Reserve is widely expected to make its first interest rate cut in September.

In other markets, a slowing economy triggered Mexico’s central bank to cut its interest rate by 25 bps in early August, bringing its key rate to 10.75%.  Mexico’s GDP was revised down to 0.8%4 on an annualized basis; exports declined to 0.6% month-over-month; and inflation increased to 5.6%.  In the eurozone, inflation decreased to 2.2%5 in August, down from 2.6% in July.  India’s HSBC Manufacturing PMI is one of the key indicators of economic output for emerging markets; this month, it was 57.5,6 down from July’s reading, signaling an overall softness in economic growth.

pdf-icon PD F Download Full Article

Daily Index Insights

Contributor Image
Benedek Vörös

Director, Index Investment Strategy

S&P Dow Jones Indices

“Silence is of the gods; only monkeys chatter.”

        Buster Keaton (October 4, 1895 - February 1, 1966)   


141 years ago today, the “Orient Express” departed on its maiden journey from Paris to Istanbul.  Its glamour and exotic route has frequently lent itself to the plot of films and books, including detective fiction and (a firm favorite on this desk) an absolutely ripping investigation into the culprits for the “crime” of institutional investment underperformance.  Steaming into your inbox, here is your daily dashboard. 

  • The S&P 500® was little changed, slipping just 0.2% on the day.  Energy stood out among large cap segments, up 1.6%, while Consumer Discretionary continued to lag, down 1.3%.  The U.S. bellwether has been searching for direction for a while now, with yesterday the 10th sub-1% move in a row.  That may change today, as a surprise in either direction in September U.S non-farm payrolls, due at 8:30a.m. New York, may result in outsized moves in equities, fixed-income and currency markets. 

        Last Week Leaders & Laggards: S&P 500 Sectors & Factors

  • Apart from economics, geopolitics also remains a worry as the situation in the Middle East continues to be fluid.  Traders betting on potential disruptions in oil flows have been bidding up oil prices, with oil related indices taking all the podium spots on the daily global indices leaderboard on page 2 of our dashboard with gains of around 5%. 

 Last Week Leaders & Laggards: S&P 500 Sectors & Factors

  • Over on Indexology®, Anu Ganti highlights how various segments of the S&P DJI ecosystem has benefited from the network effects of liquidity offered by market participants operating on a wide range of trading frequencies, resulting in a creative cacophony of perspectives.   

                                    Last Week Leaders & Laggards: S&P 500 Sectors & Factors

  • And finally, a real treat for index geeks, Howard Silverblatt’s monthly U.S. equity report, jam packed with statistics ranging from recent index returns to changes in EPS and P/E ratios, was also released this week; read his thoughts here

 Last Week Leaders & Laggards: S&P 500 Sectors & Factors

pdf-icon PD F Download Full Article

iBoxx USD Asia Ex-Japan Monthly Commentary: August 2024

Contributor Image
Jessica Tan

Principal, Fixed Income Indices

S&P Dow Jones Indices

Featuring iBoxx USD Asia-Pacific

August 2024 Commentary

Cooler inflation numbers globally have led to more central banks shifting toward monetary easing for their respective economies.  Citing a slowdown in the labor market and progress made toward restoring price stability, the U.S. Federal Reserve (Fed) indicated that they are on track to cut interest rates.  In Europe, central banks in Sweden and the Czech Republic have already lowered their policy rates several times in 2024.  In Asia-Pacific, the central banks of New Zealand and the Philippines have joined the camp of central banks to lower their key policy rates ahead of the Fed.

The U.S. dollar weakened against most Asian currencies in August, except for the Indian rupee.  Both the Malaysia ringgit and Indonesia rupiah strengthened at least 5% against the dollar.  The depreciation of the dollar has clawed back most of the currency gains it had on Asian currencies in the first half of the year.

10-year U.S. Treasury yields—as represented by the iBoxx USD Treasuries Current 10-Year—dropped by 13 bps to 3.96%.  This is their fourth consecutive positive month and their longest streak since 2021.  At the start of the month, the S&P 500® dipped to May 2024 levels after recession fears struck the market, but it recovered to near all-time high levels after U.S. consumer spending was reported to have increased in July with moderate inflation numbers.  The index closed the month up 2.28% and at 18.42% YTD.

The People’s Bank of China (PBoC) left rates unchanged after their recent move in July.  Chinese-issued U.S. dollar bonds—as represented by the iBoxx USD Asia ex-Japan China—were up 1.18%, while Chinese stocks—as represented by the S&P China 500 (USD)—were down 0.55%, bringing their YTD return to -1.10%.

iBoxx USD Asia Ex-Japan Monthly Commentary: Exhibit 1

The Asian U.S. dollar bond market ended the month with a 1.18% gain, supported by a 1.25% gain in investment grade bonds and a 0.74% rise in the high yield segment.  China Real Estate, which has been one of the best-performing segments since March, was one of the weaker-performing segments in August despite a gain of 0.02%.  Nevertheless, for the one-year period, the China Real Estate segment gained 23.91%.  The APAC ex-China U.S. dollar bond market outperformed the Asian U.S. dollar bond market by 9 bps in August.

All rating and maturity segments rallied this month, except for the CCC buckets.  The tides changed after seven consecutive months of high yield segments outshining their investment grade counterparts.  Investment grade bonds outperformed high yield bonds by 51 bps in August.  Sovereigns bonds, which make up 15% of the overall index, also outperformed non-sovereign bonds by 83 bps.  Across most rating and maturity segments, the longer end of the curve outperformed the shorter end.  Year-to-date, high yield bonds returned 12.35%, while investment grade bonds trailed, posting 4.29%.

pdf-icon PD F Download Full Article

iBoxx Asian Local Currency Indices Monthly Commentary: August 2024

Contributor Image
Kangwei Yang

Director, Fixed Income Indices

S&P Dow Jones Indices

Monthly performance, maturity, yield and duration of the iBoxx ALBI, iBoxx ABF and iBoxx SGD Indices.

Toward the end of August, the 10-2 Year Treasury Yield Spread turned positive for the first time in more than two years, and it ended the month flat at 0 bps, potentially signaling a shift in market sentiment on the upcoming U.S. interest rate policy.  As U.S. annual inflation dipped below 3% for the year ending July 2024, investor attention is turning toward the upcoming FOMC meeting in mid-September with rising expectations of the first rate cut by the Fed since March 2020.

U.S. Treasuries—as represented by the iBoxx $ Treasuries—extended their gains in August, returning another 1.30%.  It is also noteworthy that longer-dated U.S. Treasuries (iBoxx $ Treasuries 10Y+, up 2.00%) outperformed shorter-dated ones (iBoxx $ Treasuries 1-3Y, up 0.90%).  To round things off in the U.S., on the equities front, the S&P 500® inched up 2.28% in August against the backdrop of a potential rate cut and gains in the Technology sector, shaking off a global stock market rout earlier in the month.

In Asia-Pacific markets, New Zealand and the Philippines dropped their official cash rate and key rate, respectively, by 25 bps in August.  New Zealand government bonds—as represented by S&P/NZX NZ Government Bond Index—rose 0.97% in August (in local currency terms), while Philippine government bonds—as represented by the iBoxx ALBI Philippines—returned 0.86% (in local currency terms).

iBoxx Asian Local Bond Index (ALBI)

iBoxx Asian Local Currency Indices: Monthly Commentary: Exhibit 1

Asian local markets—as represented by the iBoxx Asian Local Bond Index (ALBI)—performed well in August, returning 4.06% in USD unhedged terms.  Most local markets contributed to the returns, which was also boosted by the weakness of the U.S. dollar against domestic currencies.  The Malaysian ringgit and the Indonesia rupiah both appreciated more than 5% against the greenback.  In the past 12 months, the overall index (in USD unhedged terms) has returned 8.90%.

Looking at single market performance in August, Indonesia and Singapore stood out, returning 2.22% and 1.48%, respectively.  For the second month running, Singapore was among the top two markets in the index.  South Korea, the top performer in July, fell to the bottom as it was the only market with a slightly negative return (down 0.08%).

Returns were largely positive for the second straight month across the yield curve, with only certain pockets showing small declines, namely South Korea 10Y+ (down 0.53%) and China Onshore 7-10Y (down 0.21%).  Indonesia 10Y+ and Hong Kong 10Y+ were the top segments this month, returning 3.13% and 2.47%, respectively.

As of the end of August, the overall index yield contracted by another 5 bps to 3.69%.  India continued its position as the highest-yielding bond market, posting 6.94%, while China Onshore (2.14%) remained the lowest-yielding market.


pdf-icon PD F Download Full Article

Processing ...