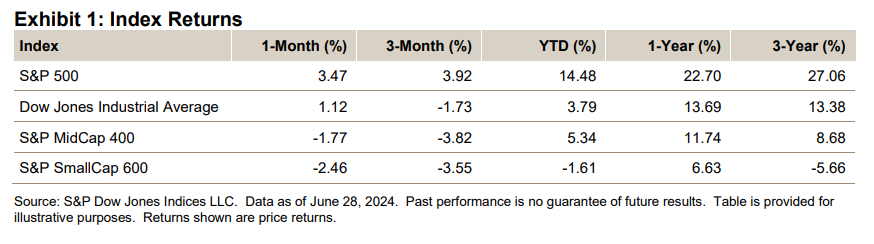
IN THIS LIST

U.S. Equities Market Attributes June 2024

iBoxx USD Asia Ex-Japan Monthly Commentary: May 2024

iBoxx USD Emerging Markets Monthly Commentary: May 2024

iBoxx Asian Local Currency Indices Monthly Commentary: May 2024

U.S. Equities Market Attributes May 2024

U.S. Equities Market Attributes June 2024

Contributor Image
Howard Silverblatt

Senior Index Analyst, Product Management

S&P Dow Jones Indices

Key Highlights

Index Returns - U.S. Equities June 2024: Exhibit 1

Market Snapshot

June continued the S&P 500’s 2024 gains, with the index posting 7 new closing highs and bringing its YTD total to 31.  The index was up 3.47% for the month (3.59% with dividends) on negative breadth (201 up and 301 down).  This came after May’s broad gain of 4.80% (4.96%) and April’s broad, but limited, pullback (-4.16%, -4.08%), which seems to have become a distant memory.  The 500™ posted a gain of 3.92% for Q2 2024 (4.28%), but (again) breadth was negative (199 down and 304), as the index remained top heavy.  Not that Q1 2024 wasn’t top heavy, but that quarter’s broad gain of 10.16% (10.56%) saw strong positive breadth of 369 up and 134 down.  Year-to-date, the index’s return was 14.48% (15.29%), which annualizes to a 31.18% (33.05%) rate, with breadth positive at 301 up and 200 down (May YTD was 312 up and 189 down).  June posted gains for 12 of its 19 trading days (14 of 22 last month; 69 of 124 YTD).  Of the 11 sectors, 5 were up (10 up last month), while breadth became negative; trading increased 1% (adjusted for days) over May and was down 4% over June 2023.

The S&P 500’s market value increased USD 1.546 trillion for the month (up USD 2.063 trillion last month) to USD 45.843 trillion and was up USD 5.804 trillion YTD; it was up USD 7.906 trillion for 2023 and down USD 8.224 trillion in 2022.

The Dow Jones Industrial Average did not set a new high in June, as it closed at 39,118.86, up 1.12% (1.23% with dividends) from last month’s close of 38,686.32, when it was up 2.30% (2.58%).  For Q2 2024, The Dow® was down 1.73% (-1.27%), while it was up 3.79% (4.79%) YTD.  The one-year return was 13.67% (16.02%), 2023 was up 13.70% (16.18%) and 2022 posted an 8.78% decline (-6.86%).

S&P 500 trading increased 1% (adjusted for trading days) for June, after being up 6% in May, and the year-over-year June trades were 4% lower relative to June 2023; the 12-month June 2024 volume was 6% lower than the prior 12-month period.  The 2023 trading volume was down 1% over 2022; 2022 posted a 6% increase over 2021.

The S&P 500 closed at 5,460.48 (reaching a closing high of 5,487.03), up 3.47% (3.59% with dividends) from May’s close of 5,277.51, when it was up 4.80% (4.96%) from April’s 5,035.69 close (-4.16%, -4.08%).  The Q2 three-month gain was 3.92% (4.28%), bringing the 2024 YTD return to 14.48% (15.29%).  The one-year period was up 22.70% (24.56%), the 2023 return was up 24.23% (26.29%) and the 2022 return was -19.44% (-18.11%).

Target prices continued up, as the S&P 500’s one-year Street consensus target price increased for a seventh month to 5,972, a 9.4% gain (11.6% last month) from the current price and up from last month’s 5,890 and 5,766 the month before that, which followed 11 consecutive months of gains (which was after 9 consecutive months of declines).  The Dow target price also increased for the seventh month, after two consecutive months of declines, which was after three consecutive months of gains, to USD 43,158, a 10.3% gain (12.0%) from now (42,955, 42,808).

The Federal Reserve said all 31 big banks passed their annual stress test, which included a simulation of a 10% U.S. unemployment rate, a 32% decline in housing prices and a 40% drop in commercial real estate.  After the end of the month, the banks started to announce their intent to increase their dividends, as well as update their share repurchase program.

OPEC+ (Organization of the Petroleum Exporting Countries and other countries, including Russia) extended its production cuts (which started in Q4 2022) of 5.86 million barrels a day (5.7% of global production) into 2025, although it was not clear at what level the cuts may be set.

The Congressional Budget Office (CBO) raised its federal budget deficit forecast for fiscal 2024 from USD 1.6 trillion (February 2024) to USD 2 trillion, citing USD 300 billion in extra spending (mostly due to reducing student loan balances), as corporate taxes were below expectations.  The CBO also reported that federal interest payments for Q1 2024 (USD 1.059 trillion) surpassed spending on defense (USD 1.030 trillion), as interest costs were seen as still increasing.

pdf-icon PD F Download Full Article

iBoxx USD Asia Ex-Japan Monthly Commentary: May 2024

Contributor Image
Kangwei Yang

Director, Fixed Income Indices

S&P Dow Jones Indices

May 2024 Commentary

On June 6, 2024, the European Central Bank (ECB) announced an anticipated first interest rate cut, with a 25 bps drop to 3.75%.  Other central banks have also made moves to lower their key rates in May, including Sweden, Czech Republic and Brazil.  The only change in Asia came from Mongolia (down 100 bps to 11%). The FOMC will meet on June 11 and 12 to discuss its next course of action.

In the U.S., the S&P 500® gained 4.80% in May, recovering its losses from the prior month.  U.S. Treasuries—as represented by the iBoxx $ Treasuries—gained 1.51%, while its yield dropped by 19 bps to 4.71%.

In China, the first batch of CNY1 trillion  ultra-long-term special treasury bonds was issued this month; the proceeds of this bond will be used for some specific areas, including science and technology innovation and food and energy security.  At the same time, there were no changes to the loan prime rate in China, which was last changed in August 2023.  So far this year, China-issued U.S. dollar bonds—as represented by the iBoxx USD Asia ex-Japan China—gained 2.61%, with high yield bonds (10.37%) outperforming investment grade bonds (up 1.60%).  Chinese stocks—as represented by the S&P China 500 (USD)—were also up in May (0.64%), extending their gains from April.

iBoxx USD Asia Ex-Japan Monthly Commentary: Exhibit 1

It was positive month for Asian U.S. dollar bonds, with gains across most segments of the market.  The overall index clawed back its losses from April and ended the month gaining 1.48%.  High yield bonds (up 2.14%) outperformed their investment grade counterparts (up 1.37%) again.  Year-to-date, the disparity is even clearer, as Asian high yield bonds returned 8.30% compared to 0.60% from investment grade.  Within Asian U.S. dollar bonds, investors had a clear preference for credit over sovereigns thus far in 2024, as non-sovereigns gained 2.00% while sovereigns retreated 0.98%.

The China Real Estate segment continued its momentum from the past couple of months, and gained another 6.15% in May, while China local government financing vehicles (LGFVs) inched up by 0.60%.  Overall, China USD bonds gained 1.34% this month (and 5.04% over the past 12 months).

pdf-icon PD F Download Full Article

iBoxx USD Emerging Markets Monthly Commentary: May 2024

Contributor Image
Catalina Zota

Associate Director, Fixed Income Product Management

S&P Dow Jones Indices

May 2024 Commentary

Market Overview

The U.S economy has recently started to show signs of cooling off.  The Consumer Price Index increased 0.3% in April, after a 0.4% uptick in March.  On May 30, 2024, the Bureau of Economic Analysis report stated that real gross domestic product (GDP) for Q1 2024 increased at an annual rate of 1.3%, lower than the Q4 2023 real GDP growth of 3.6%.  The slowdown was influenced by decelerating consumer spending, exports, and state and local government spending.  Imports, however, were up for the quarter.  Another U.S. economic indicator is the Conference Board U.S. Leading Economic Index (LEI) which decreased 0.6 % in April, compared to a decrease of 0.3% in March.  The LEI paints an ample picture of the U.S economy by measuring 10 components such as PMI, weekly hours worked, unemployment applications, manufacturer’s new orders and building permits, among others.  The unemployment rate was 3.9% in April, based on a press release of the Bureau of Labor Statistics.

In May, the overnight repo rate, a measure of market liquidity, ranged between 5.25%-5.42%, changed little from April.  On the equities front, the S&P 500® was up 4.80% in May, led by Information Technology, Communication Services and Utilities.

Latin America has had a challenging year so far.  Mexico’s newly elected president, Claudia Sheinbaum, seems likely to continue Andrés Manuel López Obrador’s policies, perhaps shifting constitutional reforms further to the left with close to a parliamentary supermajority (two thirds of the seats) in the house and senate.  This adversely impacted the market, with the Mexican peso falling 4% after the election results.  In South America, Brazil’s GDP was up an estimated 0.8% in Q1 2024, with a 2.5% year-over-year increase according to the Brazilian Institute of Statistics (IBGE).  

In Europe, the Eurostat report released on May 31, 2024, stated that eurozone inflation was up 2.6% in May, a small jump from 2.4% in April, fueled by services, food, industrial goods and energy.  Lastly, in the Asian market, specifically India, the HSBC India Manufacturing PMI expanded at a lower rate when compared to previous months.  The index posted 57.5 in May from a high of 58.8 in April, influenced by decreased working hours and rising production costs.

pdf-icon PD F Download Full Article

iBoxx Asian Local Currency Indices Monthly Commentary: May 2024

Contributor Image
Kangwei Yang

Director, Fixed Income Indices

S&P Dow Jones Indices

Monthly performance, maturity, yield and duration of the iBoxx ALBI, iBoxx ABF and iBoxx SGD Indices.

In the coming days, the European Central Bank (ECB) and U.S. FOMC will meet to discuss the next course of action for their respective key benchmark rates, with widespread expectations for the first rate cut by the ECB at their upcoming meeting on June 6, 2024. Against this backdrop, eurozone government bonds—as represented by the iBoxx € Eurozone—pulled back 0.12% in May, while U.S. Treasuries—as represented by the iBoxx $ Treasuries— gained 1.51%.

At the end of May, the 10-2 Treasury Yield Spread, which measures the difference between the 10-year and 2-year U.S. Treasury yield, was -0.38%. This was the same figure as at the beginning of the year.

In the underlying markets represented in the iBoxx ALBI, iBoxx ABF and iBoxx SGD there were no movements in interest rates this month, after the surprise move by Bank Indonesia in April of increasing its seven-day reverse repo rate by 25 bps.

Over in the equities space, the U.S. market—as represented by the S&P 500®—gained 4.80% in May and 26.26% over the past 12 months. Stocks in the Asia-Pacific region were up as well this month but trailed the performance of U.S. equities. The S&P Pan Asia ExJapan LargeMidCap USD returned 1.64%, while the S&P China 500 (USD)—representing Chinese stocks—gained 0.64%.

iBoxx Asian Local Bond Index (ALBI)

iBoxx Asian Local Currency Indices: Monthly Commentary: Exhibit 1

The iBoxx Asian Local Bond Index (ALBI)—in USD unhedged terms—gained 1.07% in May as all underlying markets posted positive returns. Additionally, most local currencies (except the Philippine peso, South Korean won and Offshore RMB) appreciated against the U.S. dollar.

In local currency terms, India (up 1.58%), the Philippines (up 1.46%) and India (up 1.45%) were the standout performers, while Thailand (up 0.04%), China Onshore (up 0.40%) and China Offshore (up 0.52%) made up the bottom three, nevertheless delivering small gains.


Across the yield curve, the 10+ maturity segments drove most of the gains this month, especially the Philippines 10+ and Hong Kong 10+, returning 2.49% and 2.47%, respectively. China Offshore 10+ (down 0.85%) and Thailand 10+ (down 0.38%) were the only segments that saw
negative returns. The other maturity segments across markets were either flat or saw some uptick in May.


As of the end of May, the overall index yield contracted by another 6 bps to 4.06%. India remained the highest-yielding bond market in the index, posting 7.12%, while China Onshore (2.35%) represented the lowest-yielding market.


pdf-icon PD F Download Full Article

U.S. Equities Market Attributes May 2024

Contributor Image
Howard Silverblatt

Senior Index Analyst, Product Management

S&P Dow Jones Indices

Key Highlights

Index Returns - U.S. Equities May 2024: Exhibit 1

Market Snapshot

The S&P 500 recouped its April (-4.16%) decline and posted its 23rd new closing high of the year (5,308.15 on May 15, compared to the prior 5,254.35 high on March 28).  The S&P 500’s rise was steady, as it posted five weekly gains in a row (up 6.79%), breaking above the 5,300 level (reaching 5,325.49 on May 16), as it went on to post another closing high (its 24th YTD, 5,321.41 on May 21).  For the last week of the month, however, it pulled back slightly (-0.51%) on what appeared to be profit-taking (with buying coming in on the afternoon of the last day of trading, turning a 0.84% loss into a 0.80% gain for the day), as it closed May at 5,277.51, up 4.80% (it had been up 5.67% during the month), more than making up for April’s 4.16% decline, and up 10.64% YTD (0.83% away from its closing high).  The Dow® also posted two new closing highs, first at 39,908.00 on May 15 and then at 40,003.59 on May 17 (its only close above 40,000; it reached 40,051.05 intraday), as it closed the month at 38,686.32, up 2.30% for the month and up 2.64% YTD.

For May, 10 of the 11 sectors increased, after 1 gaining last month and all 11 being up in March and February.  Information Technology did the best, up 9.95% for the month (up 16.93% YTD and up 30.00% from the 2021 close), while Energy did the worst and was the only negative sector, down 0.97% (up 10.62% YTD and up 67.49% from the close of 2021).

The S&P 500 closed at 5,277.51 (reaching a closing high of 5,321.41), up 4.80% (4.96% with dividends) from April’s 5,035.69 close, when it was down 4.16% (-4.08%) from March’s close of 5,254.35 (3.10%, 3.22%), as the 2024 YTD return was up 10.64% (11.18%).  For the three-month period, the index was up 3.56% (3.90%), as the one-year period was up 26.26% (28.17%), the 2023 return was up 24.23% (26.29%) and the 2022 return was -19.44%
(-18.11%).

For May, the S&P 500 posted 2 new closing highs, compared to none for April, 8 in March, 8 in February and 6 in January; it has set 24 new closing highs YTD, compared with none in 2023, 1 in 2022 and 70 in 2021 (the record highest, 1995, had 77).  The index was up 55.86% (66.90% with dividends) from its pre-COVID-19 Feb. 19, 2020, closing high.

Target prices continued up, as the S&P 500’s one-year Street consensus target price increased for a sixth month, after declining for two consecutive months, which followed 11 consecutive months of gains (which was after nine consecutive months of declines), to 5,890, an 11.6% gain (14.5% last month) from the current price and up from last month’s 5,766 (5,655 the month before that).  The Dow target price also increased for the sixth month, after two consecutive months of declines, which was after three consecutive months of gains, to USD 42,955, a 12.0% gain (13.2%) from now (42,808, 42,619).

The Biden administration announced new tariffs on USD 18 billion of goods from China, including quadruple tariffs on Chinese electric vehicles (to 100% from the current 25%) to protect U.S. manufacturers.  The increase is seen as having little impact, since few electric vehicles are imported to the U.S. from China.  Tariffs were also increased on medical supplies and solar supplies, as Biden extended the Section 301 Tariffs on Imports from China, which started in 2018 and covers USD 300 billion of Chinese products.

The U.S. FOMC met and as expected, left its rates unchanged.  The Fed said inflation has remained higher than hoped and that this may prolong higher interest rates.  The Fed also said it approved a plan to slow its USD 7.4 trillion balance sheet reduction by reinvesting maturing securities into new ones (it had been reducing its balance sheet USD 60 billion per month).

The FOMC minutes for the April 30-May 1, 2024, meeting (when it kept its interest rates unchanged at 5.25%) showed it was disappointed in the continued strength of inflation, and that it would take longer to be certain of when it would reach the 2% target.  It discussed measures to curb inflation, which would not include reducing interest rates.  The Fed’s Beige Book said the economy continued to slowly expand, but persistent inflation also continued, and it speculated that the economy was unlikely to further expand until inflation slowed.  The Federal Bank Reserve of Cleveland nominated former Goldman Sachs (GS) executive Beth Hammack (a current voting FOMC member) to be its new president, replacing Loretta Mester, who is retiring.

The Bank of England met and, as expected, voted (7-2) to keep its interest rates unchanged at 5.25%, while it indicated a June interest rate cut, with the Street expecting a 0.25% cut in June and another 0.25% reduction in 2024.  The minutes of the Royal Bank of Australia’s policy meeting (May 6-7, 2024, when it left interest rates unchanged at 4.35%) showed inflation returning under its forecast, as it discussed an interest rate increase.  Preliminary Q1 2024 U.K. GDP turned positive, up 0.6% for the quarter (0.4% expected), up from the -0.3% Q4 2023 reading, as the year-over-year rate was 0.2%, up from the prior -0.2%.

pdf-icon PD F Download Full Article

Processing ...