


Key Highlights
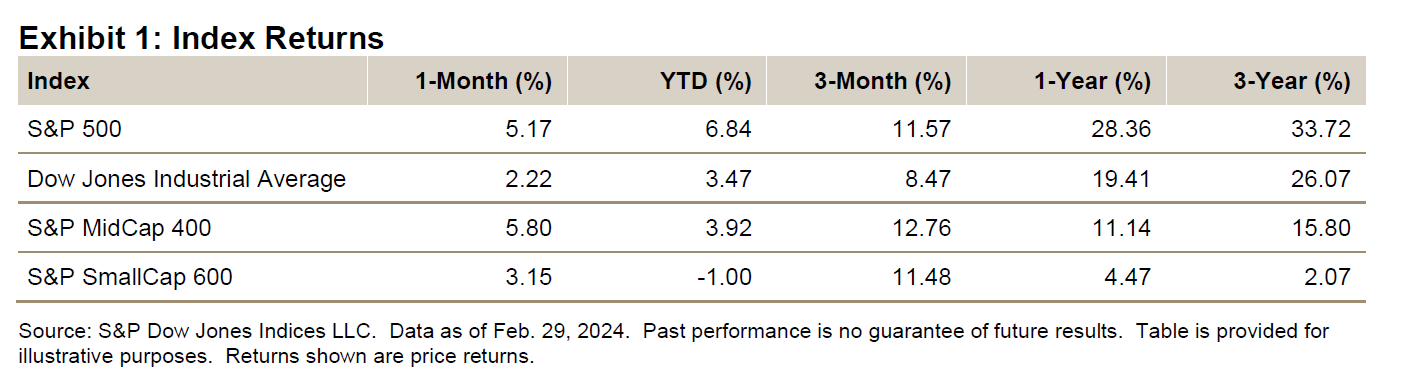
- The S&P 500® was up 5.17% in February, bringing its YTD return to 6.84%.
- The Dow Jones Industrial Average® rose 2.22% for the month and was up 3.47% YTD.
- The S&P MidCap 400® gained 5.80% for the month, bringing its YTD return to 3.92%.
- The S&P SmallCap 600® was up 3.15% in February and was down 1.00% YTD.
MARKET SNAPSHOT
Neither inflation nor Fed rates nor interest costs nor gloom of consumer and government debt (nor government shutdowns—seems we have more concerns than the saying has room for) stays these markets from the swift completion of their appointed new closing highs, as delivered by the S&P 500’s eight new closing highs in February (closing the month on one of them, at 5,096.27, though the intraday high was 5,111.06), after six in January. The Dow Jones Industrial Average has also posted closing highs—seven each in the month of February, January and December). For February, the S&P 500 broke through and traded above 5,000 for the first time, reaching above 5,100 as well, but leaving that close to another day. It posted its fourth month of broad gains, up 5.17% (5.34% with dividends), after January’s 1.59%, December’s 4.54% and November’s 8.92% (cumulatively 21.52%), which followed three months of losses (-8.61%). Year-to-date, the index was up 6.84% (7.11%), as the 2023 return was up 24.23% (26.29%), making up for 2022’s 19.44% decline; the one-year return was 28.36% (30.45%). The index was up 50.50% (60.64%) from its pre-COVID-19 Feb. 19, 2020, closing high.
All 11 S&P 500 sectors gained for February, compared with 5 for January and 10 in December (8 of 11 for 2023). Consumer Discretionary did the best, up 8.60% for the month (up 4.74% YTD and down 7.79% from the 2021 close), and Utilities did the worst, up 0.53% (down 2.55% YTD and down 13.75% from the close of 2021). Breadth improved (351 up and 151 down, compared with last month’s 224 up and 279 down), with YTD breadth turning positive (302 up and 201 down; for 2023, 322 issues were up and 179 down, a reversal of 2022’s 139 gainers and 363 decliners). February posted gains for 13 of its 20 trading days (11 of 21 last month), while trading increased 4% over January and was down 3% over February 2023.
The Magnificent 7 continued, although it appears to have become more of a one-company show, with Nvidia (NVDA) gaining 28.6% for the month (up 59.8% YTD and up 441% from the close of 2022) and representing 20% of the February total return for the S&P 500 and 26% YTD. Nvidia briefly traded above the USD 2 trillion mark, joining Microsoft (MSFT; USD 3.07 trillion) and Apple (AAPL; USD 2.64 trillion, with Nvidia at USD 1.95 trillion) as the dominating gang of three (making up 17.9% of the S&P 500; Alphabet’s two issues add up to USD 1.52 trillion and account for 3.5% of the index). So the trillion dollar question is—how long can it go on for? The answer may be found in the two days prior to its earnings and sales blowout release (which ended with the company posting a record USD 273 billion market gain that next day), when some took profits (-7% for two days) but got back in—because you have to be in it to win it. The run will continue as long as the market believes superior growth will continue.
