


Key Highlights
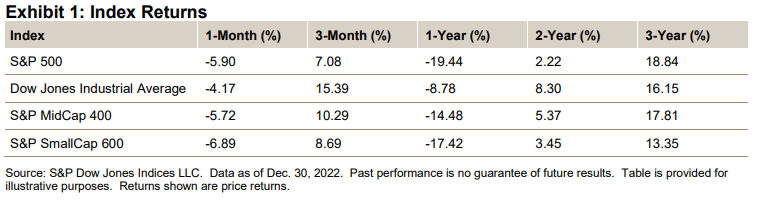
- The S&P 500® was off 5.90% in December, bringing its 2022 return to -19.44%.
- The Dow Jones Industrial Average® lost 4.17% for the month and was down 8.78% for 2022.
- The S&P MidCap 400® dropped 5.72% for the month, bringing its 2022 return to -14.48%.
- The S&P SmallCap 600® was down 6.89% in December and had a 2022 return of -17.42%.
Market Snapshot
For the S&P 500, 2022 was a difficult year, as the index was down 19.44%—its worst year since 2008's -38.49%. Energy was the only positive sector for the year, up 59.05%, while notably, Utilities was up 1.57% including dividends—I'm a dividend guy. Overall for the index, 139 issues gained (average 22.21%) and 363 were down (average -24.58%; for all issues, the average was -11.62%), again the worst since 2008, when only 25 issues were up (Family Dollar Stores was best, up 35.57%). Volatility was significantly higher, as 219 of the 251 trading days had at least a 1% intraday high/low spread, compared with 2021's 95, with 122 days moving at least 1% (59 up, 63 down), compared with 2021's 55 (34 up and 21 down). The intraday high/low spread for 2022 was 1.84% (the highest since 2009's 2.03%, as 2008 was 2.81%), compared with 2021's 0.97% (2019 was 0.85% and 2017 was a passive 0.51%— the lowest since 1962, when my data starts). On an aggregate basis, the S&P 500 lost USD 8.22 trillion (finishing the year at USD 32.215 trillion), with Information Technology down USD 3.49 trillion and Energy up USD 0.589 trillion.
While this year's market stats were bad, they do come after a three-year run-up of 90.13% (2021: 26.87%; 2020: 16.24%; 2019: 28.88%) and a five-year run of 112.89% (2018: -6.24%; 2017: 19.42%). The COVID-19 decline from Feb. 19, 2020 (a closing high at the time), to March 23, 2020, took the market down 33.93%, but it has recovered 71.61% from that March 2020 low and was up 13.39% from the pre-COVID-19 (impact) Feb. 19, 2020, level. The market is long term, and if that is your approach, 2022 must be interpreted via its highs, lows, events and history.
As for the January barometer of "so goes January, so goes the year," it has been correct 71.28% of the time since 1929, and it worked in 2022: January was down, at -5.26%, as was the year, at -19.44%. The first day indicator is a coin-toss, correct 50% of the time; it did not work in 2022, as the first day ended on a closing high (4,796.56, up 0.64% for the day) and was the highest close of the year.
The S&P 500 ended the year without Santa or any benevolent being showing up (although there was that 9.11% July run; should have realized when it was “911”). The index posted a 5.90% decline for December, after an uplifting 5.38% in November and 8.80% in October, which left Q4 2022 up 7.08%—the best three-month period of the year (September was -9.34% and August -4.24%). Unfortunately, 7.08% was nowhere near the level needed to compensate for the loss of 24.77% for the first nine months of the year, leaving 2022 down 19.44%, compared with 2021's gain of 26.89 (up 2.36% for the two-year period). For December, all 11 sectors declined, as Utilities did the best, limiting its decline to 0.77%, while Consumer Discretionary did the worst, falling 11.31% for the month.
For 2022, Energy was the only positive sector, up 59.04%, while Communication Services was the worst sector, down 40.42%; Information Technology was down 28.91% for 2022 and accounted for approximately 44% of the index's decline. On an aggregate basis, the S&P 500 decreased USD 2.156 trillion (to USD 32.133 trillion) for the month (up USD 1.736 trillion last month), while it declined USD 8.224 trillion for 2022; it was up USD 4.069 trillion from the Feb. 19, 2020, start of the COVID-19 pandemic.
Layoffs significantly increased, as snack and beverage issue PepsiCo (PEP), investment houses Morgan Stanley (MS) and Goldman Sachs (GS), Bank of America (BAC) and semiconductor maker Micron Technology (MU) all announced layoffs and cost reduction plans (last month included Amazon, Meta and Twitter).
