


October 2025 Commentary
Market Overview
The Federal Reserve continued its rate cut schedule in October, lowering the federal funds rate by 25 bps to 3.75%-4%, citing a slowdown in job gains and moderate inflation. On Oct. 1, 2025, the U.S. Federal Government shut down because Congress did not pass the budget for the new fiscal year. This had direct implications for the economy, with over 750,000 federal employees on unpaid leave and federal programs stopped. Considering this turbulence, the ISM Manufacturing PMI for October went down to 48.7%, with new orders, production, employment and supplier deliveries contracting.
The European Central Bank (ECB) decided to keep the three interest rates unchanged, with the deposit facility at 2.00%, the main refinancing operations at 2.15% and the marginal lending facility at 2.40%, citing a stable economy and inflation rate despite international headwinds.
In Latin America, Mexico’s economy grew 1.8% in the first half of the year, surprising economists that predicted a recession due to tariffs and other economic factors.
The HSBC India Manufacturing PMI was up to 59.2 in October due to purchase orders and softening inflation.
September 2025 Performance
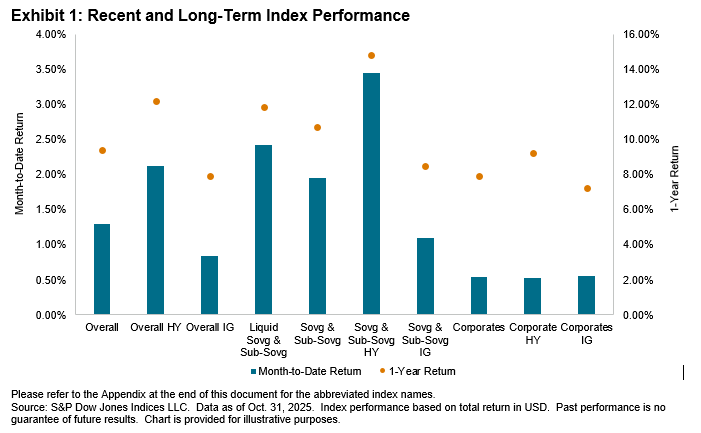
In October, all iBoxx USD Emerging Markets Indices posted positive returns, with the Overall achieving a 1.29% gain—a rise of 14 bps from September. Overall HY bonds outperformed the benchmark by 82 bps, gaining 2.12%, while Overall IG bonds lagged, with a return of 0.84%. This trend of outperformance in the HY segment extended to Sovg & Sub-Sovg HY, which saw gains of 3.44% in October, reflecting an increase of 276 bps from the previous month. Furthermore, Liquid Sovg & Sub-Sovg surpassed its benchmark by 47 bps, yielding 2.42% for the month (please refer to the Appendix at the end of this document for the abbreviated index names).
The top ten emerging market economies also witnessed a modest contraction in yields during October. Türkiye led the way with a decline of 11 bps in bond yields, while Saudi Arabia, Mexico and Indonesia each saw a decrease of 9 bps from the prior month. In terms of returns, Indonesia topped the list with a month-to-date performance of 1.18%, followed closely by Chile at 1.11% and Türkiye at 1.06%. Year-to-date, Mexico stands out as the top performer with a remarkable return of 14.29%.
