IN THIS LIST

iBoxx USD Asia Ex-Japan Monthly Commentary: January 2024

U.S. Equities Market Attributes January 2024

Municipal Bonds: Navigating the Curve in 2024

S&P Kensho New Economies Commentary: Q4 2023

Mexico Fixed Income Commentary: Q4 2023

iBoxx USD Asia Ex-Japan Monthly Commentary: January 2024

Contributor Image
Jessica Tan

Principal, Fixed Income Indices

S&P Dow Jones Indices

January 2024 Commentary

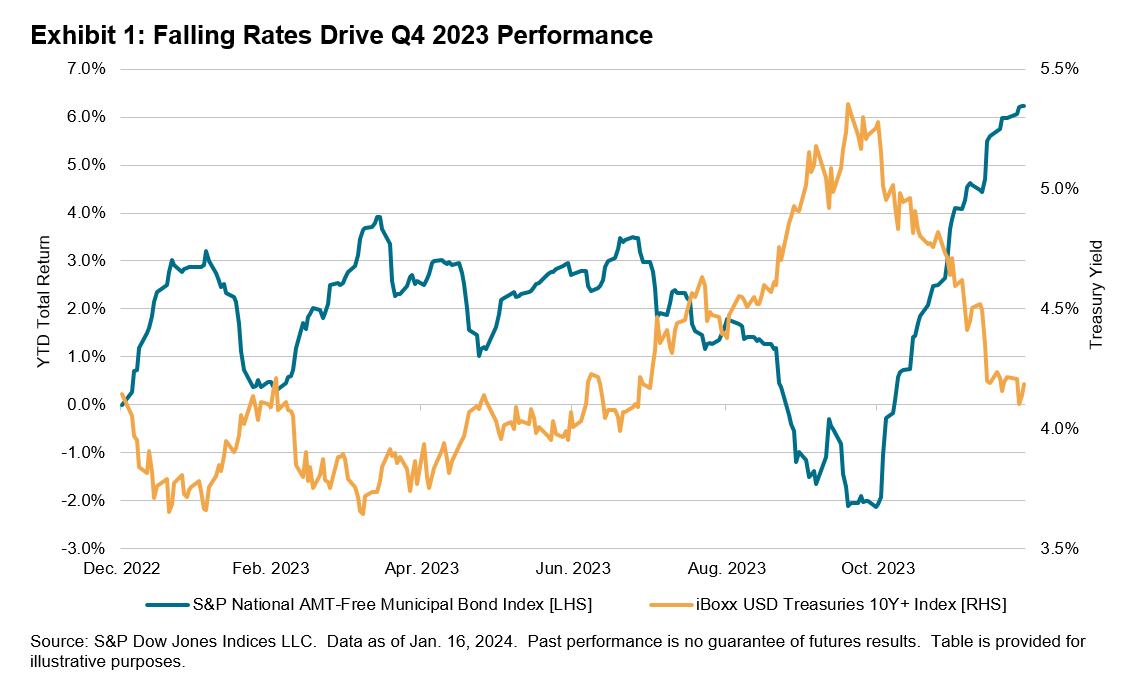
2024 began with no change in interest rates for most of the global and Asian central banks, with the U.S. Federal Reserve and the European Central Bank expressing that they would like to see more signs of inflation dampening, quashing market expectations of rate cuts in the short term.  On the fiscal side, the U.S. Treasury department announced a further increase in debt issuances in the next three months, as the federal budget deficit continues to grow.  U.S. 10-year Treasuries, which are regarded as the benchmark for global borrowing costs, retreated by 1.79%, as represented by iBoxx $ Treasuries 10Y+, after rallying for two consecutive months.

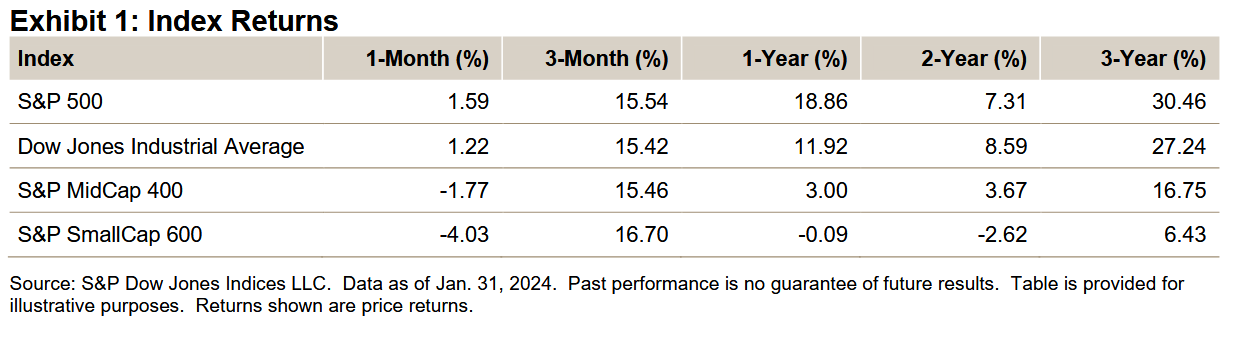
On the equities front, following a 24.24% gain in 2023, the S&P 500® experienced a modest gain of 1.59% in January, unfazed by the higher yields of the 10+ year U.S. Treasuries.

In China, the Real Estate sector continues to be a drag on the economy, as the government expands fiscal injections and targeted policy measures to give support to the weak housing demand and property developers’ liquidity issues.  One measure introduced in January was to whitelist development projects eligible for loans and coordinate with financial institutions to issue loans on development projects rather than on the basis of developers.  For the month of January, Chinese-issued U.S. dollar bonds—as represented by the iBoxx USD Asia ex-Japan China—gained 0.86%, while Chinese stocks—as represented by the S&P China 500 (USD)—lost 11.03%.

iBoxx USD Asia Ex-Japan Monthly Commentary: Exhibit 1

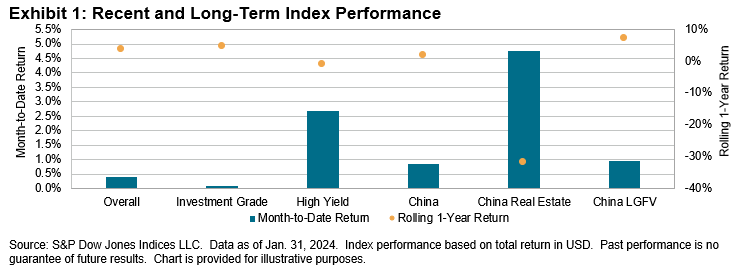
The Asian U.S. dollar bond market started the year with a 0.41% gain, supported by a 2.70% rise in the high yield index and a 0.09% rise in the investment grade index.  In terms of the rolling one-year returns, China Real Estate remained the worst-performing segment, losing 31.65%, while China LGFVs were one of the best-performing segments, with a positive return of 7.10%.

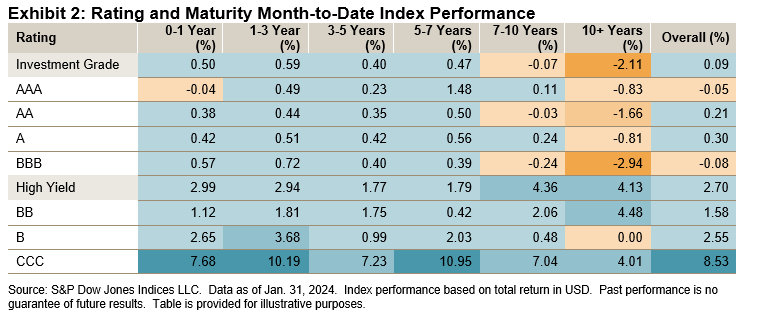
Similar to the U.S. Treasuries 10+ segment, the investment grade long-end maturity buckets broke their two-month uptrend, while short- to medium-end investment grade segments posted slight gains.  In the high yield segment, CCC rated bonds rallied the most (up 8.53%).

iBoxx USD Asia Ex-Japan Monthly Commentary: Exhibit 2

Of the top seven markets by market value in the index, five posted positive returns in January (Indonesia and Philippines were the two outliers).  India, the second-best performer in 2023, was the only top seven market that gained more than 1% this month.  Spreads across the five markets that posted positive returns narrowed, while duration lengthened across all markets except for China, Indonesia and Singapore.

pdf-icon PD F Download Full Article

U.S. Equities Market Attributes January 2024

Contributor Image
Howard Silverblatt

Senior Index Analyst, Product Management

S&P Dow Jones Indices

Key Highlights

Exhibit 1: Index Returns - U.S. Equities January 2024

MARKET SNAPSHOT

The S&P 500 continued its gains from December (4.42%) and November (8.92%) for a third consecutive month (1.59%), resulting in a strong 15.54% three-month rally.  For January, the index broke through 4,800 and then 4,900, posting six new closing highs (4,927.93 closing high and 4,931.09 intraday high), with the economy continuing to demonstrate its strength (GDP at 3.3%; PCE at 2.6%; low unemployment as paychecks increase; earnings and sales), as the market easily accepted that the strength would most likely delay the first Fed interest rate cut to May or June 2024, instead of the prior March expectation (the Fed confirmed this at its meeting).

At the sector level, 5 of the 11 sectors gained for January, compared to 10 in December (and 8 of 11 for 2023).  Communication Services did the best, up 4.84% for the month (down 3.48% from the 2021 close), and Real Estate did the worst, down 4.79% (down 26.24% from the close of 2021).  Breadth decreased and turned negative, as 224 issues gained (with 24 up at least 10%) and 279 fell (with 39 down at least 10%), compared to last months’ broad 432 gainers and 72 decliners (for 2023, 322 issues were up and 179 down, a complete reversal of 2022’s 139 gainers and 363 decliners).

The reality was that most of the Street was wrong about January; not the direction, but the issues, as the Magnificent 7 were expected to fall but continued upward (average gain of 1.80% for January; 5.58% without Tesla’s 24.63% decline).  They accounted for 45% of the January return (1.59%), which was down from 2023’s 62% rate.  Of note, within the Mag 7, the Mag 6 (excluding Tesla) would have accounted for 71% of the return.  Also helping the market were earnings.  With almost half of earnings in, they’ve been stronger than expected—if you leave out the special items—and sales were up 4.6% year-over-year to a record USD 4 trillion for Q4 and a record USD 15.6 trillion for 2023.  Behind those records is the consumer who continues to spend and charge (even as we are seeing more warning on charge cards and autos), as well as the government spending via CHIPs, IRAs and Infrastructure, with more expected from Washington.

February will continue the earnings watch as retail reports come in, along with the market sizing up if the consumer will continue to spend (and charge).  The focus on politics will also continue to grow, as the possible Biden-Trump rematch buzz has already started to filter into the general public, even though the primaries have just started.  Typically, the Street will start to take market positions on the expected November outcome in September, as a clearer picture on not just the presidency emerges, but that of the House and Senate.  Also in politics is government spending (continued deficit) and financing (borrowing shorter term, at higher interest rates than long term), as well as a budget deal that could affect defense issues (not to mention the border, Ukraine and Israel).

In the background day-to-day (the tide affects all, but does not move all) are the inflation indicators (CPI, PPI, PCE) and employment (employment, claims, availability), as well as investor flows (especially away from the USD 6 trillion in money markets and into the market).


Municipal Bonds: Navigating the Curve in 2024

Contributor Image
Jennifer Schnabl

Head of Fixed Income Core Indices

S&P Dow Jones Indices

Banner Performance, But Far from a Straight Line

The municipal bond market, as measured by the S&P National AMT-Free Municipal Bond Index, finished 2023 posting its strongest quarter in 14 years.  Its 2023 annual return of 6.24% was its best full-year performance since 2019.  While this was good news for many market participants, the path to get there was far from linear; 2023 presented many challenges for most fixed income asset classes, with central bank policy at the core.  Municipal bond indices proved resilient throughout the volatility, with favorable technicals and strong fundamentals driving performance.  As a new year begins, municipal bond indices may continue to be positioned to provide opportunities for 2024, both on a broad basis as well as across the curve.

Full Circle: How Did We Get Here?

The municipal bond market spent much of 2023 weathering the storm of interest rate volatility, as the U.S. Federal Reserve continued the most aggressive rate hiking cycle seen in over 40 years.  While the year began with optimism, performance across the municipal bond suite struggled through mid-year 2023 as the Fed raised rates for the 11th time in 16 months to 5.25-5.50%, before pausing in September.  The 10-year U.S. Treasury bond yield reached its peak in October, surpassing 5% for the first time in 16 years, at which time the S&P National AMT-Free Municipal Bond Index was down 2.13% YTD.

The rest of the fourth quarter would see the rate narrative change sharply, as falling inflation and weaker-than-expected economic data coupled with the Fed pause increased market expectations for rate cuts in Q1 2024.  The 10-year U.S. Treasury yield fell from its high and came full circle to end the year largely where it began, near 4%.  Munis rallied in sympathy with Treasuries and the S&P National AMT-Free Municipal Bond Index posted a quarterly gain of 7.29%, its strongest single quarter since Q3 2009.

pdf-icon PD F Download Full Article

S&P Kensho New Economies Commentary: Q4 2023

The S&P Kensho New Economy Indices seek to track the industries and innovation of the Fourth Industrial Revolution

The U.S. equities market's overall performance in 2023 was incongruous to many predictions made at the beginning of the year.  The global economy was resilient, avoiding a recession despite negative geopolitical headlines (link).  The U.S. remained a prominent contributor to this optimism, countering the weaker-than-expected growth in the world’s second-largest economy, China.  Macro conditions turned more favorable in the final quarter of year, with inflation gliding lower and interest rates across most countries stabilizing, albeit at a higher level for now.

The fourth quarter saw a broad recovery of the equities market from the previous quarter’s weakness to reach near all-time highs.  The S&P Global BMI was up 11.2% over the quarter, within roughly 1% of its all-time high.  Similar patterns played out across the S&P United States BMI (12%) and S&P Europe 350® (11%), while the S&P Emerging BMI (7%) was hindered by a relatively weaker performance of the S&P China BMI (-3%).

As U.S. interest rates took a breather, U.S. equities across the market-cap spectrum posted their best quarterly returns in nearly three years, with the S&P 500®, S&P MidCap 400® and S&P SmallCap 600® up 12%, 12% and 15%, respectively.  This optimism within equities has been supported by, among other things, the pause in Fed rate hikes since August, the Fed's December 2023 meeting minutes signaling potential rate cuts in 2024, strong buyback activity and solid fund inflows, especially within the U.S. small-cap space.

The end-of-year cheer was widespread across S&P 500-linked factors, with high beta (18%) and momentum (15%) taking the top spots, value (14%) outperforming growth (10%), and low volatility (7%) near the bottom.  However, the “bad breadth” syndrome was notable, as 72% of the stocks in the S&P 500 underperformed the benchmark over the year.  The S&P 500’s outperformance (10.2%) of its equal-weight counterpart was the largest in more than two decades.  Except for Energy, all other S&P 500 sectors posted positive quarterly returns, led by the interest rate-sensitive Real Estate sector (19%).  The S&P Kensho New Economies Composite Index (19%) had its best quarter since Q4 2020, having broad-based positive contributions from 24 of its 25 subsector indices.  In terms of 2023 performance, 19 of the 25 S&P Kensho New Economies subsectors posted gains, underscored by Distributed Ledger’s impressive 228% annual return, followed by the Tech- and Semiconductor-heavy Virtual Reality (64%).

U.S. interest rates, which had been steadily rising since mid-2021, fell sharply over the quarter.  The S&P U.S. Treasury Bond Index staged an impressive rally (5%), more than recovering the losses of the past two quarters and posting its first annual gain (4.5%) since 2020.  The European Central Bank also paused its interest rate hikes in October but has refrained from suggesting any possibility of rate cuts in 2024.  The quarterly gain of the S&P Eurozone Sovereign Bond Index (up 6.6%) was the best in more than 20 years.  In a reversal of its previous quarter, the relatively longer-duration S&P U.S. Investment Grade Corporate Bond Index (10.3%) outperformed its high-yield counterpart index (7.25%) and the floating-rate leveraged loans index (2.5%).  Fed futures are pricing in more than 125 bps of rate cuts over 2024, much higher than the FOMC’s forecast.  While the Fed rate path will be key in 2024, U.S. economic growth will be closely watched for any signs of deviation from the “soft landing” scenario we seem to be in.  The Conference Board’s U.S. leading economic indicators have steadily fallen for 20 consecutive months.

The commodities segment was one of the few areas with negative performance.  Supply cuts supported oil prices during the first half of the year, but growing concerns over demand outweighed and dragged the price down near USD 70.  The S&P GSCI Energy was down 16.8% over the fourth quarter, as oil futures positioning appears cautious.  The S&P GSCI Agriculture (-1%) was down and near three-year lows from near-record supplies.  The S&P GSCI Industrial Metals (0.8%) barely moved due to rising concerns and weak manufacturing activity evidenced from PMI surveys across the U.S. and Europe.  The S&P GSCI Precious Metals (11%) was the anomaly, posting positive quarterly performance.  Easing interest rates, a softening U.S. dollar and increased geopolitical tensions have played into precious metals’ appeal.


Mexico Fixed Income Commentary: Q4 2023

Contributor Image
Catalina Zota

Associate Director, Fixed Income Product Management

S&P Dow Jones Indices

Market Snapshot

Mexico’s central bank held interest rates steady at 11.25% in December 2023.  The Bank of Mexico has kept the rate unchanged since March 2023.  Market participants are expecting rate cuts in 2024.  The inflation rate was up to 4.66% in December 2023, compared to 4.45% at the end of Q3 2023.

Yield on all S&P/BMV Fixed Income Indices trended down for Q4 2023.  Yields remained unchanged or declined slightly on the sovereign bond and floating rate indices, while quasi-sovereign, inflation-linked, corporate and Eurobond indices saw declines.

For 2023, the S&P/BMV All Sovereign Bond Index gained 10.2%, the S&P/BMV Quasi Sovereign Bond Index was up 11%, and the S&P/BMV Corporate Bond Index posted 11.3%.

Eurobonds and United Mexican States (UMS) bonds ended the year in negative territory.  Despite large gains in Q4, the S&P/BMV Sovereign International UMS Bond Index fell 3.9% in 2023, while the S&P/BMV Corporate Eurobonos Bond Index was down 5.6%.  Yields on Eurobond corporates dropped 89 bps, from 6.67% in September 2023 to 5.81% at the end of Q4 2023.  The yield for UMS bonds dropped 95 bps, from 6.44% at the end of Q3 2023 to 5.49% at the end of Q4 2023.  Comparing the S&P/BMV Sovereign International UMS Bond Index with the iBoxx $ Eurodollar Sovereigns Index—a measure of the broader Eurodollar sovereign market—the yields are close.  The iBoxx $ Eurodollar Sovereigns Index had a yield decrease of 86 bps, dropping from a yield of 6.17% in Q3 2023 to 5.31% in Q4 2023.  Comparing the S&P/BMV Corporate Eurobonos

Bond Index with the broader market indicator—iBoxx $ Eurodollar Corporates—a similar view is apparent.  The iBoxx $ Eurodollar Corporates had a yield decrease of 96 bps, from 6.19% at the end of Q3 2023 to 5.23% in Q4 2023.

The Eurobonds market is one of the most liquid fixed income markets in the world.  It provides foreign capital to issuers and diversification to investors, usually at a fixed rate.  According to the iBoxx $ Eurodollar Overall Index, the nominal value of all 8,247 bonds included in the index as of December 2023 stood at USD 9.13 trillion, with a market value of USD 8.34 trillion.  A drop in yields signifies that the bonds are more expensive to buy and that investors expect to earn less on the securities.  A drop in yields can also signal a possible recession.

pdf-icon PD F Download Full Article

Processing ...