IN THIS LIST

iBoxx USD Asia Ex-Japan Monthly Commentary: February 2024

iBoxx Asian Local Currency Indices Monthly Commentary: February 2024

U.S. Equities Market Attributes February 2024

Indexing Dividends: Transparent Tools for Understanding Income Strategies

iBoxx USD Asia Ex-Japan Monthly Commentary: January 2024

iBoxx USD Asia Ex-Japan Monthly Commentary: February 2024

Contributor Image
Jessica Tan

Principal, Fixed Income Indices

S&P Dow Jones Indices

February 2024 Commentary

Global central banks continued to hold rates steady in the month of February, and it has been close to half a year since most monetary policymakers, including the European Central Bank and U.S. Federal Reserve, introduced any interest rate changes.  In Asia, central banks have been paying close attention to their currencies’ strength against the U.S. dollar when assessing their countries’ economic conditions and interest rate policies.  Most Asian currencies have depreciated against the dollar since the start of the year.

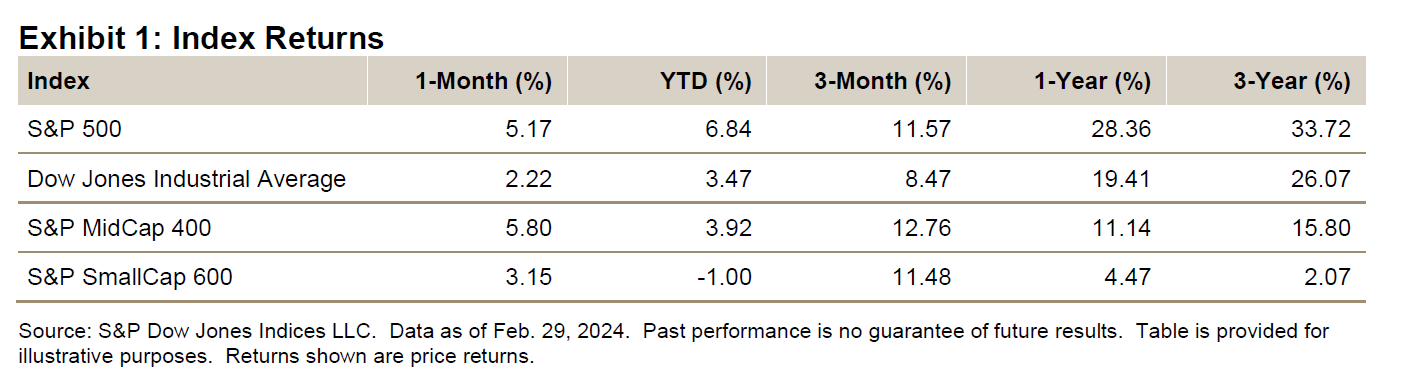
February 2024 was the second consecutive month the S&P 500® broke its all-time high, as it rallied by 5.17%.  U.S. 10-year Treasuries, as represented by the iBoxx $ Treasuries 10Y+, continued to give up their 2023 gains, retreating 2.39%.  This brings their YTD return to -4.14% and yield to 4.53%.

In China, following the fall of new home prices in January despite stimulative policy changes, the People’s Bank of China (PBoC) persisted in its efforts to revive the property market by unveiling its largest ever reduction in benchmark mortgage rate, slashing the five-year loans prime rate by 25 bps (to 3.95%).  This would reduce the cost of new residential purchases and ease repayment pressure on existing home loans.  For the month of February, Chinese-issued U.S. dollar bonds—as represented by the iBoxx USD Asia ex-Japan China—returned 0.07%, while Chinese stocks—as represented by the S&P China 500 (USD)—fell to their eight-year low before rebounding and gaining 9.08% during the month.

iBoxx USD Asia Ex-Japan Monthly Commentary: Exhibit 1

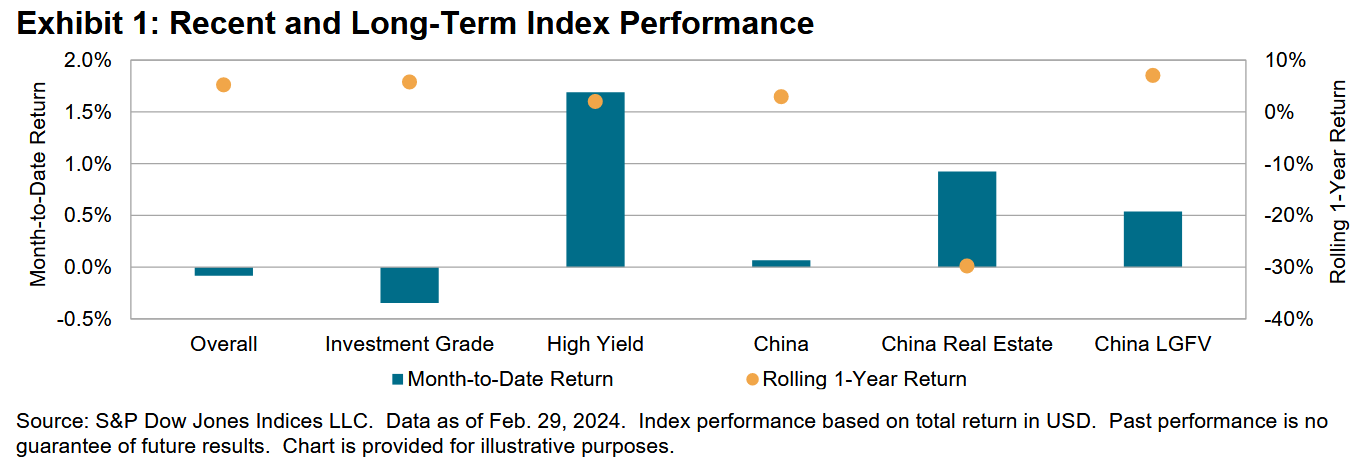
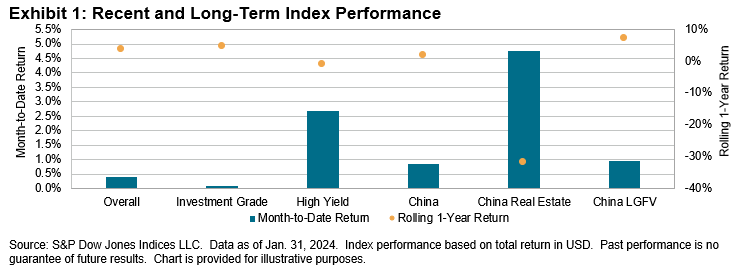
The Asian U.S. dollar bond market’s second month of the year ended with a 0.08% loss, supported by a 1.69% rise in the high yield index and a 0.35% loss in the investment grade index.  In terms of the rolling one-year returns, China Real Estate remained the worst-performing segment, at -29.80%, while China LGFVs was one of the best-performing segments, with a return of 7.03%.

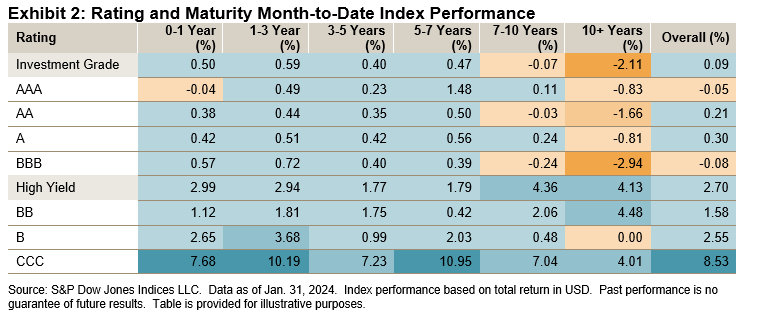
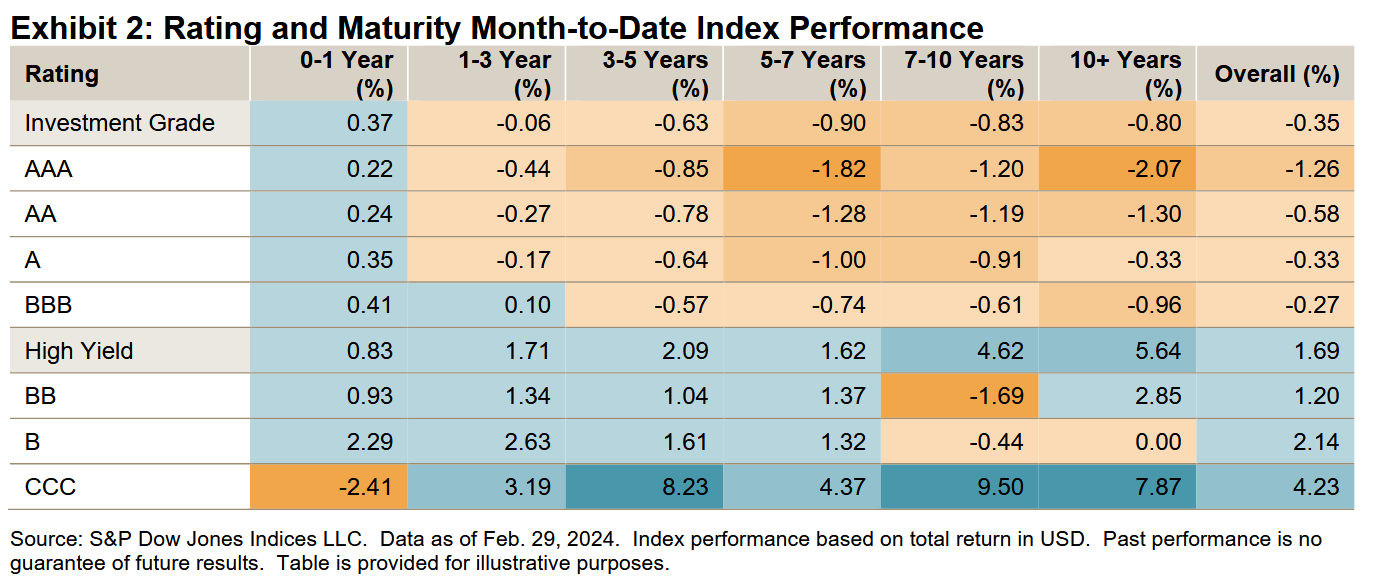
Aside from the 0-1 year segment, which posted modest gains (except CCC bonds), there was a rather stark contrast in the performance of the investment grade and high yield rated bonds this month.  The investment grade bonds retreated slightly, as the AAA 10+ years segment posted the second-worst performance at -2.07%.  On the flipside, high yield bonds mostly climbed, especially the 7-10 years and 10+ years segments, returning 4.62% and 5.64%, respectively.

iBoxx USD Asia Ex-Japan Monthly Commentary: Exhibit 2

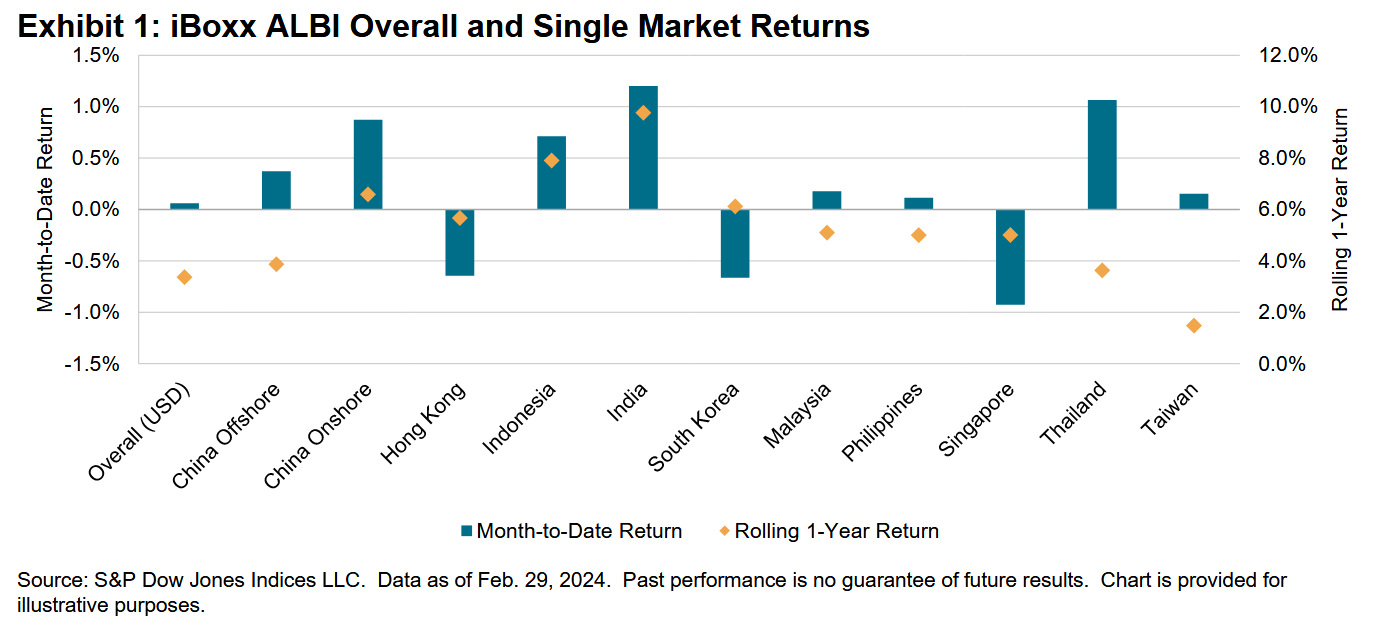
Half of the top seven largest markets by market value in the index posted negative returns.  Spreads across all seven markets narrowed, while duration shortened across all markets except for South Korea, which experienced no change.

pdf-icon PD F Download Full Article

iBoxx Asian Local Currency Indices Monthly Commentary: February 2024

Contributor Image
Kangwei Yang

Director, Fixed Income Indices

S&P Dow Jones Indices

Monthly performance, maturity, yield and duration of the iBoxx ALBI, iBoxx ABF and iBoxx SGD Indices.

Since the start of the year, the option-adjusted spreads (OAS) for investment grade U.S. corporate bonds—as represented by the iBoxx $ Corporates—were range-bound between 104 to 120 bps.  The last time bonds were trading in this range was toward the tail-end of 2021.  As a result, corporate issuers may be looking take advantage of the current lower borrowing cost environment.  However, from the perspective of the lender, they would be compensated less for the additional risk they undertake (over risk-free instruments) compared to the past two years.

As the next U.S. FOMC meeting is drawing near in March, the S&P 500® was buoyant, up 5.17% in February and closing at an all-time high, led by gains in technology and AI.  Chinese stocks—as represented by the S&P China 500 (USD)—also bounced back from losses in January and posted 9.08% in February.  At the same time, the broader S&P Pan Asia Ex-Japan LargeMidCap (USD) gained 4.22%.

While the equity markets cheered, results were mixed in global bond markets.  U.S. Treasuries—as represented by iBoxx $ Treasuries—continued accumulating losses in 2024 and declined 1.38% in February.  Asian local currency markets, however, provided some bright spots—to be discussed in the following sections.

iBoxx Asian Local Bond Index (ALBI)

iBoxx Asian Local Currency Indices: Monthly Commentary: Exhibit 1

In Asian fixed income, Asian local currency bonds—as represented by the iBoxx Asian Local Bond Index (ALBI) (USD Unhedged)—gained a marginal 0.06% in February with mixed performance in the local markets (and local currencies against the U.S. dollar).

India and Thailand, in local currency terms, were the top-performing local markets as they continued their momentum into February, posting 1.20% and 1.07%, respectively.  Both China On-and Offshore markets also recorded modest gains.  At the bottom of the pack were Singapore and South Korea, down 0.93% and 0.66%, respectively.  

For most local markets, gains or losses tended to extend across the whole term structure.  China Onshore 10+ and India 10+ stood out this month, posting 2.75% and 1.87%, respectively.  On the flipside, Hong Kong 10+ (down 2.20%) and Singapore 10+ (down 2.15%) were the worst-performing segments.

As of the end of February, the overall index yield increased marginally by 2 bps to 3.90%.  India remained the highest-yielding bond market in the index, posting 7.13%, while China Onshore (2.41%) represented the lowest-yielding market.


pdf-icon PD F Download Full Article

U.S. Equities Market Attributes February 2024

Contributor Image
Howard Silverblatt

Senior Index Analyst, Product Management

S&P Dow Jones Indices

Key Highlights

Exhibit 1: Index Returns - U.S. Equities February 2024

MARKET SNAPSHOT

Neither inflation nor Fed rates nor interest costs nor gloom of consumer and government debt (nor government shutdowns—seems we have more concerns than the saying has room for) stays these markets from the swift completion of their appointed new closing highs, as delivered by the S&P 500’s eight new closing highs in February (closing the month on one of them, at 5,096.27, though the intraday high was 5,111.06), after six in January.  The Dow Jones Industrial Average has also posted closing highs—seven each in the month of February, January and December).  For February, the S&P 500 broke through and traded above 5,000 for the first time, reaching above 5,100 as well, but leaving that close to another day.  It posted its fourth month of broad gains, up 5.17% (5.34% with dividends), after January’s 1.59%, December’s 4.54% and November’s 8.92% (cumulatively 21.52%), which followed three months of losses (-8.61%).  Year-to-date, the index was up 6.84% (7.11%), as the 2023 return was up 24.23% (26.29%), making up for 2022’s 19.44% decline; the one-year return was 28.36% (30.45%).  The index was up 50.50% (60.64%) from its pre-COVID-19 Feb. 19, 2020, closing high.

All 11 S&P 500 sectors gained for February, compared with 5 for January and 10 in December (8 of 11 for 2023).  Consumer Discretionary did the best, up 8.60% for the month (up 4.74% YTD and down 7.79% from the 2021 close), and Utilities did the worst, up 0.53% (down 2.55% YTD and down 13.75% from the close of 2021).  Breadth improved (351 up and 151 down, compared with last month’s 224 up and 279 down), with YTD breadth turning positive (302 up and 201 down; for 2023, 322 issues were up and 179 down, a reversal of 2022’s 139 gainers and 363 decliners).  February posted gains for 13 of its 20 trading days (11 of 21 last month), while trading increased 4% over January and was down 3% over February 2023.

The Magnificent 7 continued, although it appears to have become more of a one-company show, with Nvidia (NVDA) gaining 28.6% for the month (up 59.8% YTD and up 441% from the close of 2022) and representing 20% of the February total return for the S&P 500 and 26% YTD.  Nvidia briefly traded above the USD 2 trillion mark, joining Microsoft (MSFT; USD 3.07 trillion) and Apple (AAPL; USD 2.64 trillion, with Nvidia at USD 1.95 trillion) as the dominating gang of three (making up 17.9% of the S&P 500; Alphabet’s two issues add up to USD 1.52 trillion and account for 3.5% of the index).  So the trillion dollar question is—how long can it go on for?  The answer may be found in the two days prior to its earnings and sales blowout release (which ended with the company posting a record USD 273 billion market gain that next day), when some took profits (-7% for two days) but got back in—because you have to be in it to win it.  The run will continue as long as the market believes superior growth will continue.


Indexing Dividends: Transparent Tools for Understanding Income Strategies

Contributor Image
Jason Ye

Director, Factors and Thematics Indices

S&P Dow Jones Indices

Investors in search of diversified performance and income amid today’s volatile market are seeing the potential benefits of dividend index strategies of different types, says Jason Ye, director of factors and thematics indices in APAC at S&P Dow Jones Indices (S&P DJI).

Given so much market uncertainty over the past few years, investor appetite for dividend-paying stocks has been a constant in this time.

This is evident by looking at the global dividends ETF market. The assets under management of dividend-related ETFs grew from around USD 100 billion to around USD 500 billion over the past decade. Within the dividend ETF market, USD 223 billion of assets were tracking the dividend indices offered by S&P DJI as of Dec. 31, 2023.

Perhaps most notable is the fact that these flows have remained despite a dip in the performance of dividend index strategies in 2023 – which has followed a bounce back in technology stocks. Regardless, high levels of investor demand are reflected in 2023 inflows to some dividends ETFs that track S&P DJI indices in the multiple billions of US dollars.

“Despite performance, we still see very strong inflows to dividend index strategies,” said Jason Ye at S&P DJI. “Investors in the US have also been buying international dividends ETFs.”

Capitalising on the US equities story

A foundation of global investor interest in US dividends is interest in US equities.

In Asia, for example, demand has come from markets like Korea and Japan, which are interested in US equities and see dividend indices as a natural choice in addition to the S&P 500®.

Asia is also driving innovation within dividend index strategies. “This has led to us adding a covered call overlay, which we created to offer extra income from selling options,” explained Ye.

In line with investor interest, investment product issuers in the region have launched several products tracking the S&P 500 Dividend Aristocrats®.

This flagship index is designed to measure the performance of S&P 500 constituents that have followed a policy of increasing dividends every year for at least 25 consecutive years. It aims to reflect both capital growth and dividend income characteristics, as opposed to alternative index income strategies that may be pure yield or pure capital-appreciation oriented.

In 2023, new products were launched in both the US and Korea tracking the S&P Dividend MonarchsTM Index which measures companies within the S&P Composite 1500®4 constituents that have followed a policy of increasing dividends every year for at least 50 consecutive years.

Compared to the S&P 500 Dividend Aristocrats, the S&P Dividend Monarchs Index further elevates the dividend growth criteria to half a century. These types of companies have been commonly referred to as the “Dividend Kings” in the investment community.

pdf-icon PD F Download Full Article

iBoxx USD Asia Ex-Japan Monthly Commentary: January 2024

Contributor Image
Jessica Tan

Principal, Fixed Income Indices

S&P Dow Jones Indices

January 2024 Commentary

2024 began with no change in interest rates for most of the global and Asian central banks, with the U.S. Federal Reserve and the European Central Bank expressing that they would like to see more signs of inflation dampening, quashing market expectations of rate cuts in the short term.  On the fiscal side, the U.S. Treasury department announced a further increase in debt issuances in the next three months, as the federal budget deficit continues to grow.  U.S. 10-year Treasuries, which are regarded as the benchmark for global borrowing costs, retreated by 1.79%, as represented by iBoxx $ Treasuries 10Y+, after rallying for two consecutive months.

On the equities front, following a 24.24% gain in 2023, the S&P 500® experienced a modest gain of 1.59% in January, unfazed by the higher yields of the 10+ year U.S. Treasuries.

In China, the Real Estate sector continues to be a drag on the economy, as the government expands fiscal injections and targeted policy measures to give support to the weak housing demand and property developers’ liquidity issues.  One measure introduced in January was to whitelist development projects eligible for loans and coordinate with financial institutions to issue loans on development projects rather than on the basis of developers.  For the month of January, Chinese-issued U.S. dollar bonds—as represented by the iBoxx USD Asia ex-Japan China—gained 0.86%, while Chinese stocks—as represented by the S&P China 500 (USD)—lost 11.03%.

iBoxx USD Asia Ex-Japan Monthly Commentary: Exhibit 1

The Asian U.S. dollar bond market started the year with a 0.41% gain, supported by a 2.70% rise in the high yield index and a 0.09% rise in the investment grade index.  In terms of the rolling one-year returns, China Real Estate remained the worst-performing segment, losing 31.65%, while China LGFVs were one of the best-performing segments, with a positive return of 7.10%.

Similar to the U.S. Treasuries 10+ segment, the investment grade long-end maturity buckets broke their two-month uptrend, while short- to medium-end investment grade segments posted slight gains.  In the high yield segment, CCC rated bonds rallied the most (up 8.53%).

iBoxx USD Asia Ex-Japan Monthly Commentary: Exhibit 2

Of the top seven markets by market value in the index, five posted positive returns in January (Indonesia and Philippines were the two outliers).  India, the second-best performer in 2023, was the only top seven market that gained more than 1% this month.  Spreads across the five markets that posted positive returns narrowed, while duration lengthened across all markets except for China, Indonesia and Singapore.

pdf-icon PD F Download Full Article

Processing ...