IN THIS LIST

iBoxx USD Asia Ex-Japan Monthly Commentary: December 2023

iBoxx Asian Local Currency Indices Monthly Commentary: December 2023

iBoxx Asian Local Currency Indices Monthly Commentary: January 2024

U.S. Equities Market Attributes December 2023

iBoxx Asian Local Currency Indices Monthly Commentary: November 2023

iBoxx USD Asia Ex-Japan Monthly Commentary: December 2023

Contributor Image
Jessica Tan

Principal, Fixed Income Indices

S&P Dow Jones Indices

December 2023 Commentary

To suppress the effects of the post-pandemic inflation, central banks around the world have been hiking interest rates since 2021.  However, signs of slowing inflation have been observed since Q2 2023, and most central banks in Asia held rates steady in Q4 2023, as did the U.S. Federal Reserve and European Central Bank.  As the pause in rate hikes has been extended, market sentiment has increasingly shifted toward predicting rate cuts in the new year.  Bolstered by the expectations of potentially lower interest rates, the iBoxx $ Treasuries 10Y+, which is regarded as a benchmark for global borrowing costs, climbed 8.21% in December, bringing its Q4 and one-year returns to 12.12% and 3.47%, respectively.  Despite the impressive performance in Q4 2023, 10+-year U.S. Treasury yields were still at 4.19%, 4 bps above the level at the end of 2022.

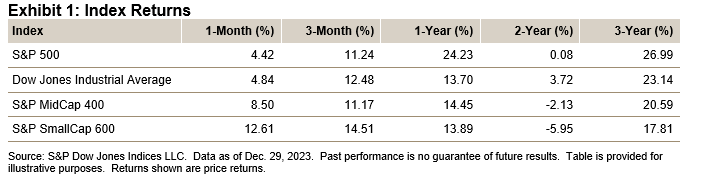
For the second month in a row, the S&P 500® rallied in tandem with the iBoxx $ Treasuries 10Y+, gaining 4.42% and bringing its Q4 and one-year returns to 11.24% and 24.23%, respectively.

Contrary to the policy stance of other central banks in 2023, the People’s Bank of China maintained an accommodative monetary stance by lowering its key policy rate and carrying out multiple liquidity injection operations to support its economy impacted by the real estate market slump, local government debt risks and slow economic growth.  For the year, Chinese-issued U.S. dollar bonds—as represented by iBoxx USD Asia ex-Japan China—returned 4.07%, while Chinese stocks—as represented by the S&P China 500 (USD)—lost 14.25%.

iBoxx USD Asia Ex-Japan Monthly Commentary: Exhibit 1

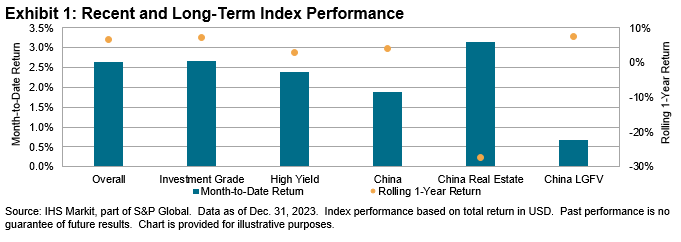
The Asian U.S. dollar bond market kept the positive momentum from last month as the overall index rose 2.64%, with the investment grade and high yield segments climbing 2.67% and 2.38%, respectively.  In terms of the rolling one-year returns, China Real Estate remained the worst-performing segment, at -27.50%, while China LGFVs were one of the best-performing segments, with a positive return of 7.59%.

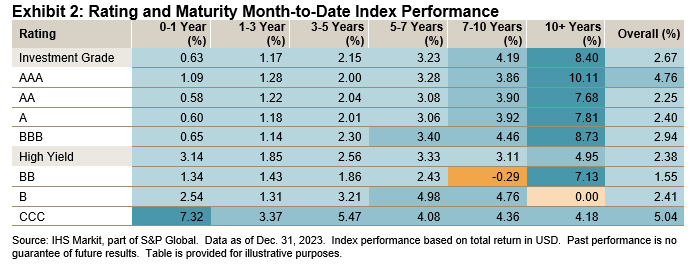
Almost all rating and maturity segments continued their uptrend from November to December, with the long-end maturity buckets performing the best.  In particular, the 10+ years segment of the USD-denominated Asia bond market rallied the most in 2023, with a gain of 13.01%, after being the worst performer in 2022, with a loss of 23.47%.

iBoxx USD Asia Ex-Japan Monthly Commentary: Exhibit 2

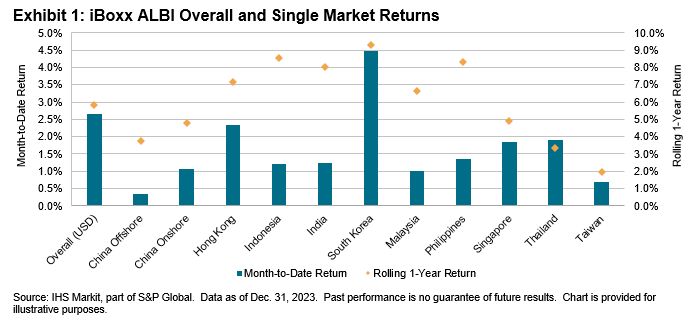
All of the top seven markets by market value in the index posted positive returns in December, as well as for 2023.  The three best-performing markets in December were also the best-performing markets for the year overall: Indonesia (4.94% in December; 9.88% in 2023), India (2.87% in December; 9.56% in 2023) and the Philippines (4.14% in December; 9.03% in 2023).  Spreads across all seven markets narrowed by at least 30 bps, while duration lengthened across all markets except for South Korea.

pdf-icon PD F Download Full Article

iBoxx Asian Local Currency Indices Monthly Commentary: December 2023

Contributor Image
Kangwei Yang

Director, Fixed Income Indices

S&P Dow Jones Indices

Monthly performance, maturity, yield and duration of the iBoxx ALBI, iBoxx ABF and iBoxx SGD Indices.

As 2023 drew to a close, the debate over hard landing versus soft landing continued, although market consensus shifted toward a softer landing as the year progressed.  This conversation looks likely to carry on into 2024.

In December, the final FOMC meeting of 2023 was held and the predictions of most analysts held true as U.S. interest rates stayed in the 5.25%-5.5% range.  The 10-2 Year Treasury Yield Spread remained relatively unchanged as well at -0.35%.  At the same time, U.S. Treasuries—as represented by the iBoxx $ Treasuries—gained 3.48% in December and 4.12% for the full year.

In the U.S. equity market, the S&P 500® had a stellar year with a return of 24.23%, wiping away 2022 losses and ending the year within reach of the all-time high set on Jan. 3, 2022.  Other equity markets lagged the S&P 500, notably, Chinese stocks—as represented by the S&P China 500 (USD)—were down 14.25% in 2023, while broader Asian markets—as represented by the S&P Pan Asia Ex-Japan LargeMidCap (USD)—fared better, up 5.99% for the year.

iBoxx Asian Local Bond Index (ALBI)

iBoxx Asian Local Currency Indices: Monthly Commentary: Exhibit 1

In Asian fixed income, Asian local currency bonds—as represented by the iBoxx Asian Local Bond Index (ALBI) (USD Unhedged)—gained 2.64% in December on the back of both capital gains as well as FX gains in most markets (except the Hong Kong dollar which is pegged to the U.S. dollar).  For the full year, the index returned 5.81% (compared to -7.39% in 2022), outperforming U.S. Treasuries.

For the second month running, all local markets posted positive returns.  South Korea and Hong Kong, in local currency terms, led the gains in December, up 4.48% and 2.32%, respectively.  At the other end of the spectrum were China Offshore (0.35%) and Malaysia (1.01%).  In 2023, South Korea (9.27%), Indonesia (8.55%) and the Philippines (8.33%) were the top-performing local markets.

Gains were observed across the yield curve, with clear investor preference for longer-dated bonds.  South Korea 10+ stood out as the best-performing segment, returning 8.48%, while Hong Kong 10+, Singapore 10+ and Thailand 10+ all recorded gains exceeding 3%.

At the end of 2023, the overall index yield decreased by another 30 bps to 3.85%.  India remained the highest-yielding bond market in the index, posting 7.31%, while China Onshore (2.62%) represented the lowest-yielding market.

pdf-icon PD F Download Full Article

iBoxx Asian Local Currency Indices Monthly Commentary: January 2024

Contributor Image
Kangwei Yang

Director, Fixed Income Indices

S&P Dow Jones Indices

Monthly performance, maturity, yield and duration of the iBoxx ALBI, iBoxx ABF and iBoxx SGD Indices.

Across the globe, 2024 will bring more than 50 elections and over a billion voters going to the polls, including in Taiwan (just ended), Indonesia, South Korea and India, as well as the U.S. toward the end of the calendar year.  The outcome of the elections will no doubt have an impact on fiscal policies and the broader financial markets.

As January went on, expectations of the first U.S. interest rate cut in March were dampened after statements made from the Federal Reserve Chair at the FOMC meeting at the end of the month.  Rates were unchanged after the meeting, which highlighted elevated inflation persisting despite slowing over the past year, as well as strong data on the economy and unemployment fronts.

In the immediate aftermath, the S&P 500® erased some gains that were accumulated through the month, but still managed a 1.59% return in January.  In contrast, Chinese stocks—as represented by the S&P China 500 (USD)—started the year on the wrong foot, losing 9.61%. Similarly, broader Asian markets—as represented by the S&P Pan Asia Ex-Japan LargeMidCap (USD)—lost ground by 4.47%.

U.S. Treasuries, usually thought of as a safe haven, lost 0.22% in January, as represented by the iBoxx $ Treasuries.

iBoxx Asian Local Bond Index (ALBI)

iBoxx Asian Local Currency Indices: Monthly Commentary: Exhibit 1

In Asian fixed income, Asian local currency bonds—as represented by the iBoxx Asian Local Bond Index (ALBI) (USD Unhedged)—pulled back 1.86%, owing to a combination of mixed performance in the local bond markets and the relative strength of the U.S. dollar against the local currencies as we start the year.

In local currency terms, India (up 1.19%) and Thailand (up 0.95%) were the best performers.  China On- and Offshore bonds were not far behind, returning 0.82% and 0.63%, respectively.  South Korea, the best-performing market in 2023, was bottom of the pile as we started 2024, losing 1.47% in January.

Gains were observed across local bond markets in the short-end 1-3 year maturity segment.  However, performance became mixed as we look to longer maturity segments.  China Onshore 10+ and China Offshore 10+ fared the best, returning 3.26% and 2.40%, respectively.  On the other hand, South Korea 10+ (down 3.35%) and Hong Kong 10+ (down 2.72%) were the worst-performing segments.

As January ended, the overall index yield increased by a modest 3 bps to 3.88%.  India remained the highest-yielding bond market in the index, posting 7.22%, while China Onshore (2.52%) represented the lowest-yielding market.

pdf-icon PD F Download Full Article

U.S. Equities Market Attributes December 2023

Contributor Image
Howard Silverblatt

Senior Index Analyst, Product Management

S&P Dow Jones Indices

Key Highlights

Exhibit 1: Index Returns - U.S. Equities December 2023

MARKET SNAPSHOT

For 2023, the S&P 500 posted a 24.23% return (26.44% with dividends), which made up for 2022’s loss of 19.44% (-18.11%), leaving the two-year gain at 0.08% (3.42% with dividends). However, the breakdown of the year showed clear winners and losers, which differed greatly from the results in 2022 and over the two-year period.  For 2023, Information Technology and Communication Services were the big winners, gaining 56.39% and 54.36%, respectively. Those gains followed 2022 losses of 28.91% and 40.42%, respectively, leaving the two-year return at a 11.18% gain for Information Technology and a loss of 8.03% for Communication Services.  Energy declined 4.80% for 2023 but was the only sector up for 2022 (with a gain of 59.05%), as it finished the two-year period with a gain of 51.41%.  Utilities did the worst in 2023, down 10.20%, and with 2022’s 1.44% decline, it was down 11.49% over the past two years.

At the sector level, eight sectors gained for 2023, compared with one in 2022, with three up over the past two years.  Breadth was positive for 2023, with 322 issues up and 179 down, compared with 2022’s 139 gainers and 363 decliners, as the two-year run posted negative breadth, with 213 issues up (78 up at least 30%) and 286 down (74 down at least 30%).

As for the Magnificent Seven, they did great this year (with an average total return gain of 104.7%), accounting for 62.2% of the S&P 500’s 26.29% total return (excluding this group, the index return was 9.94% for 2023).  This gain made up for last year, when they all declined (average -45.31%), leaving only Amazon.com (AMZN) and Tesla (TSLA) still in the red from year-end 2021.  For the two-year period, the S&P 500 was up 3.42% (total return), with the Magnificent Seven accounting for 2.05% of it (leaving the index up 1.37% for the two-year period without them).

The year ended on a nine-week run of gains, up 15.85% (last seen in January 1994, up 10.26%). The S&P 500 closed at 4,769.83, up 24.23% for the year, 0.56% off its Jan. 3, 2022, closing high of 4,796.56, and up 40.86% from the pre-COVID-19 high (Feb. 19, 2020) of 3,386.15.

January 2024 will be active, as the U.S. Congress returns and has to address issues on Ukraine, Israel and the U.S. border, while a potential government shutdown looms if a new budget (or stopgap bill) is not reached by Jan. 19, 2024.  Adding to the market’s activities is earnings season, starting on Friday, Jan. 12, 2024, with the big banks.


iBoxx Asian Local Currency Indices Monthly Commentary: November 2023

Contributor Image
Kangwei Yang

Director, Fixed Income Indices

S&P Dow Jones Indices

Monthly performance, maturity, yield and duration of the iBoxx ALBI, iBoxx ABF and iBoxx SGD Indices.

Various measures were introduced by China’s central bank and government agencies in November to provide further support to lift the country’s economy, especially in the private sector.  One point to consider is whether this is another temporary boost, or if the new policies could be the start of a more systemic recovery.

Chinese stocks—as represented by S&P China 500 (USD)—gained 1.33% this month but lost 12.85% so far this year.  In the wider Asian market, the S&P Pan Asia Ex-Japan LargeMidCap (USD) posted a larger gain of 7.44% in November, with an uptick of 1.20% YTD.  In the U.S., the S&P 500® rebounded this month with a return of 8.92%,

In U.S. fixed income, U.S. Treasuries—as represented by the iBoxx $ Treasuries—gained 3.59% in November.  At the same time, the 10-2 Year Treasury Yield Spread widened from -0.19% at the end of October to -0.36%. Year-to-date, the index inched up 0.62%.

As we look ahead to a month of festivities, there is still one last U.S. FOMC meeting this year to be held on Dec.12-13, 2023, as investors anticipate the Fed’s next move on interest rates.


iBoxx Asian Local Currency Indices: Monthly Commentary: Exhibit 1

Asian local currency bonds had a good month as well, aided by FX gains against the U.S. dollar, as well as capital gains in most markets.  As a result, the iBoxx Asian Local Bond Index (ALBI) (USD Unhedged) gained 4.89% in November and 3.08% YTD.

South Korea and the Philippines, in local currency terms, were the standout performers, posting 5.07% and 3.68%, respectively.  Despite posting positive returns, China Offshore (0.41%) and China Onshore (0.43%) ranked at the bottom of the chart.  Year-to-date, Indonesia (7.27%), the Philippines (6.90%) and India (6.71%) were the best-performing markets.

Most gains were observed in the long-dated segment of the index, notably South Korea 10+ (9.54%), Hong Kong 10+ (9.52%) and the Philippines 10+ (7.96%).  Investors clearly had a preference for long-dated exposures, across markets.

As of the end of November, the overall index yield decreased by 29 bps to 4.05%.  India remained the highest-yielding bond market in the index, posting 7.40%, while China Onshore (2.77%) represented the lowest-yielding market.

pdf-icon PD F Download Full Article

Processing ...