IN THIS LIST

iBoxx Tadawul SAR Government Sukuk Indices – Q1 2024

iBoxx USD Asia Ex-Japan Monthly Commentary: March 2024

S&P Target Date Scorecard: Year-End 2023

iBoxx Asian Local Currency Indices Monthly Commentary: March 2024

U.S. Equities Market Attributes March 2024

iBoxx Tadawul SAR Government Sukuk Indices – Q1 2024

Contributor Image
Jessica Tan

Principal, Fixed Income Indices

S&P Dow Jones Indices

iBoxx Tadawul SAR Government Sukuk Index

iBoxx Tadawul SAR Government Sukuk Indices: Exhibit 1

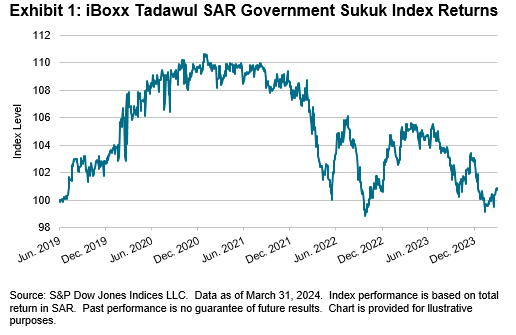
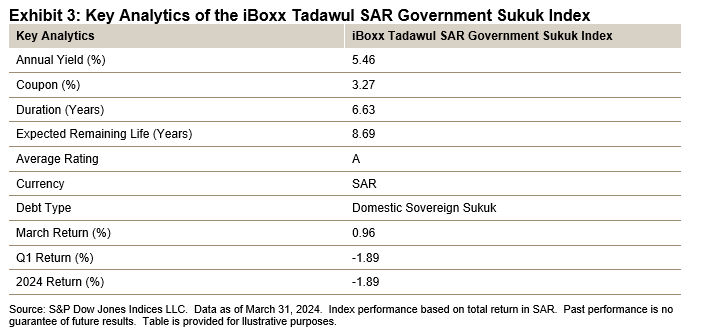
The iBoxx Tadawul SAR Government Sukuk Index started the year with two consecutive months of losses (-2.41% and -0.42%), almost revisiting the lows of October 2022 in February before rebounding with a 0.96% gain in March.  The index closed the first quarter of the year with a -1.89% return.

iBoxx Tadawul SAR Government Sukuk Indices: Exhibit 2

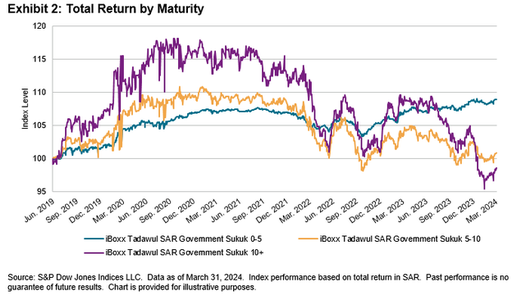
In Q1, the 0-5 year segment maintained its lead and performed the best, up 0.16%, followed by the 5-10 year maturity segment, which was down 1.43%.  The 10+ year maturity segment, which is the most sensitive to interest rate changes, dropped to an all-time low in February before recovering by 1.22% in March, bringing its Q1 return to -4.35%.

iBoxx Tadawul SAR Government Sukuk Indices: Exhibit 3

pdf-icon PD F Download Full Article

iBoxx USD Asia Ex-Japan Monthly Commentary: March 2024

Contributor Image
Jessica Tan

Principal, Fixed Income Indices

S&P Dow Jones Indices

March 2024 Commentary

The U.S. Federal Reserve, alongside the European Central Bank (ECB) and most Asian economies, maintained interest rates in March.  Swiss National Bank (SNB) became the first major central bank to cut interest rates, after having implemented multiple rate hikes in the past two years as other central banks did globally to battle inflation.  On the other hand, Japan introduced its first interest rate hike in 17 years and ended its negative interest rate regime.  Regardless of the opposing direction of interest rate changes, the U.S. dollar strengthened and appreciated against the Swiss franc, Japanese yen and most Asian currencies.

On the equities front, the S&P 500® surpassed its all-time high for the third month in a row as it rallied by 3.10%.  This brings the QTD return to 10.16%.  U.S. 10-year Treasuries, as represented by the iBoxx USD Treasuries Current 10 Year, gained 0.75% after two consecutive months of losses, and its yield decreased by 7 bps to 4.24%.  Despite the gain in March, the QTD return was -1.56%.

With an accommodative monetary policy, the Chinese yuan was no exception as it weakened against the U.S. dollar and declined to a four-month low in March, before state-owned banks came in to defend the yuan.  There was no change in benchmark lending rates after previous months of benchmark mortgage rate cuts and stimulative policy changes.  Chinese-issued U.S. dollar bonds—as represented by the iBoxx USD Asia ex-Japan China—returned

0.71%, while Chinese stocks—as represented by the S&P China 500 (USD)—climbed by 0.58%, bringing their QTD returns to 1.64% and -0.83%, respectively.

iBoxx USD Asia Ex-Japan Monthly Commentary: Exhibit 1

The Asian U.S. dollar bond market ended the month with a 0.84% gain, supported by a 1.57% rise in the high yield segment and a 0.73% rise in investment grade bonds.  The overall market gained 1.17% in the first quarter of the year.  While China Real Estate had a good month in March (up 1.66%), it remained the worst-performing segment in the past year (down 24.85%).  In contrast, China LGFVs was one of the best-performing segments, with a return of 6.99%.

pdf-icon PD F Download Full Article

S&P Target Date Scorecard: Year-End 2023

Contributor Image
Kevin Patalano

Senior Analyst, Multi-Asset Indices

S&P Dow Jones Indices

Contributor Image
Sara Pollock

Director, Multi-Asset Indices

S&P Dow Jones Indices

Overview

  • The S&P Target Date® Scorecard provides performance comparisons and analytics covering the U.S. target date fund (TDF) universe.
  • The S&P Target Date Index Series is a consensus-driven, multi-asset benchmark for TDFs. It is designed to be an accurate representation of TDFs in the U.S. market and to be the basis against which managers can assess their performance.
  • The series is constructed from indices that represent the actual allocations of funds in the U.S. target date space.
  • The assets used in the construction of the index series are all investable, and the weights are published in advance of the index series’ rebalancing.
  • S&P Dow Jones Indices also produces S&P Target Date Style Indices. The “To” style indices aim to reduce the impact of market drawdowns around the expected retirement date, while the “Through” style indices aim to mitigate longevity risk—the risk of outliving one’s assets in retirement.
  • The series consists of 13 S&P Target Date Indices, 11 S&P Target Date “To” Indices and 12 S&P Target Date “Through” Indices. New index vintages are launched in five-year intervals.

Market Commentary

2023 was a strong year across equities and fixed income after the brutal repricing of 2022.  Potentially the biggest news was that the highly anticipated U.S. recession failed to materialize, at least by official government numbers.  Consumer spending remained high as did government spending to prop up GDP. 

While the U.S. equity market was driven by positive performance in tech names, most notably the Magnificent 7, the rally was broader in scope.   9 of the 11 sectors of the S&P 500® had positive performance (all except Utilities and Energy).  Beyond the U.S., global equity markets were overall positive despite geopolitical tensions, including the ongoing Ukraine war and the conflict in the Middle East that began in October.

The bond market reversed an unheard-of two straight years of negative returns.  With softening inflation through the year and the last Fed rate hike in July, by December, markets began to anticipate rate cuts per comments from Jerome Powell.

Equities

Fixed Income

  • High Yield: High yield was the best-performing segment of the bond market within the target date index universe, despite the spread widening that occurred during the March bank crisis and October equity sell-off. The S&P 500 High Yield Corporate Bond Index posted 10.95% for the year.
  • U.S Aggregate: The back half of the year saw a trend up in bond performance as inflation continued cooling and the market began anticipating Fed rate cuts. The S&P U.S. Aggregate Bond Index finished the year up 5.77%.
  • Short-Term: Shorter dated paper had a solid performance as well, with the S&P U.S. Treasury Bond 0-1 Year Index up 5.05%.
  • TIPS: TIPS also posted a positive year, with returns dwindling in the second For 2023, the S&P U.S. TIPS Index posted 4.26%.

Commodities

  • The S&P GSCI TR started off the year rocky but reversed some of those losses in the second half of the year to finish down 4.27%. Gold was one of two commodities to finish in positive territory due to global demand fostered by a falling U.S. dollar, persistent inflation and geopolitical instability.

pdf-icon PD F Download Full Article

iBoxx Asian Local Currency Indices Monthly Commentary: March 2024

Contributor Image
Kangwei Yang

Director, Fixed Income Indices

S&P Dow Jones Indices

Monthly performance, maturity, yield and duration of the iBoxx ALBI, iBoxx ABF and iBoxx SGD Indices.

One of the key highlights in March was the decision from the Bank of Japan to increase short-term interest rates for the first time in 17 years, bringing the key rate up from -0.1% to 0%-0.1% and ending 8 years of negative interest rates.  Japan was the final central bank to move away from negative rates.  Japanese government bonds—as represented by iBoxx Global Government Japan—ended the month down 1.26% (in USD Unhedged terms).

In the same month, the U.S. Federal Reserve decided to keep rates unchanged for the fifth straight meeting, backed by higher-than-expected inflation data and a strong labor market.  U.S. Treasuries—as represented by the iBoxx $ Treasuries—reversed losses in January and February and posted a modest gain of 0.62% in March.  The overall index yield tightened by 4 bps to 4.44%.

On the equities front, the S&P 500®  continued its positive performance in March, posting 3.10% to reach another record high, having accumulated gains of more than 10% since the start of this year.  Chinese equities—as represented by the S&P China 500 (USD)—posted marginal returns of 0.58%, while the broader Asian equity market—as represented by the S&P Pan Asia Ex-Japan LargeMidCap (USD) fared better at 2.11%.

iBoxx Asian Local Bond Index (ALBI)

iBoxx Asian Local Currency Indices: Monthly Commentary: Exhibit 1

In Asian fixed income, despite gains in local markets, the overall iBoxx Asian Local Bond Index (ALBI) (USD Unhedged) retreated 0.09% due to the relative strength of the U.S. dollar against local currencies this month.

South Korea and India were on top of the pile, in local currency terms, increasing 0.99% and 0.76%, respectively.  China Onshore (up 0.16%) and Indonesia (up 0.17%) ranked the lowest (excluding Taiwan, which has 0% weight in the index) from a return perspective.  As the first quarter of 2024 ends, India and Thailand stood out with year-to-date gains of 3.18% and 2.60%, respectively.

Among eligible markets, positive returns were observed throughout the range of maturities except for China Onshore 10+ (down 0.78%) and Indonesia 7-10 (down 0.02%).  Investors favored longer-dated debt in the Offshore RMB market and South Korea, as China Offshore 10+ and South Korea 10+ posted 2.75% and 1.67% upticks, respectively.

As of the end of March, the overall index yield decreased marginally by 1 bp to 3.89%.  India remained the highest-yielding bond market in the index, posting 7.11%, while China Onshore (2.42%) represented the lowest-yielding market.


pdf-icon PD F Download Full Article

U.S. Equities Market Attributes March 2024

Contributor Image
Howard Silverblatt

Senior Index Analyst, Product Management

S&P Dow Jones Indices

Key Highlights

Exhibit 1: Index Returns - U.S. Equities March 2024

MARKET SNAPSHOT

And the beat goes on, as the S&P 500 posted eight new closing highs in March (ending on one of them) to total 22 YTD (at that rate we would replace 1995’s record of 77 new closing highs), even as the Magnificent Seven turned into the Gang of Four, all while breadth widened and the other 493 issues were up 6.4% YTD.  The S&P 500 continued its onward-and-upward trades in March (up 3.10%), breaking through the 5,100 and 5,200 level (5,254.35 high and 5,264.85 intraday high).  The five-month run (cumulatively 25.29%) has added USD 8.9 trillion into shareholder pockets (Microsoft [MSFT], Apple [AAPL], Nvidia (NVDA] and Amazon.com [AMZN] now total USD 9.5 trillion in market cap), with the government planning on getting its share (2023 tax revenues are rising due to 2023 stock gains).

The Magnificent Seven (29% of the market value of the S&P 500) accounted for 37% of the YTD return (of 10.16%), but a new Gang of Four (18% of the S&P 500) has emerged, as Nvidia, Microsoft, Meta Platforms (META) and Amazon.com, with their gains accounting for 47% of the YTD return, left the remaining three in the dust (Tesla [TSLA] was down 29.3% YTD, the worst issue in the index, Boeing [BA] was the second worst, at -26.0% YTD, while Apple was down 10.9% YTD).  Breadth improved for the month and was strongly positive (402 up and 100 down, compared with last month’s 351 up and 151 down); all 11 sectors gained.  YTD breadth remained strong (369 up and 134 down) and 10 of the 11 sectors were up, with the gain from the end of 2022 (2023 was up 24.23%) an impressive 36.85%; of course, 2021 wasn’t that good (-19.44%), so the gain for the two-and-one-quarter-year period is 10.24%—a tick better than the YTD 10.06% (what a long, strange trip it’s been).

The key question, however, remains the same: what to do now?  The trades are positive, with money managers staying in and some new money coming in (and a lot more waiting on the side, while being paid to be there).  Earnings are good, interest rates are off their peak (with short-term rates appearing to have the government’s upward support) and employment remains high (and unemployment low), with consumers willing to spend their paychecks (be it a bit more selectively).  So the market continues up, with the U.S. appearing to be in the best relative shape for solid growth, even if it doesn’t have the largest potential for growth.

During April, missing for the first time since September 2023 will be the concern over a government shutdown, but rest assured the new budget deadline of Sept. 30, 2024 (which is before the presidential election), will arrive soon.  Playing their part in April are the usual CPI, PPI and PCE characters, as well as employment reports (employment, claims, availability).  Earnings season starts Friday, April 12 (JPMorgan Chase [JPM], State Street [STT] and Wells Fargo [WFC]), with the quarter expected to tick up from Q4 2023 (with the whisper number at a 2% level) and dominate the trades, while politics continues to dominate the headlines (as well as the fundraising).  The Fed fear, which hasn’t been significant lately (but its comments and dot matrices have had a market impact), will be faced as it meets at the end of the month (April 30-May 1), with the Street and Fed expecting three rate cuts this year (the Street is expecting the first one in June), as the definition of higher for longer has been fully accepted.


Processing ...