IN THIS LIST

iBoxx Asian Local Currency Indices Monthly Commentary: March 2024

S&P Target Date Scorecard: Year-End 2023

U.S. Equities Market Attributes March 2024

2023 Fixed Income Index Products Annual Report

iBoxx Asian Local Currency Indices Monthly Commentary: February 2024

iBoxx Asian Local Currency Indices Monthly Commentary: March 2024

Contributor Image
Kangwei Yang

Director, Fixed Income Indices

S&P Dow Jones Indices

Monthly performance, maturity, yield and duration of the iBoxx ALBI, iBoxx ABF and iBoxx SGD Indices.

One of the key highlights in March was the decision from the Bank of Japan to increase short-term interest rates for the first time in 17 years, bringing the key rate up from -0.1% to 0%-0.1% and ending 8 years of negative interest rates.  Japan was the final central bank to move away from negative rates.  Japanese government bonds—as represented by iBoxx Global Government Japan—ended the month down 1.26% (in USD Unhedged terms).

In the same month, the U.S. Federal Reserve decided to keep rates unchanged for the fifth straight meeting, backed by higher-than-expected inflation data and a strong labor market.  U.S. Treasuries—as represented by the iBoxx $ Treasuries—reversed losses in January and February and posted a modest gain of 0.62% in March.  The overall index yield tightened by 4 bps to 4.44%.

On the equities front, the S&P 500®  continued its positive performance in March, posting 3.10% to reach another record high, having accumulated gains of more than 10% since the start of this year.  Chinese equities—as represented by the S&P China 500 (USD)—posted marginal returns of 0.58%, while the broader Asian equity market—as represented by the S&P Pan Asia Ex-Japan LargeMidCap (USD) fared better at 2.11%.

iBoxx Asian Local Bond Index (ALBI)

iBoxx Asian Local Currency Indices: Monthly Commentary: Exhibit 1

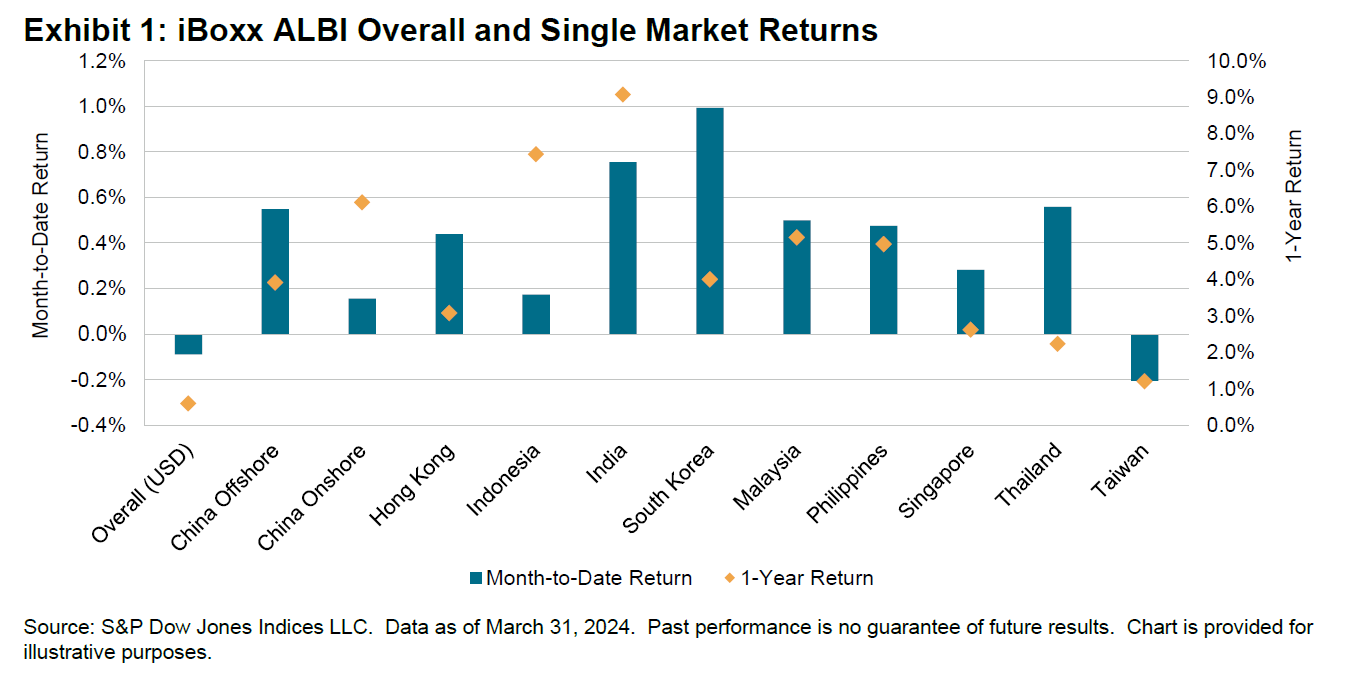
In Asian fixed income, despite gains in local markets, the overall iBoxx Asian Local Bond Index (ALBI) (USD Unhedged) retreated 0.09% due to the relative strength of the U.S. dollar against local currencies this month.

South Korea and India were on top of the pile, in local currency terms, increasing 0.99% and 0.76%, respectively.  China Onshore (up 0.16%) and Indonesia (up 0.17%) ranked the lowest (excluding Taiwan, which has 0% weight in the index) from a return perspective.  As the first quarter of 2024 ends, India and Thailand stood out with year-to-date gains of 3.18% and 2.60%, respectively.

Among eligible markets, positive returns were observed throughout the range of maturities except for China Onshore 10+ (down 0.78%) and Indonesia 7-10 (down 0.02%).  Investors favored longer-dated debt in the Offshore RMB market and South Korea, as China Offshore 10+ and South Korea 10+ posted 2.75% and 1.67% upticks, respectively.

As of the end of March, the overall index yield decreased marginally by 1 bp to 3.89%.  India remained the highest-yielding bond market in the index, posting 7.11%, while China Onshore (2.42%) represented the lowest-yielding market.


pdf-icon PD F Download Full Article

S&P Target Date Scorecard: Year-End 2023

Contributor Image
Kevin Patalano

Senior Analyst, Multi-Asset Indices

S&P Dow Jones Indices

Contributor Image
Sara Pollock

Director, Multi-Asset Indices

S&P Dow Jones Indices

Overview

  • The S&P Target Date® Scorecard provides performance comparisons and analytics covering the U.S. target date fund (TDF) universe.
  • The S&P Target Date Index Series is a consensus-driven, multi-asset benchmark for TDFs. It is designed to be an accurate representation of TDFs in the U.S. market and to be the basis against which managers can assess their performance.
  • The series is constructed from indices that represent the actual allocations of funds in the U.S. target date space.
  • The assets used in the construction of the index series are all investable, and the weights are published in advance of the index series’ rebalancing.
  • S&P Dow Jones Indices also produces S&P Target Date Style Indices. The “To” style indices aim to reduce the impact of market drawdowns around the expected retirement date, while the “Through” style indices aim to mitigate longevity risk—the risk of outliving one’s assets in retirement.
  • The series consists of 13 S&P Target Date Indices, 11 S&P Target Date “To” Indices and 12 S&P Target Date “Through” Indices. New index vintages are launched in five-year intervals.

Market Commentary

2023 was a strong year across equities and fixed income after the brutal repricing of 2022.  Potentially the biggest news was that the highly anticipated U.S. recession failed to materialize, at least by official government numbers.  Consumer spending remained high as did government spending to prop up GDP. 

While the U.S. equity market was driven by positive performance in tech names, most notably the Magnificent 7, the rally was broader in scope.   9 of the 11 sectors of the S&P 500® had positive performance (all except Utilities and Energy).  Beyond the U.S., global equity markets were overall positive despite geopolitical tensions, including the ongoing Ukraine war and the conflict in the Middle East that began in October.

The bond market reversed an unheard-of two straight years of negative returns.  With softening inflation through the year and the last Fed rate hike in July, by December, markets began to anticipate rate cuts per comments from Jerome Powell.

Equities

Fixed Income

  • High Yield: High yield was the best-performing segment of the bond market within the target date index universe, despite the spread widening that occurred during the March bank crisis and October equity sell-off. The S&P 500 High Yield Corporate Bond Index posted 10.95% for the year.
  • U.S Aggregate: The back half of the year saw a trend up in bond performance as inflation continued cooling and the market began anticipating Fed rate cuts. The S&P U.S. Aggregate Bond Index finished the year up 5.77%.
  • Short-Term: Shorter dated paper had a solid performance as well, with the S&P U.S. Treasury Bond 0-1 Year Index up 5.05%.
  • TIPS: TIPS also posted a positive year, with returns dwindling in the second For 2023, the S&P U.S. TIPS Index posted 4.26%.

Commodities

  • The S&P GSCI TR started off the year rocky but reversed some of those losses in the second half of the year to finish down 4.27%. Gold was one of two commodities to finish in positive territory due to global demand fostered by a falling U.S. dollar, persistent inflation and geopolitical instability.

pdf-icon PD F Download Full Article

U.S. Equities Market Attributes March 2024

Contributor Image
Howard Silverblatt

Senior Index Analyst, Product Management

S&P Dow Jones Indices

Key Highlights

Exhibit 1: Index Returns - U.S. Equities March 2024

MARKET SNAPSHOT

And the beat goes on, as the S&P 500 posted eight new closing highs in March (ending on one of them) to total 22 YTD (at that rate we would replace 1995’s record of 77 new closing highs), even as the Magnificent Seven turned into the Gang of Four, all while breadth widened and the other 493 issues were up 6.4% YTD.  The S&P 500 continued its onward-and-upward trades in March (up 3.10%), breaking through the 5,100 and 5,200 level (5,254.35 high and 5,264.85 intraday high).  The five-month run (cumulatively 25.29%) has added USD 8.9 trillion into shareholder pockets (Microsoft [MSFT], Apple [AAPL], Nvidia (NVDA] and Amazon.com [AMZN] now total USD 9.5 trillion in market cap), with the government planning on getting its share (2023 tax revenues are rising due to 2023 stock gains).

The Magnificent Seven (29% of the market value of the S&P 500) accounted for 37% of the YTD return (of 10.16%), but a new Gang of Four (18% of the S&P 500) has emerged, as Nvidia, Microsoft, Meta Platforms (META) and Amazon.com, with their gains accounting for 47% of the YTD return, left the remaining three in the dust (Tesla [TSLA] was down 29.3% YTD, the worst issue in the index, Boeing [BA] was the second worst, at -26.0% YTD, while Apple was down 10.9% YTD).  Breadth improved for the month and was strongly positive (402 up and 100 down, compared with last month’s 351 up and 151 down); all 11 sectors gained.  YTD breadth remained strong (369 up and 134 down) and 10 of the 11 sectors were up, with the gain from the end of 2022 (2023 was up 24.23%) an impressive 36.85%; of course, 2021 wasn’t that good (-19.44%), so the gain for the two-and-one-quarter-year period is 10.24%—a tick better than the YTD 10.06% (what a long, strange trip it’s been).

The key question, however, remains the same: what to do now?  The trades are positive, with money managers staying in and some new money coming in (and a lot more waiting on the side, while being paid to be there).  Earnings are good, interest rates are off their peak (with short-term rates appearing to have the government’s upward support) and employment remains high (and unemployment low), with consumers willing to spend their paychecks (be it a bit more selectively).  So the market continues up, with the U.S. appearing to be in the best relative shape for solid growth, even if it doesn’t have the largest potential for growth.

During April, missing for the first time since September 2023 will be the concern over a government shutdown, but rest assured the new budget deadline of Sept. 30, 2024 (which is before the presidential election), will arrive soon.  Playing their part in April are the usual CPI, PPI and PCE characters, as well as employment reports (employment, claims, availability).  Earnings season starts Friday, April 12 (JPMorgan Chase [JPM], State Street [STT] and Wells Fargo [WFC]), with the quarter expected to tick up from Q4 2023 (with the whisper number at a 2% level) and dominate the trades, while politics continues to dominate the headlines (as well as the fundraising).  The Fed fear, which hasn’t been significant lately (but its comments and dot matrices have had a market impact), will be faced as it meets at the end of the month (April 30-May 1), with the Street and Fed expecting three rate cuts this year (the Street is expecting the first one in June), as the definition of higher for longer has been fully accepted.


2023 Fixed Income Index Products Annual Report

Contributor Image
Nicholas Godec

Senior Director, Head of Fixed Income Tradables & Private Markets

S&P Dow Jones Indices

Contributor Image
Srichandra Masabathula

Director, Fixed Income Tradable Products

S&P Dow Jones Indices

Introduction

The year 2023 was marked by significant events that affected global financial markets, including a bear market for most of the year, geopolitical conflicts, the U.S. regional banking crisis and the UBS acquisition of Credit Suisse.  These events contributed to heightened market volatility and shifts in trading volumes across various financial instruments.  This report aims to highlight the tradeable volumes in index products linked to key S&P DJI credit indices, with a focus on exchange-traded funds (ETFs), credit default swap (CDS) Indices, standardized total return swaps (TRS) and futures.  Finally, we close with an analysis of the bid-ask spreads across these products and on the individual bonds that comprise key iBoxx indices.

Credit Spreads and Volatility

After consistent interest rate hikes in 2022 across the U.S. and European markets, 2023 started off with expectations of interest rates peaking during the year.  These expectations manifested in credit spreads tightening in the first two months of 2023, as well as a decrease in the market’s expectations of future credit volatility as indicated by the Credit VIX® indices.  However, these expectations were relatively short lived, with credit spreads spiking in March 2023 due to stress in the U.S. regional banking sector and concerns related to the potential default of Credit Suisse prior to its acquisition by UBS.

As wider repercussions of the banking sector events were avoided, credit spreads recovered and set off on a consistent path of tightening over the following few months.  Since April 2023, the market’s expectations of credit volatility across the North American and European investment grade and high yield credit markets have been on a downward trend, barring a brief period in October, which saw a rise in credit spreads and expected credit volatility.

Overall, spreads across all major credit markets ended the year tighter than when had started, driven by the U.S. Federal Reserve Bank and the European Central Bank halting interest rate hikes in the second half of 2023 and the market pricing in potential interest rate cuts in 2024.

The charts in Exhibit 1 illustrate the progression of credit spreads over the course of 2023 across global credit markets, as indicated by the relevant iTraxx/CDX index spreads and the iBoxx bond index option-adjusted spreads.  For the U.S. and European markets, the relevant Credit VIX indices indicate the market’s expectations of credit volatility over the following one-month period.

Progression of Credit Spreads over 2023 across Global Credit Markets: Exhibit 1

pdf-icon PD F Download Full Article

iBoxx Asian Local Currency Indices Monthly Commentary: February 2024

Contributor Image
Kangwei Yang

Director, Fixed Income Indices

S&P Dow Jones Indices

Monthly performance, maturity, yield and duration of the iBoxx ALBI, iBoxx ABF and iBoxx SGD Indices.

Since the start of the year, the option-adjusted spreads (OAS) for investment grade U.S. corporate bonds—as represented by the iBoxx $ Corporates—were range-bound between 104 to 120 bps.  The last time bonds were trading in this range was toward the tail-end of 2021.  As a result, corporate issuers may be looking take advantage of the current lower borrowing cost environment.  However, from the perspective of the lender, they would be compensated less for the additional risk they undertake (over risk-free instruments) compared to the past two years.

As the next U.S. FOMC meeting is drawing near in March, the S&P 500® was buoyant, up 5.17% in February and closing at an all-time high, led by gains in technology and AI.  Chinese stocks—as represented by the S&P China 500 (USD)—also bounced back from losses in January and posted 9.08% in February.  At the same time, the broader S&P Pan Asia Ex-Japan LargeMidCap (USD) gained 4.22%.

While the equity markets cheered, results were mixed in global bond markets.  U.S. Treasuries—as represented by iBoxx $ Treasuries—continued accumulating losses in 2024 and declined 1.38% in February.  Asian local currency markets, however, provided some bright spots—to be discussed in the following sections.

iBoxx Asian Local Bond Index (ALBI)

iBoxx Asian Local Currency Indices: Monthly Commentary: Exhibit 1

In Asian fixed income, Asian local currency bonds—as represented by the iBoxx Asian Local Bond Index (ALBI) (USD Unhedged)—gained a marginal 0.06% in February with mixed performance in the local markets (and local currencies against the U.S. dollar).

India and Thailand, in local currency terms, were the top-performing local markets as they continued their momentum into February, posting 1.20% and 1.07%, respectively.  Both China On-and Offshore markets also recorded modest gains.  At the bottom of the pack were Singapore and South Korea, down 0.93% and 0.66%, respectively.  

For most local markets, gains or losses tended to extend across the whole term structure.  China Onshore 10+ and India 10+ stood out this month, posting 2.75% and 1.87%, respectively.  On the flipside, Hong Kong 10+ (down 2.20%) and Singapore 10+ (down 2.15%) were the worst-performing segments.

As of the end of February, the overall index yield increased marginally by 2 bps to 3.90%.  India remained the highest-yielding bond market in the index, posting 7.13%, while China Onshore (2.41%) represented the lowest-yielding market.


pdf-icon PD F Download Full Article

Processing ...