IN THIS LIST

iBoxx Asian Local Currency Indices Monthly Commentary: April 2024

iBoxx USD Asia Ex-Japan Monthly Commentary: April 2024

U.S. Equities Market Attributes April 2024

S&P Kensho New Economies Commentary: Q1 2024

iBoxx USD Emerging Markets Monthly Commentary: March 2024

iBoxx Asian Local Currency Indices Monthly Commentary: April 2024

Contributor Image
Kangwei Yang

Director, Fixed Income Indices

S&P Dow Jones Indices

Monthly performance, maturity, yield and duration of the iBoxx ALBI, iBoxx ABF and iBoxx SGD Indices.

The wait for the next change in U.S. Fed funds rate continues.  As widely predicted by market analysts, the latest FOMC meeting that ended on May 1 concluded with no change in the key rate, which remained at its 5.25%-5.50% range, citing sticky inflation data and resilient economic growth.  As April 2024 ended, U.S. Treasuries—as represented by the iBoxx $ Treasuries—lost 2.39%, giving up the small gains seen in March.

In Asia, Bank Indonesia surprised the markets by raising its key seven-day reverse repo rate by 25 bps to 6.25% to provide support for the Indonesian rupiah.

This month, we also had a look into the YTD performance of USD corporate markets.  Broadly speaking, Asian USD bonds performed better than broad USD indices across both investment grade and high yield segments.  The outperformance was more pronounced in high yield bonds, with the Asian USD high yield segment—as represented by iBoxx USD Asia ex-Japan High Yield—up 5.24% YTD, compared to 0.47% in broad USD high yield markets—as represented by iBoxx USD High Yield Developed Markets.  One of the key contributors was China-issued USD high yield bonds, which have returned 7.29% so far this year, a stark contrast to a loss of 14.58% in 2023.

iBoxx Asian Local Bond Index (ALBI)

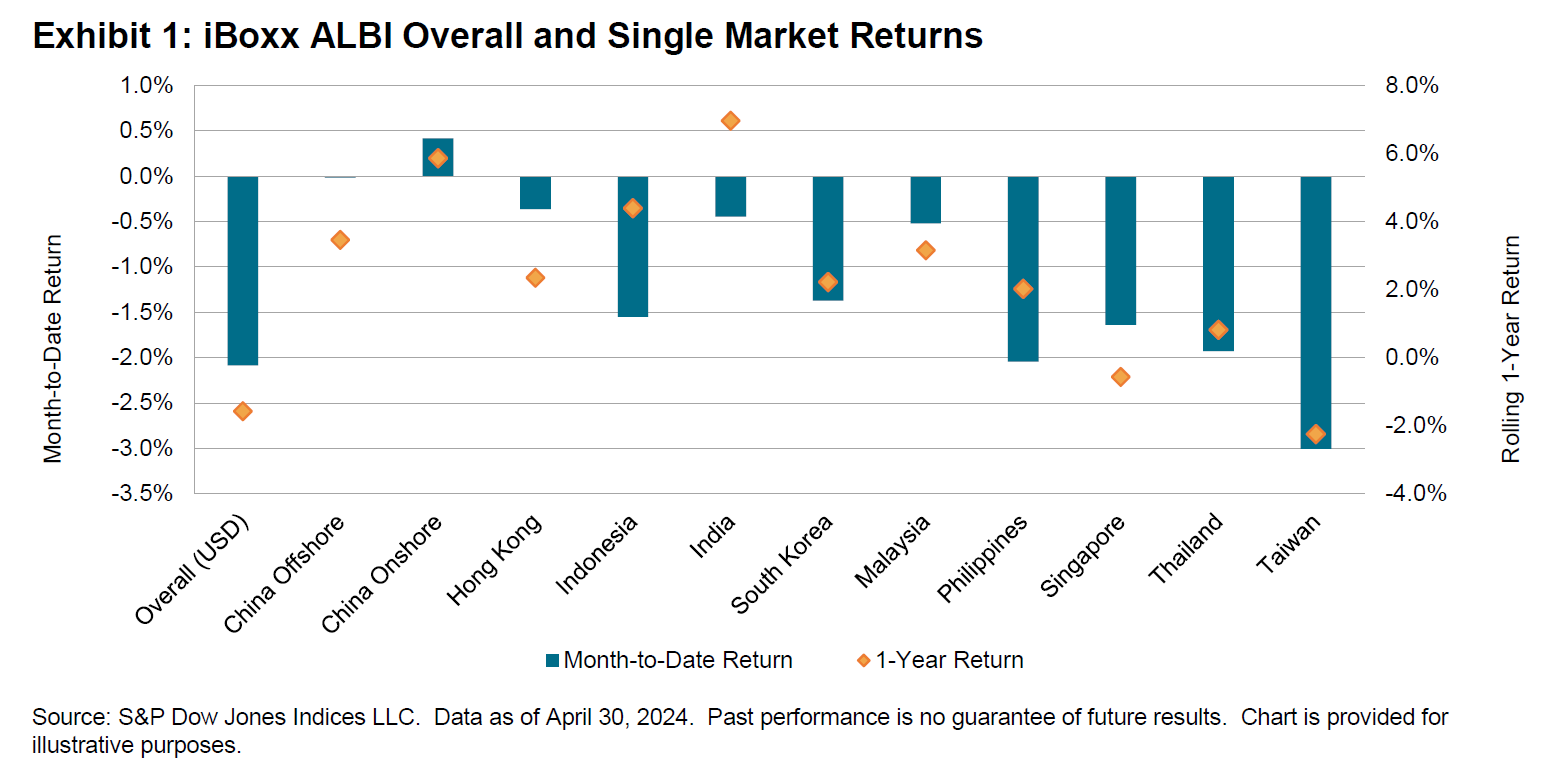
iBoxx Asian Local Currency Indices: Monthly Commentary: Exhibit 1

Most Asian markets represented in the iBoxx Asian Local Bond Index (ALBI) retreated in April.  Additionally, most local currencies (except the Hong Kong dollar and offshore RMB) depreciated against the greenback.  As a result, the overall index—in USD unhedged terms—lost 2.08%.

In local currency terms, China Onshore was the only market that recorded gains last month, up 0.42%.  All other markets pulled back, with the Philippines (down 2.05%) and Thailand (down 1.93%) being the worst-performing markets in the index (excluding Taiwan as it has 0% weight in the index).

Across the yield curve, most markets observed gains at the short end, with India 1-3 the highest with a modest 0.37% uptick.  In the 10+ segment, most markets (except China Onshore and China Offshore) posted losses, with the Philippines 10+ (down 5.20%) and Singapore 10+ (down 4.25%) faring the worst.  China Onshore was the only market with gains across maturities.

As of the end of April, the overall index yield decreased marginally by 17 bps to 4.06%.  India remained the highest-yielding bond market in the index, posting 7.26%, while China Onshore (2.38%) represented the lowest-yielding market.

pdf-icon PD F Download Full Article

iBoxx USD Asia Ex-Japan Monthly Commentary: April 2024

Contributor Image
Jessica Tan

Principal, Fixed Income Indices

S&P Dow Jones Indices

April 2024 Commentary

Following persistent inflation numbers in March, the U.S. Federal Reserve (Fed) expressed that it would take longer to tame inflation to its 2% target and signaled that higher-for-longer interest rates would be in the cards for the U.S. economy.  Interest rates remained unchanged for the Fed, European Central Bank (ECB) and most Asian economies.  During the same period, the U.S. dollar continued to strengthen and appreciated against most Asian currencies.  Unlike its neighbors in the region, Bank Indonesia opted for a rate hike of 25 bps to 6.25% to support its own currency against the dollar, geopolitical risks and inflation.

On the equities front, the S&P 500® fell 4.16% in April after a double-digit return of 10.16% in the first quarter.  10-year U.S. Treasuries, as represented by the iBoxx USD Treasuries Current 10 Year, lost 3.47%, and their yield increased by 50 bps to 4.74%, reverting to levels last seen in November 2023.

China’s benchmark lending rate was left unchanged in April after a stronger-than-expected GDP growth of 5.3% was reported for Q1.  With an economic growth target of 5% in 2024, China policymakers have pledged to provide more support for the economy with additional monetary and fiscal policies.  To fund the increasing fiscal expenditures, China is expected to issue CNY 1 trillion of ultra-long-term special treasury bonds and speed up the issuance of local government special bonds.  Chinese-issued U.S. dollar bonds—as represented by the iBoxx USD Asia ex-Japan China—returned -0.39%, while Chinese stocks—as represented by the S&P China 500 (USD)—climbed by 4.05%, moving in the opposite direction of their respective Q1 returns of 1.64% and -0.83%.

iBoxx USD Asia Ex-Japan Monthly Commentary: Exhibit 1

Following gains across the board in March, all key sectors of the Asian U.S. dollar bond market reversed their gains in April and the overall market ended the month with a 1.07% loss, largely contributed by a 1.23% loss in the investment grade segment.  The high yield segment held up relatively better, only retreating 0.05%.  China Real Estate sustained its momentum from last month and gained another 1.31% in April.  Both the high yield and China LGFV segments performed well over the past year, with returns exceeding 5%.

pdf-icon PD F Download Full Article

U.S. Equities Market Attributes April 2024

Contributor Image
Howard Silverblatt

Senior Index Analyst, Product Management

S&P Dow Jones Indices

Key Highlights

Index Returns - U.S. Equities April 2024: Exhibit 1

Market Snapshot

April’s -4.16% return for the S&P 500 stirred but did not shake the index’s 5,000 level; thanks to its Q1 2024 10.16% gain, the index still ended April with a positive YTD level of 5.57%.  The current level appears to be in the area of a defendable support level.  A significant amount of money is being directly put into the U.S. economy by our friends in Washington (a minimum of USD 34 billion via the recent Israel/Taiwan/Ukraine legislation for U.S. replenishment and USD 39 billion via the CHIP and Science Act in grants and loans for U.S. production), employment (with paychecks) remains high, and current actual earnings (and cash flow) are good (but the guidance not as much—even as Q2, Q3 and Q4 2024 have record estimates), as the U.S. was seen as having the best growth (and stability) potential globally.

While guidance headlines were protested, actual earnings are coming in above the 1% estimated gain (76.8% beat rate) and above the whispered 2.5% rate (2.7% at this point, and up 5.4% year-over-year), with sales 4.1% below the record Q4 2023 level (which is typical—something about the holiday sales), but up 4.1% year-over-year.  Economic data came in on all sides (recession, the new concerns for stagnation, growth), adding volatility, but in the end, it was earnings and fundamentals (along with some implied projections from the data) that ruled the trades.

Year-to-date, the S&P 500 remained up 5.57% (with 10 of the 11 sectors up; Real Estate was down 9.86%), as breadth declined but remained positive (302 up and 199 down, compared to last March’s 369 and 134 YTD, respectively).  The Magnificent 7 as a group still dominated, accounting for 51% of the index return (which included Apple’s 11.5% YTD decline and Tesla’s 26.2% YTD decline), as NVIDIA (up 74.5% YTD) represented 41% of the S&P 500’s YTD gain.  And while not magnificent (unless you were a short seller), Boeing (BA; with many seeing it as a long-term buy) was the third-worst issue in the index, down 35.6% YTD.

Treasury Secretary Yellen made her second trip to China, as she attempted to get the country to reduce its exports and focus on growth through domestic demand.  At the core of her discussions were what the U.S. considered artificially cheap Chinese export products, which threaten U.S. (and foreign) firms.  Biden called to triple the 7.5% tariffs (under Section 301 of the U.S. Trade Act) on imported Chinese steel and aluminum (which Trump started in 2017).  The U.S. continued to encourage domestic chip manufacturing (via the CHIPS and Science Act), as it awarded Samsung Electronics USD 6 billion, Micron Technology (MU) USD 6.1 billion and Taiwan Semiconductor Manufacturing (TSM) USD 6.6 billion; previously it had awarded Intel (INTC) USD 8.5 billion; USD 10 billion remains in the program to be awarded.


S&P Kensho New Economies Commentary: Q1 2024

The S&P Kensho New Economy Indices seek to track the industries and innovation of the Fourth Industrial Revolution

The global equity markets continued their rally in Q1 2024, with the
S&P Global BMI posting 7.8% quarterly gains and reaching a new
record high. The performance breadth was healthy, with 38 of the 47
countries represented contributing positively to the quarterly gains.
Among the major economies, Japan (S&P/TOPIX 150, 20.4%) was a
notable outperformer, while China (S&P China 500, 1.1%) stabilized
after reaching a five-year low in the previous quarter. The U.S.
equities-focused S&P Composite 1500® had a strong start to the year,
up 10.3%, with healthy contributions from large caps (up 10.6%) and
mid caps (up 10%), but notable weakness from the small caps (up
2.5%).

Within the S&P 500®, the rate-sensitive Real Estate sector, the top
performer in Q4 2023, was the only negatively performing sector
(down 0.6%). Financials (up 12.5%) was a strong sector performer
of this quarter, slightly lower than the top performing Energy sector
(up 13.6%). More importantly, 86% of the index constituents moved
above their 200-day moving average, signaling an improvement in
the performance breadth. Overall equity fund flows were robust this
quarter, accompanied by pickup in Energy sector inflows. Most S&P
500 factors posted positive quarterly returns, with momentum (up
22.6% for the quarter) taking the top spot (five of the Magnificent
Seven stocks make up 44% of the index weight), significantly
outperforming the S&P 500 over the past 12 months (up 49%). The
low volatility factor (up 5.8%) was at the bottom of the first quarter
factors league table. Positive quarterly returns were posted by 17 of
the 25 New Economies subsectors, led by Smart Borders (up 15.7%) and Nanotechnology (up 10.5%), which outperformed the S&P Composite 1500. The Financials-related New Economies sector of Democratized Banking (up 5%) was among the top-performing sectors. In contrast, buffeted by higher rates and weaker sentiment, the renewables-focused Clean Power sector (-9.6%) was the biggest underperformer. Outside of the New Economies, artificial intelligence-themed indices—S&P Kensho Artificial Intelligence Enablers Index (up 14.2%), S&P Kensho Global Artificial Intelligence Enablers Index (up 12.2%), S&P Kensho Artificial Intelligence Enablers & Adopters Index (up 17%)—were strong performers, boosted from sustained investor optimism around these technologies.

Backward-looking macro data indicators confirmed the market’s steady optimism on the U.S. economy. Q4 2023 U.S. corporate earnings materially beat expectations, though they were set lower going into the earnings season. The U.S. economy grew by 3.3%, versus the 2% projected for Q4 2023, with The Conference Board’s Leading Economic Indicator inching higher in February. Consumer spending underpinned a robust U.S. economy, buoyed by strong jobs data and wages. Nonetheless, consumer sentiment has been stagnant in the past six months. Inflation prints continued to dictate the Fed and market’s expectations of rate cuts, which were pushed further back this quarter. Higher than expected CPI prints in January and February quickly prompted the market to reprice the expected Fed rate cuts in 2024 from six to about three. The Fed, which also dealt with sticky inflation in the 1970s, has maintained a cautiously optimistic stance for rate cuts this year. Outside of the U.S., inflation has also risen across the globe so far this year.

Persistent inflation drove the rise of U.S. Treasury yields over the quarter, reversing the previous quarter’s course. The 2-10 Year U.S. Treasury curve spread moved sideways, extending its stay in the negative territory to more than 18 months. The iBoxx USD Treasuries Index’s recovery from the previous quarter was short lived, as it fell in Q1 2024 (by 1.00%), as did the S&P Eurozone Sovereign Bond Index (-0.42%). Expectations shifted in the past three months, with the European Central Bank (ECB) indicating that it’s open to rate cuts in the summer, even as the market’s Fed rate cut expectations in June have been scaled back. The S&P U.S. Treasury Bill Index (1.28%) managed to eke out a positive performance, while relatively lower duration and easing financial conditions aided the iBoxx USD Liquid Leveraged Loans (2.18%) and iBoxx USD Liquid High Yield (1.30%) outperformances versus the iBoxx USD Liquid Investment Grade (-0.72%).

The commodities (S&P GSCI) space was a spirited partner to equities, gaining 10.4% during the quarter. Crude oil was the primary driver as it steadily retraced nearly all its Q4 2023 losses in its march toward USD 90. Natural gas (down 21.3%) was a notable underperformer within the Energy sector, touching a decade-low from oversupply and seasonally low available storage capacity. Despite rising U.S. real yields, increasing central bank purchases bolstered gold (7.0%) to new record highs, with silver prices (3.8%) also moving higher. Industrial Metals (0.3%), along with Agriculture commodities (0.9%), barely moved. Global manufacturing PMI rose for two consecutive months in February and turned positive this quarter for the first time since August 2022.

pdf-icon PD F Download Full Article

iBoxx USD Emerging Markets Monthly Commentary: March 2024

Contributor Image
Catalina Zota

Associate Director, Fixed Income Product Management

S&P Dow Jones Indices

iBoxx USD Emerging Market Indices Overview

In January 2024, S&P Dow Jones Indices launched the iBoxx USD Emerging Markets Broad Overall Indices.  The index suite represents the most comprehensive fixed income hard currency snapshot of the market due to its broad methodology construction.  To enter the index, bonds must have a minimum notional amount of USD 250 million and no minimum time to maturity is required.  As of March 31, 2024, the index has 2,991 bonds covering sovereigns, sub-sovereigns, corporates and covered bonds, and has a market value of USD 2.4 trillion.

The iBoxx USD Emerging Markets Broad Sovereigns & Sub-Sovereigns Index is a headline index within the iBoxx USD Emerging Markets Broad Overall Series.  The index is a simple market-capitalization-weighted benchmark covering sovereign and sub-sovereign entities domiciled in emerging markets.  As of March 31, 2024, the index included 952 bonds from 144 issuers.  The index serves as the underlying benchmark for the iBoxx USD Liquid Emerging Markets Sovereigns & Sub-Sovereigns Index.

The iBoxx USD Liquid Emerging Markets Sovereigns & Sub-Sovereigns Index measures the performance of USD-denominated sovereign and sub-sovereign bonds issued by emerging markets entities.  The index rules select only bonds with at least USD 1 billion in notional amount outstanding and one year to maturity.  Within the emerging markets, the index focuses on economies whose gross national income (GNI) per capita is below two times the World Bank high income GNI cut-off.  GCC countries are also eligible for the index regardless of their GNI.  A country capping is applied and reviewed annually in December, and the current cap is 7.5%.  The index is designed to be used as part of the iBoxx tradable ecosystem.

The iBoxx USD Emerging Markets Broad Corporates Index is a headline index within the iBoxx USD Emerging Markets Broad Overall Series.  The index is a simple market-capitalization-weighted benchmark that covers corporate and covered bonds issued by emerging markets issuers.  As of March 31, 2024, the index included 2,039 bonds from 849 issuers.

March 2024 Commentary

Market Overview:

U.S. fiscal policy has been steady since the beginning of 2024.  According to the U.S. Bureau of Labor Statistics, the CPI increased 0.4% in February after rising 0.3% in January 2024.  Over the past 12 months, inflation in the U.S. reached 3.2%, fueled by shelter and gasoline.  Based on the FOMC dot plot released on March 20, 2024, the Fed’s target rate is around 4.25%-4.50%, which implies three rate cuts in 2024.  The overnight repo rate, a measure of market liquidity, ranged between 5.31-5.32%, unchanged from February.  On the equities side, the S&P 500® was up 3.1% in March, driven by the performance of the Information Technology sector.

With the U.S. as a backdrop, Mexico’s and Brazil’s central banks moved forward with rate cuts.  Mexico’s benchmark interest rate was cut to 11% from 11.25% last month.  Brazil’s Selic rate dropped to 10.75%, the lowest level since March 2022.  Promises from Argentina’s President Javier Milei of economic reform, government reduction and taming of the spiraling inflation—276.2% year over year brought new enthusiasm to the bond market. On March 11, the country started the process to refinance $50 billion worth of ARS-denominated bonds maturing between 2025 and 2028.  The news contributed to a rally in the Argentinian bond market—also reflected in the current iBoxx USD Emerging Market monthly returns.  

pdf-icon PD F Download Full Article

Processing ...