September 2024 S&P Capital IQ Pro Release Notes
Table of Contents September 2024 S&P Capital IQ Pro Release Notes
In this release, we added new datasets and tools on Capital IQ Pro designed to enhance your daily workflows:
We launched the US Midday IQ newsletters to provide users with essential market updates, breaking news, and mid-day trading insights delivered to their inbox every afternoon. We enhanced our Government, Sovereign, Agency, and Corporate (GSAC) securities offering by adding a new Dashboard widget to track the top movers throughout the day as well as new data items and visualization tools to enhance your fixed income analysis. We improved Search by adding intuitive search capabilities for Topics and Market Maps, enhancing query suggestions and spell-check capabilities, and upgrading our company display information. We added Dashboard Templates and enhancements to improve the user experience of the Dashboard Template Library, including the ability to view thumbnail previews and a description field for each template. We enriched our Private Markets offering by integrating Private Debt data across firms, funds, and institutional investors in the S&P Capital IQ Pro Plug-in and Screener for premium private debt users.
Visit S&P Capital IQ Pro and Contact Us for additional details. Alerts
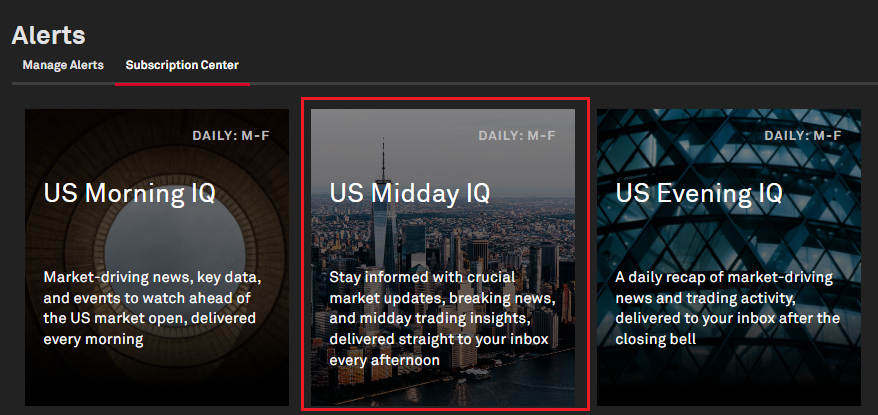
We are excited to introduce the US Midday IQ newsletter in this release. This newsletter is designed to help users stay informed with crucial market updates, breaking news, and mid-day trading insights, delivered straight to their inbox every afternoon.
US Midday IQ Newsletter
Users now have the option to subscribe to the US Midday IQ Newsletter. This newsletter is designed to help users stay informed with crucial market updates, breaking news, and trading insights in the middle of the US trading day.
Find it in the platform:
- Navigate to News from the top navigation menu
- Under More Insights, click IQ Newsletters to directly access the Subscription Center and subscribe to the all-new IQ Newsletters
- Or click on the Bell icon on the right side of the top navigation
- Select Manage Alerts
- Click Subscription Center and subscribe to the all-new IQ Newsletters
Fixed Income
In this release, we further enhanced our Government, Sovereign, Agency and Corporate (GSAC) securities offering by enhancing the Dashboard's widget and functionality as well as additional data fields to our new Bond Detail page, Screener and S&P Capital IQ Pro Plug-in. We enhanced the Dashboard's Top Loan Movers widget to include the current day's live GSAC prices and renamed it to "Top Fixed Income Movers". We also added Regulatory information and S&P Ratings Recovery Ratings to our new Bond Detail page.
Fixed Income Top Movers Widget in Dashboard
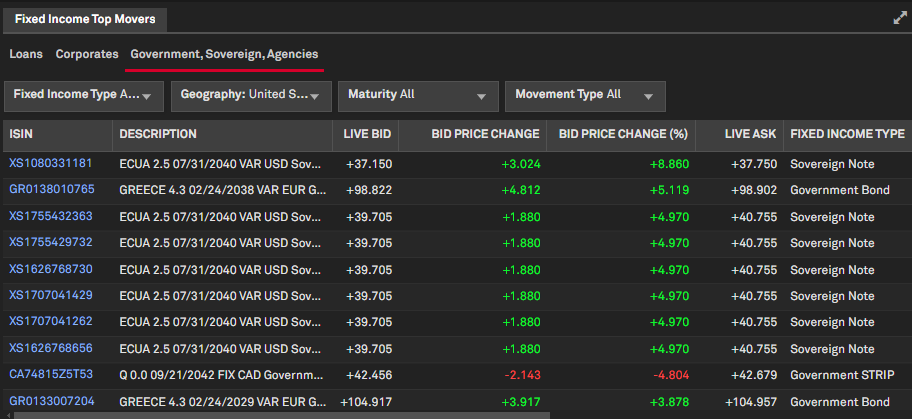
Users now have access to the new Fixed Income Top Movers widget in Dashboard to analyze market trends for GSAC bonds.
Find it in the platform:
- Navigate to Dashboard from the top navigation bar
- Select Fixed Income Top Movers widget from the Add Widget menu at the top right to add it to the Dashboard
- The widget displays top gainers and losers, in two newly added tabs for Corporates and Government, Sovereign, Agencies bonds with current live prices, along with the existing tab for Loan securities
Central Securities Depositories (CSD) and Central Securities Depositories Regulation (CSDR) Data
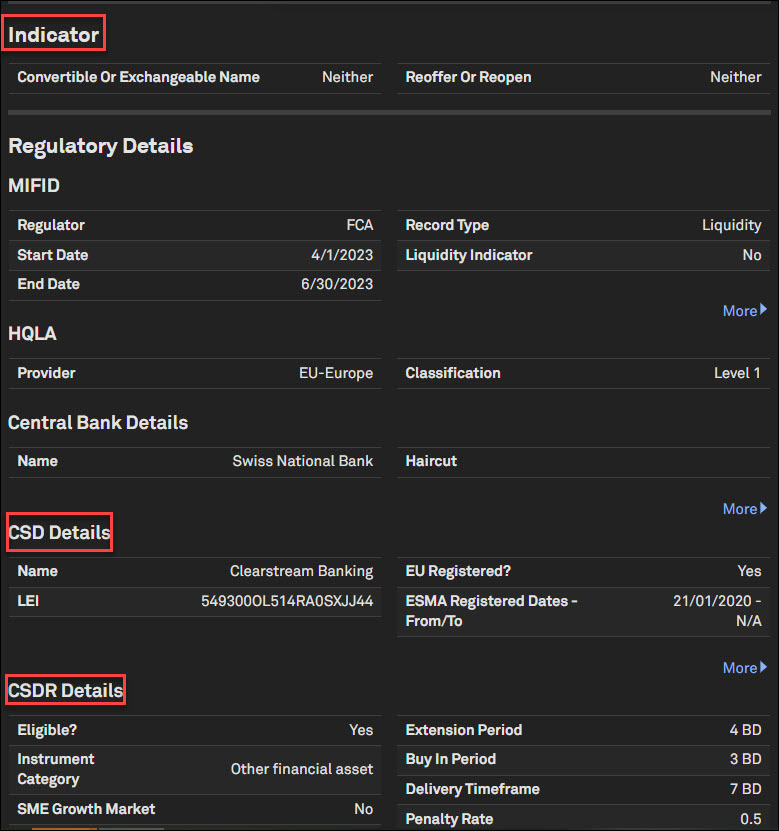
Users now have access to additional regulatory information for GSAC bonds related to Central Securities Depositories (CSD) and Central Securities Depositories Regulation (CSDR) on our Bond Security Detail page.
Find it in the platform:
- Enhanced Bond Security Detail page:
- Search for a bond with market identifiers, CUSIP, ISIN, SEDOL, etc., from the top search bar and select the security to navigate to the new Bond Detail page
- Or Navigate to the page from a bond’s hyperlink from the Corporate Issuance > Securities Summary page or Corporate and Sovereign Bonds page
- On the Reference tab, view the additional regulatory data for Central Securities Depositories (CSD) and Central Securities Depositories Regulation (CSDR) under the Regulatory Details widget
- Also view the enhanced list of security attributes/flags under the Indicators widget
GSAC Reference, ESG and Schedule Data in Screener and S&P Capital IQ Pro Plug-in
Users now have access to more GSAC Reference, ESG and Schedule data on our Securities Screener and S&P Capital IQ Pro Plug-in.
Find it in the platform:
- Navigate to Screener from the top navigation bar or the Apps menu and select the Securities dataset
- Under Recommended Criteria, choose Fixed Income Type and expand Debt Capital Markets > Corporate Bonds; Government Bonds; Agency Bonds; Sovereign Bonds; Supranational Bonds folders
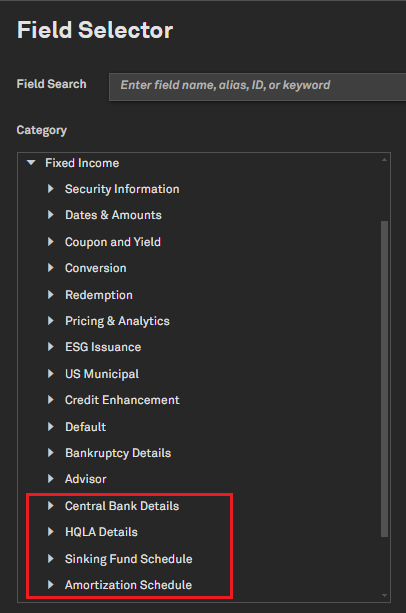
- Or from Add Criteria or Display Columns, expand the Fixed Income folder
- Expand sub-folders Security Information or ESG Issuance to see the additional security attributes/flags
- Expand new sub-folders such as Central Bank Details, High Quality Liquid Asset (HQLA), Sinking Fund, Amortization
S&P Recovery Ratings and Municipal Issuer Credit Ratings (ICR)
S&P Recovery Ratings and Municipal Issuer Credit Ratings (ICR) have been added to their respective Credit Ratings and Bond Security Detail pages.
Find it in the platform:
- Security Detail page
- Search for a security with market identifiers, CUSIP, ISIN, SEDOL, etc., from the top search bar and select the security to navigate to the Bond Detail/Security Detail page
- View the latest S&P Ratings Recovery Rating information in the Current Issue Credit Ratings grid for the fixed income securities
- Credit Ratings page
- Search for an entity from the top search bar and navigate to its Corporate Profile
- Expand the Corporate Issuance tab from the left-hand navigation menu
- Click on the Credit Ratings page to view Municipal Issuer Credit Ratings (ICR) displayed in the Current Ratings and Ratings History tabs for municipal entities


Search
In this release, we added the ability for users to navigate directly to a Market Map by searching on a topic, e.g. digital media, improved query suggestions and spell-check capabilities and enhanced company information display within search results.Enhanced Display of Company Search Results
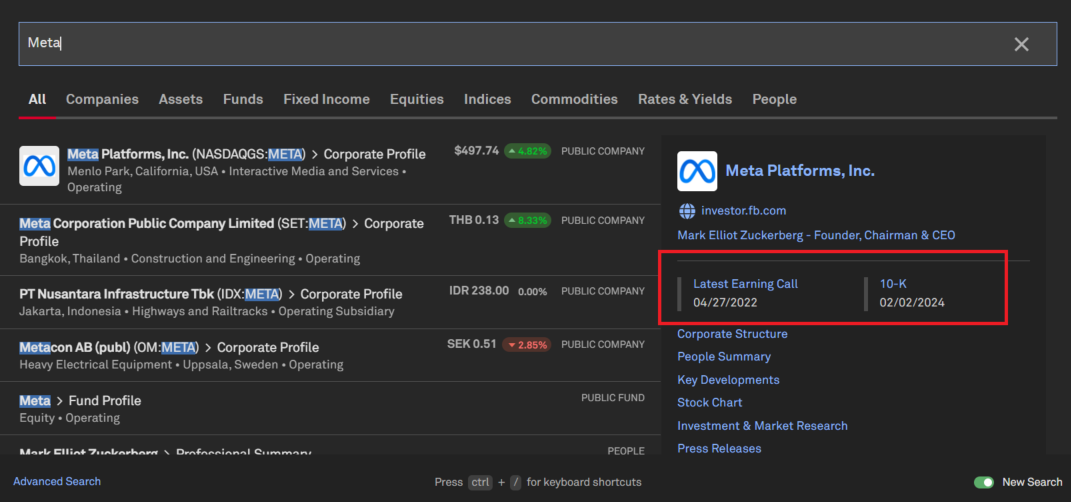
Users can access more comprehensive company information directly within the top search experience. When searching for a company, users can hover over or navigate results using the keyboard and view an enhanced display of company information to the right of the results in a card format. This card includes the company name, company logo (if applicable), website, CEO name, and popular company pages. e.g., Corporate Structure, People Summary, etc. Additionally, we added direct links to the company’s latest earnings call transcript and 10-K filing (if applicable) in search results, offering users richer and more comprehensive company information.
Find it in the platform:
- Navigate to the search bar within the top navigation menu and enter keywords to find the desired company
- The company card will be displayed in All and Companies tabs within the search
- e.g., Search for Meta and note that the latest earnings call transcript and 10-k filing are directly accessible on the right side of the screen
- Hover over other company results and notice that the right side of the screen displays the highlighted company information
Country Flags in Search
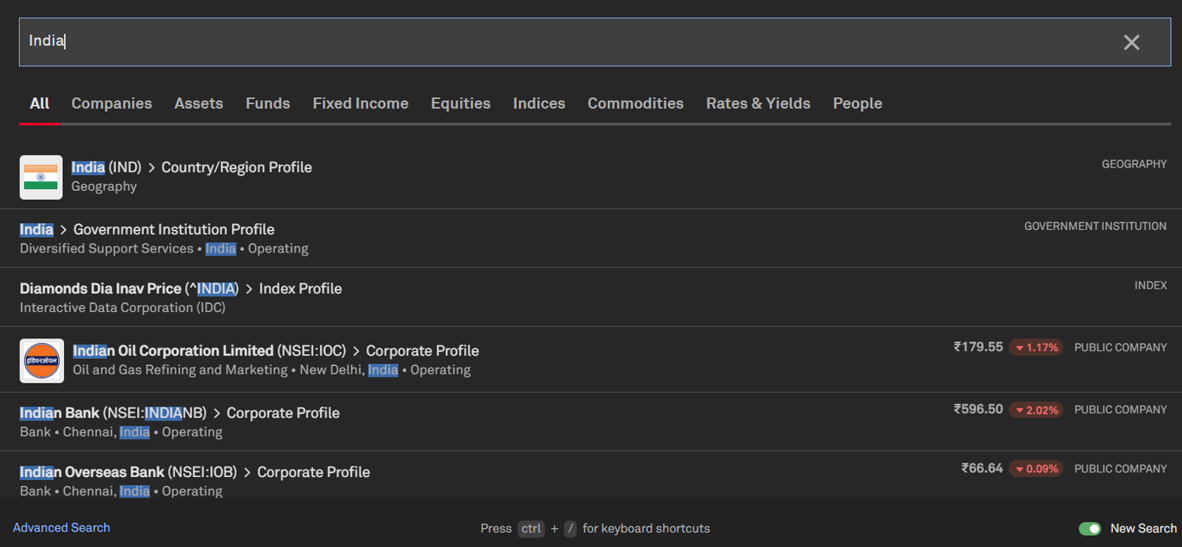
Flags for each country are now available in the search results to provide another visual to identify and differentiate between countries.
Find it in the platform:
- Navigate to the search bar within the top navigation menu and enter keywords to find the desired country
- e.g., Search for India and notice the country flag associated with the country profile results
Intuitive Topic Tag Search
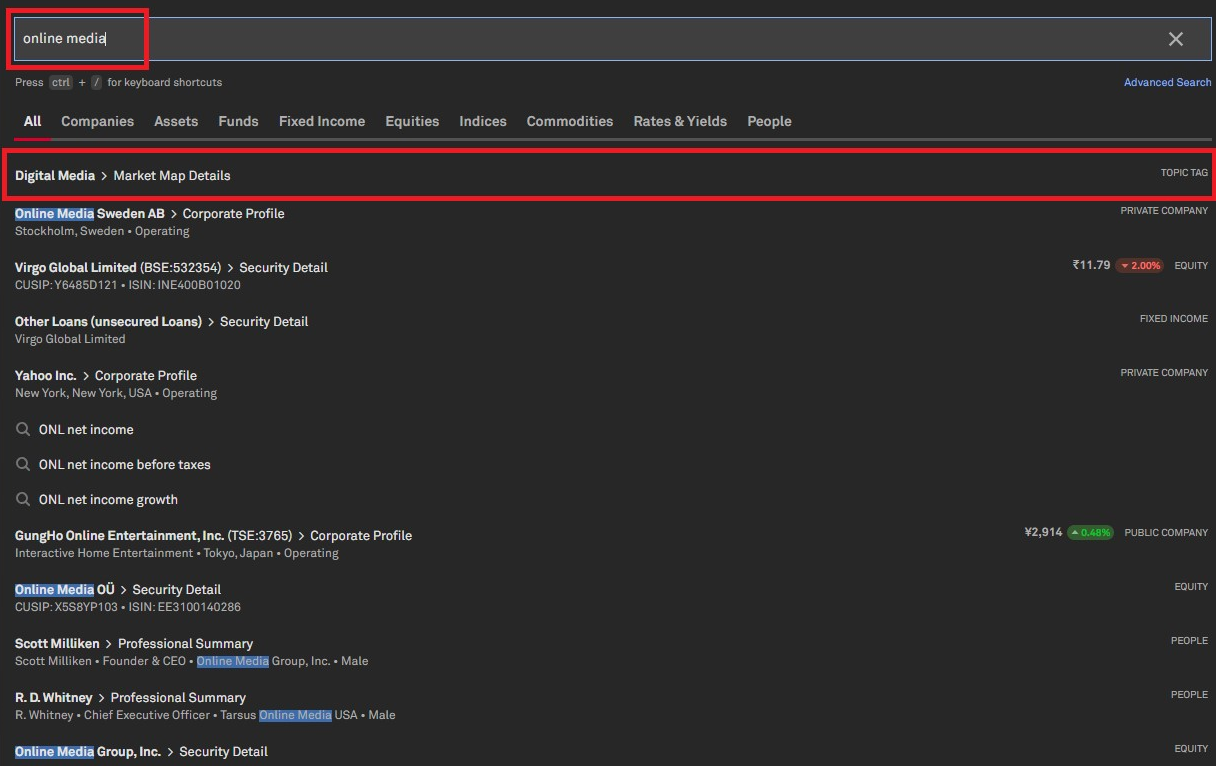
Users can now easily find topic tags directly within the search experience. They will receive relevant results from the Market Maps page even by typing any alternative name for a Topic Tag in the search bar.
Find it in the platform:
- Navigate to the search bar within the top navigation menu and enter keywords to find the desired topic
- Search for a Topic Tag, e.g. Online Media, and find relevant Market Map results for the Topic Tag known as Digital Media
Enhanced Search Query Suggestions
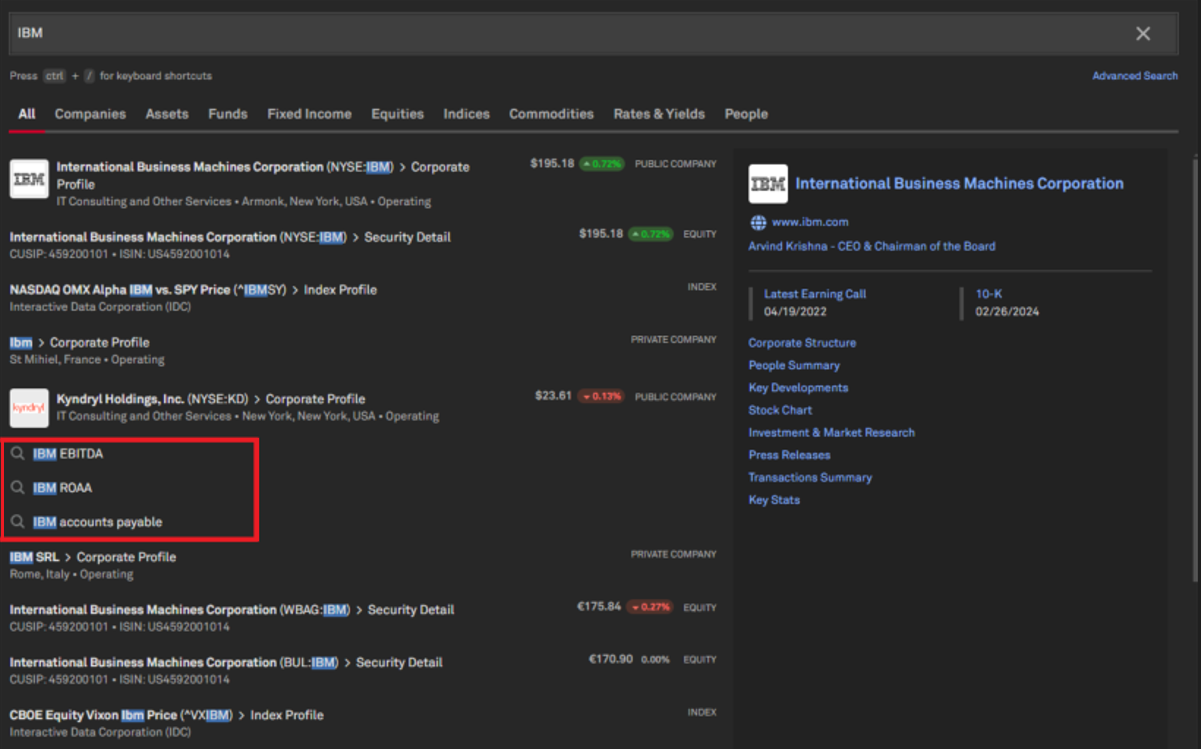
Users can discover relevant information more efficiently with our enhanced suggested queries and improved search layout, designed to streamline the search process and help them find exactly what they need.
Find it in the platform:
- Navigate to the search bar within the top navigation menu
- Type a search query to see the best suggestions that display instantly
- Click on a suggestion to refresh the results with relevant content tailored to the chosen query
Sharing Feedback on the Search Experience
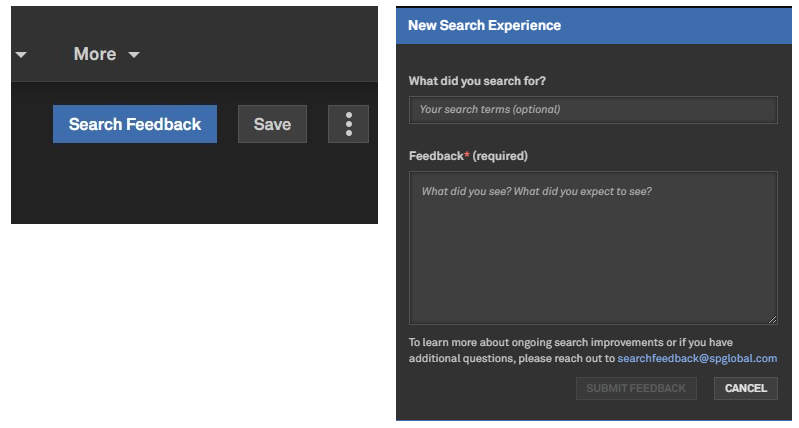
Users will notice design changes to the feedback submission button in this release. We encourage users to continue sharing their thoughts with us, as these inputs are vital to driving future innovations.
Find it in the platform:
- Navigate to the search bar within the top navigation menu
- Click on Advanced Search at the bottom left of the search results
- Select the Search Feedback button, which will submit feedback to our team
Dashboard
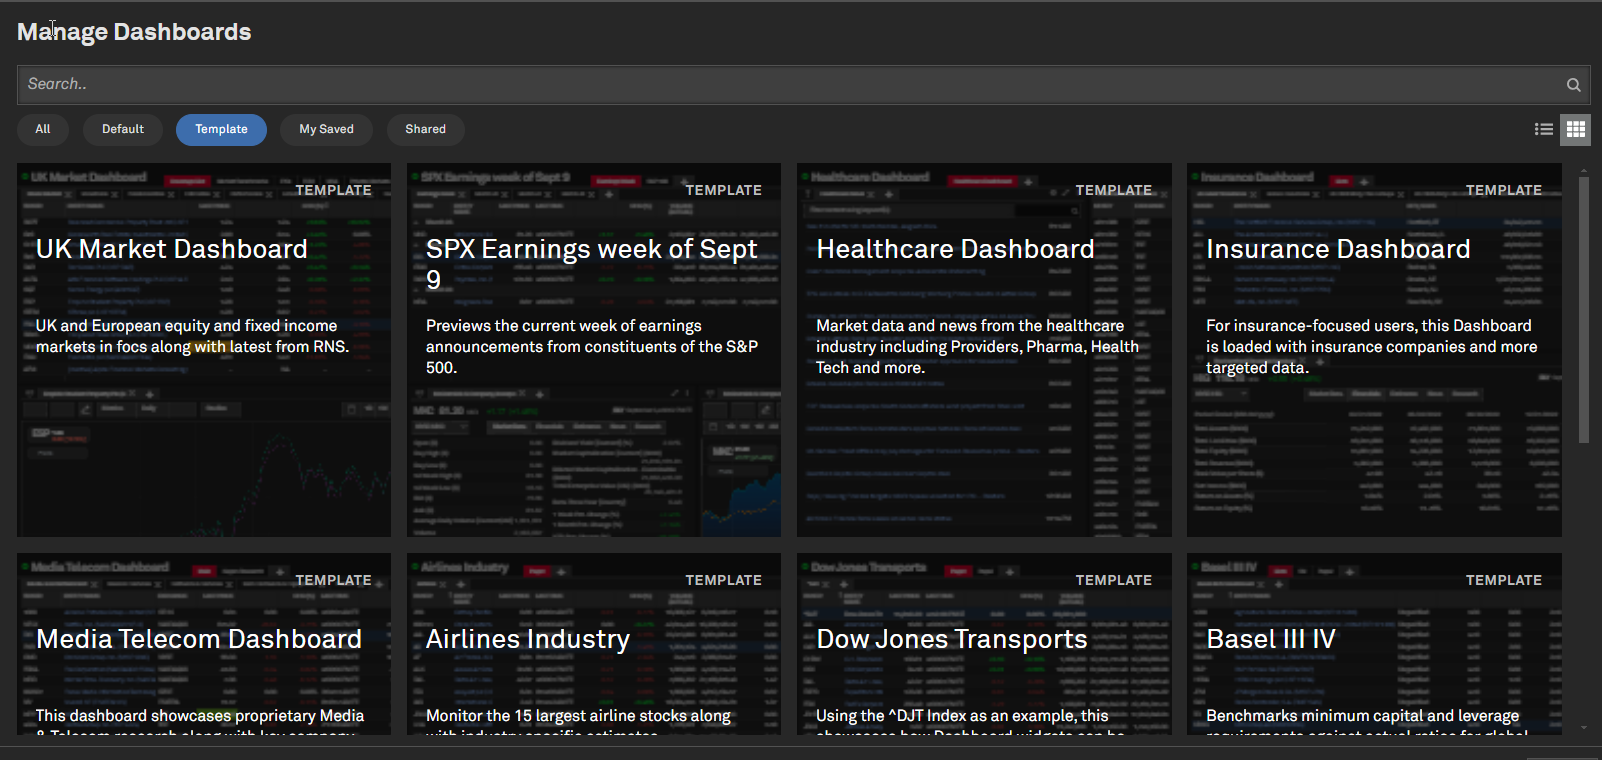
In this release, we introduced new Dashboard templates and expanded the functionality of the Dashboard template library to enhance the user experience, including the ability to view thumbnail previews and a description field for each template.
Dashboard Templates
Users now have access to new Dashboard Templates tailored to their focus, including industries, asset classes, and more. These templates may be updated in response to client and market feedback.
Find it in the platform:
- Navigate to the Dashboard
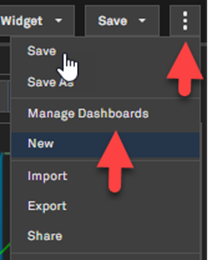
- Open the three-dot Dashboard menu on the top right and click on Manage Dashboards
- Go to Template tab and sort by Date to see the latest templates
- You can save the template as your default
- Alternatively, access this option from Saved Items from the top navigation
- Select Dashboards > Manage Dashboards, and find the new templates in the Template tab
Dashboard Templates Thumbnail Preview
Users can now manage dashboards from the Dashboard action menu, choosing between a table view or a tile view with thumbnail previews for templates.
Find it in the platform:
- Navigate to Dashboard
- Open the three-dot Dashboard menu on the top right and click on Manage Dashboards
- Click the Tile View option on the top right of the Manage Dashboards menu
Dashboard Descriptions
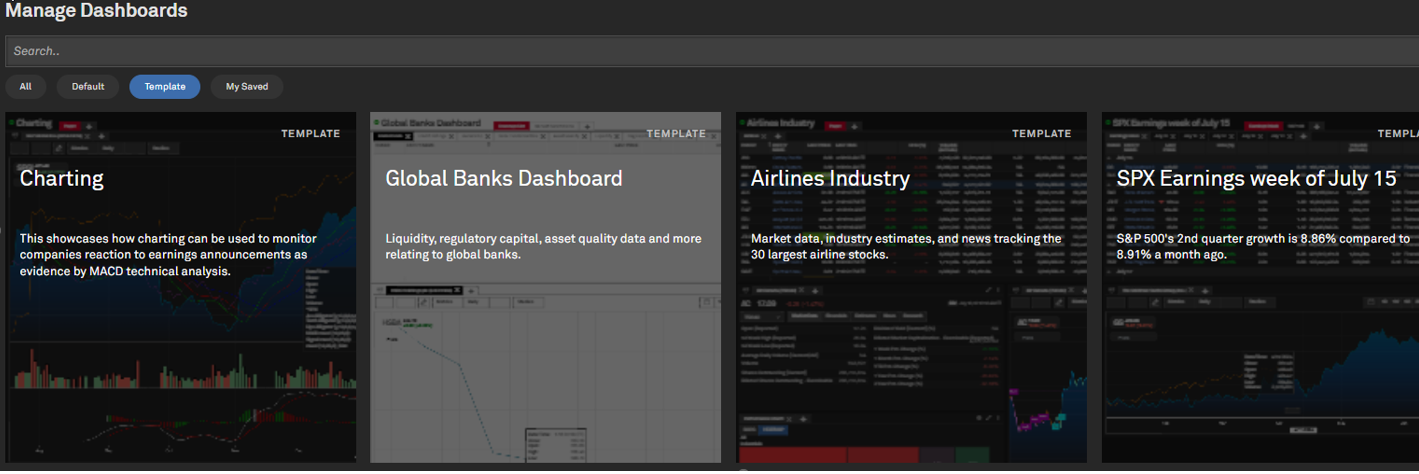
Users can now view and edit Dashboard descriptions, where applicable, when navigating within the Manage Dashboards option.
Find it in the platform:
- Navigate to Dashboard
- Open the three-dot Dashboard menu on the top right and click on Manage Dashboards
- On the table view of the Manage Dashboard screen, access Description column
- Users with saved Dashboards can select the three-dot action menu on the left to Edit Description
- Edit Description is also available while initially saving a Dashboard

Private Markets
In this release, we enriched our Private Markets offering by introducing a new Energy group on the Market Maps summary page to house all the niche energy tags and moving the Market Maps page under the Markets top navigation menu to allow easier access. Furthermore, we integrated Private Debt data across firms, funds, and institutional investors within the S&P Capital IQ Pro Plug-in and Screener*. This update also includes an enhanced Screener view for investment firms/funds, allowing users to quickly screen through relevant private equity, venture capital, private debt firms, funds, and limited partners.
Market Maps Update
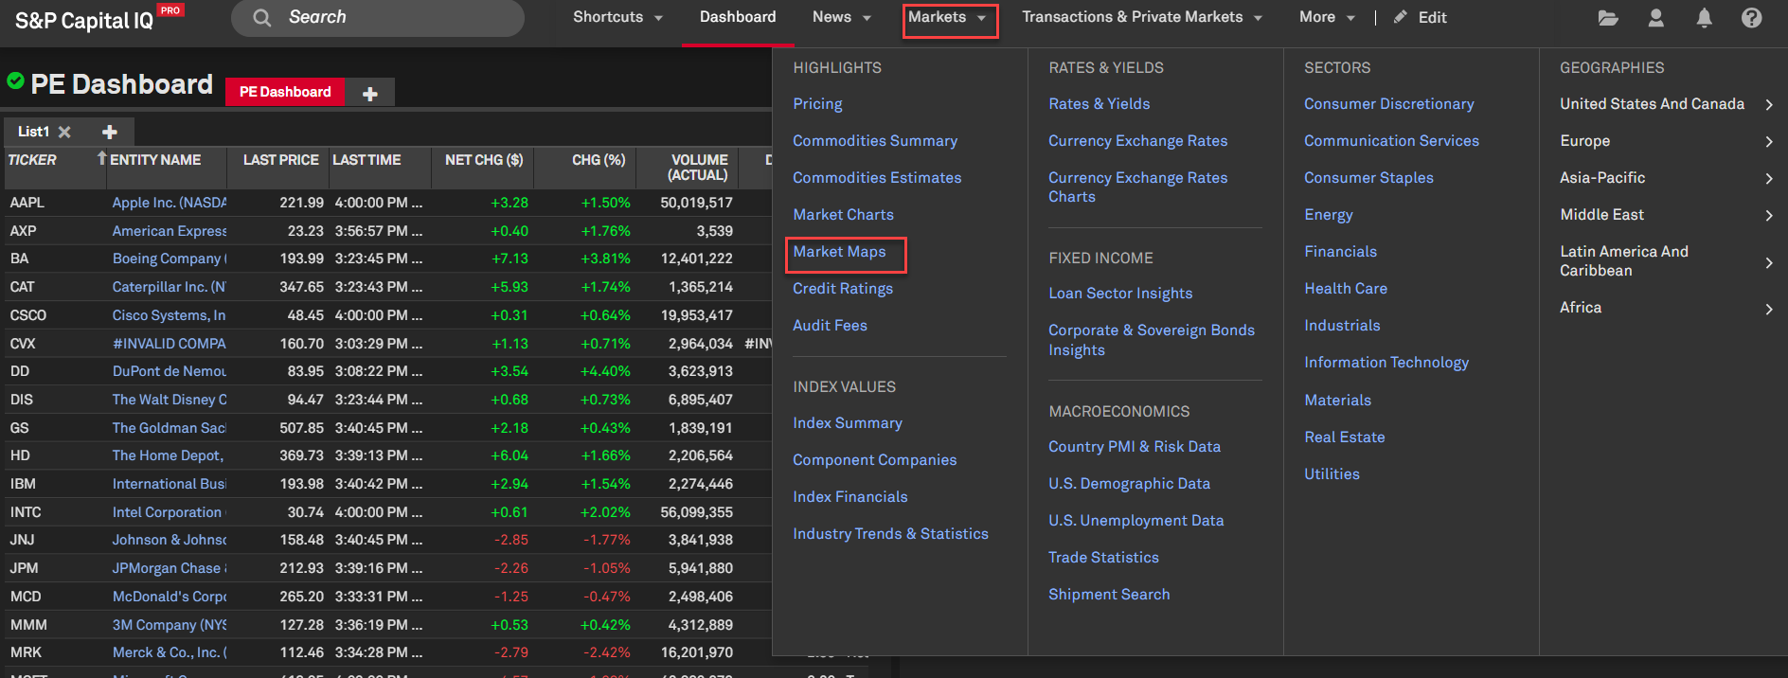
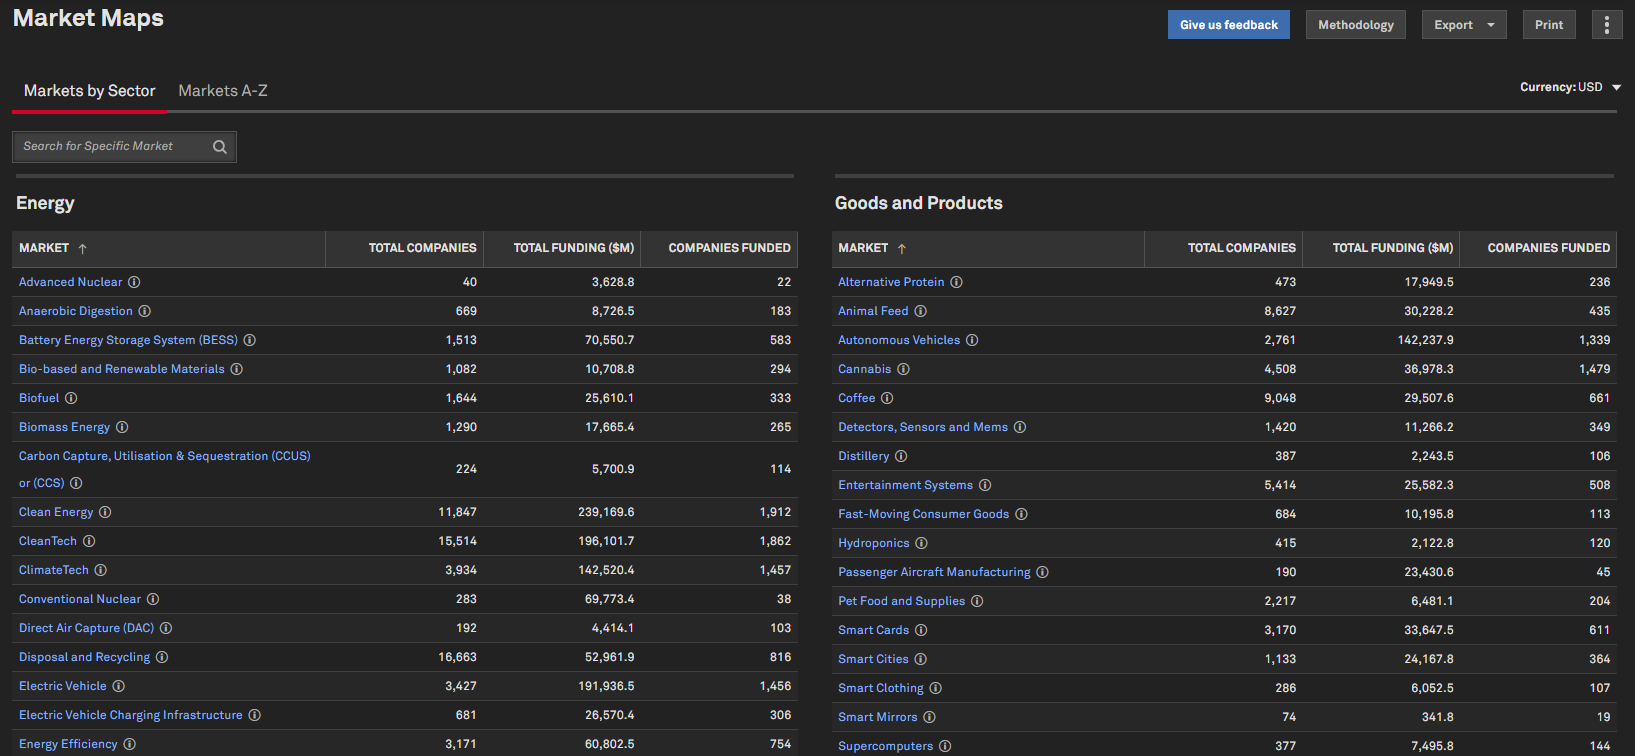
Users can now access Market Maps from the Markets top navigation to help improve discoverability. Additionally, we added a new Energy group on the Market Maps Summary page.
Find it in the platform:
- Navigate to the Markets menu from the top navigation
- Click on the Market Maps under Highlights to view the page and the newly added Energy group
Private Debt in Screener and S&P Capital IQ Pro Plug-in
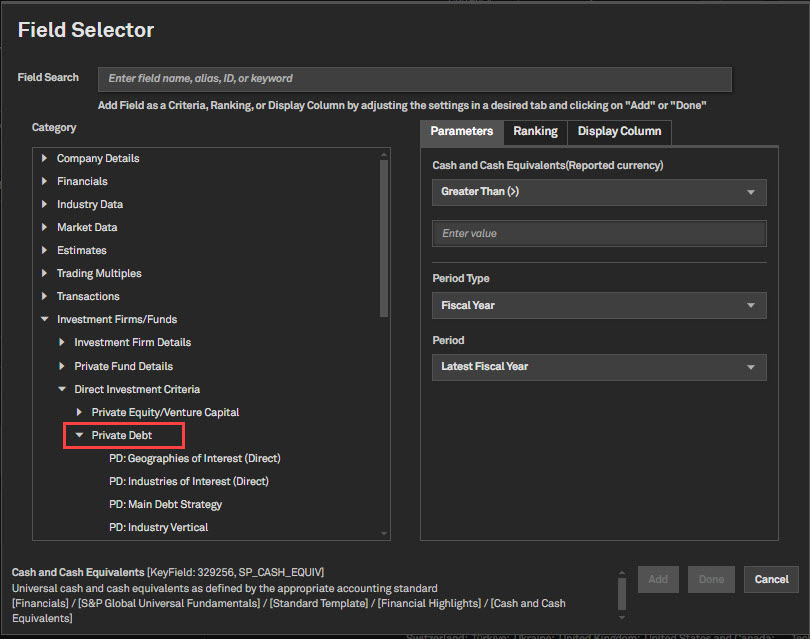
Users can benefit from the enhanced view of various criteria within the Investment Firms/Funds folder, streamlining the screening of entities within the private equity, venture capital or private debt asset classes. This enhancement provides a holistic view of capital flows and enables a comprehensive analysis of private markets.
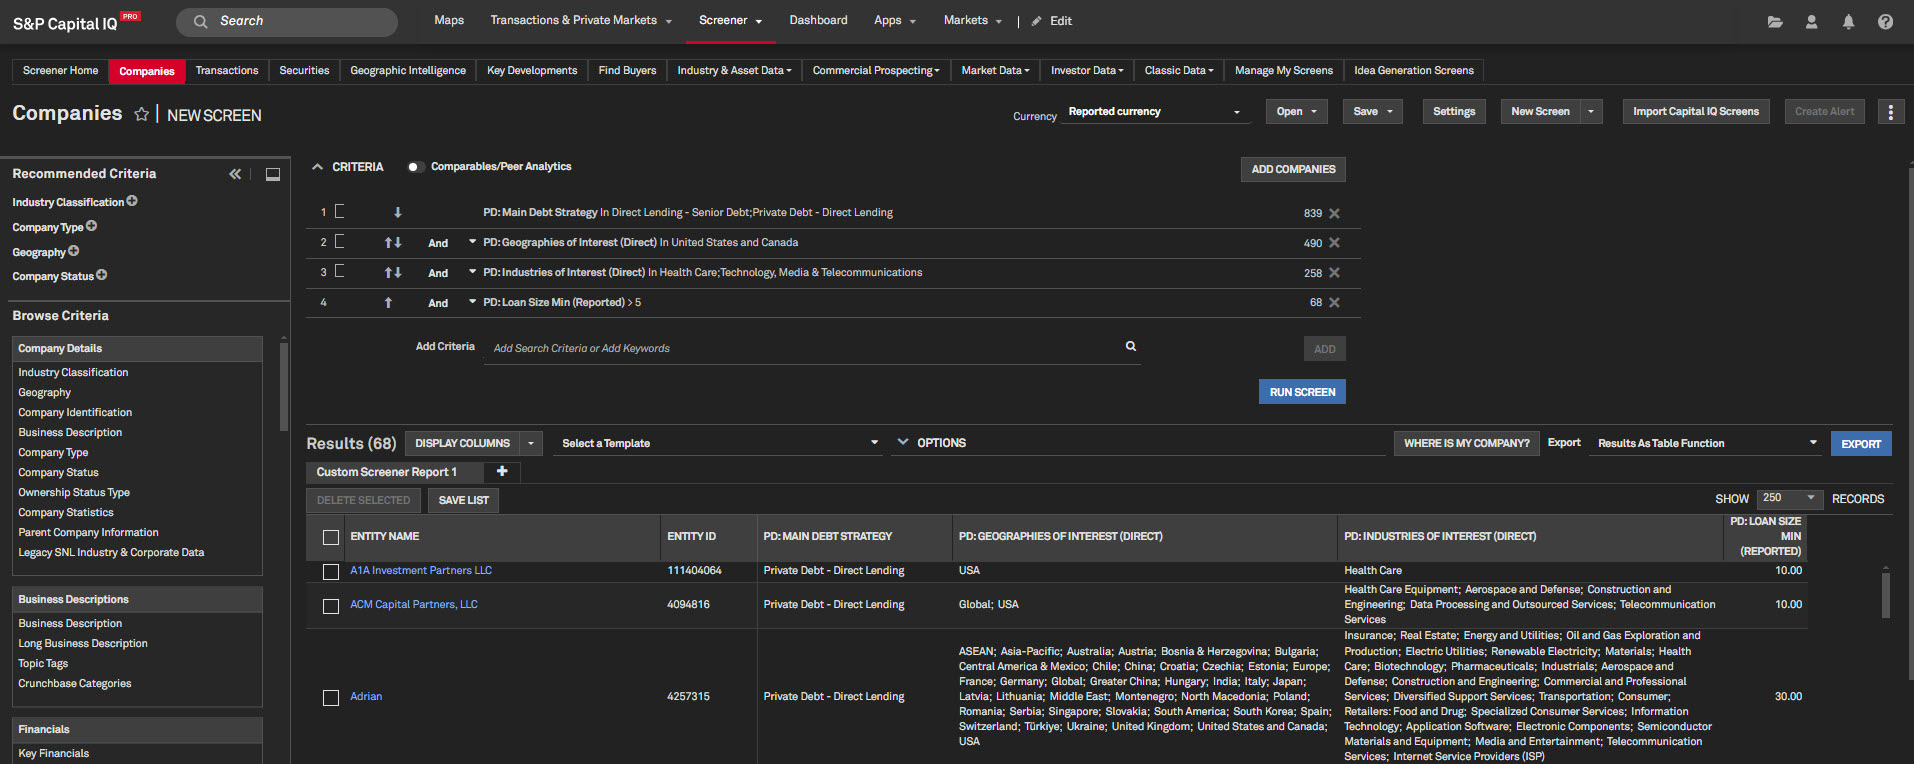
Users with premium private debt access can now screen for private debt firms, funds, investors, and their underlying information, such as fund performance, allocation targets, mandates, and investment criteria within the S&P Capital IQ Pro Plug-in and Screener. Users with premium access can also filter fund sponsors, fund investors, and lender relationships within the Private Debt asset class using the Private Market Relationships folder in the S&P Capital IQ Pro Plug-in.*
Find it in the platform:
- Screener:
- Navigate to Screener from the top navigation or the Apps menu
- Select Investment Firms/Funds
- Select Investment Firm Details > Private Debt
- Select Private Funds Details and Private Fund Performance
- Select Limited Partners > Private Debt
- Select Direct Investment Criteria > Private Debt
- Use the criteria to screen for the relevant entities
- S&P Capital IQ Pro Plug-in:
- Launch S&P Capital IQ Pro Plug-in and open Formula Builder
- Under Data Items, select Investment Firms/Funds > Private Market Relationships to find the parameters to pull Private Debt fund manager, fund investor, and portfolio relationships data
*Note: Access only to users with Preqin Private Debt entitlements, please contact your account team for details on accessing Preqin Premium and Preqin Private Debt
Macroeconomic Data
In this release, we enhanced our Geographic Intelligence data for Household segmentation by introducing Consumer Segments. This granular view of Lifestage groups empowers users to conduct detailed market analysis, helping companies better understand and anticipate customer buying behaviors for targeted marketing campaigns.
Household Segmentation & Broader Lifestage Groups
Users can now pull household segmentation data to perform detailed market analysis across multiple segments at the group level.
Find it in the platform:
- Navigate to Screener from the top navigation menu or the Apps menu and select Geographic Intelligence under Key Workflows
- Using the default criteria, click Run Screen
- Select Display Columns and expand Household Segmentation > Primary Lifestage Group


Banks and Credit Unions
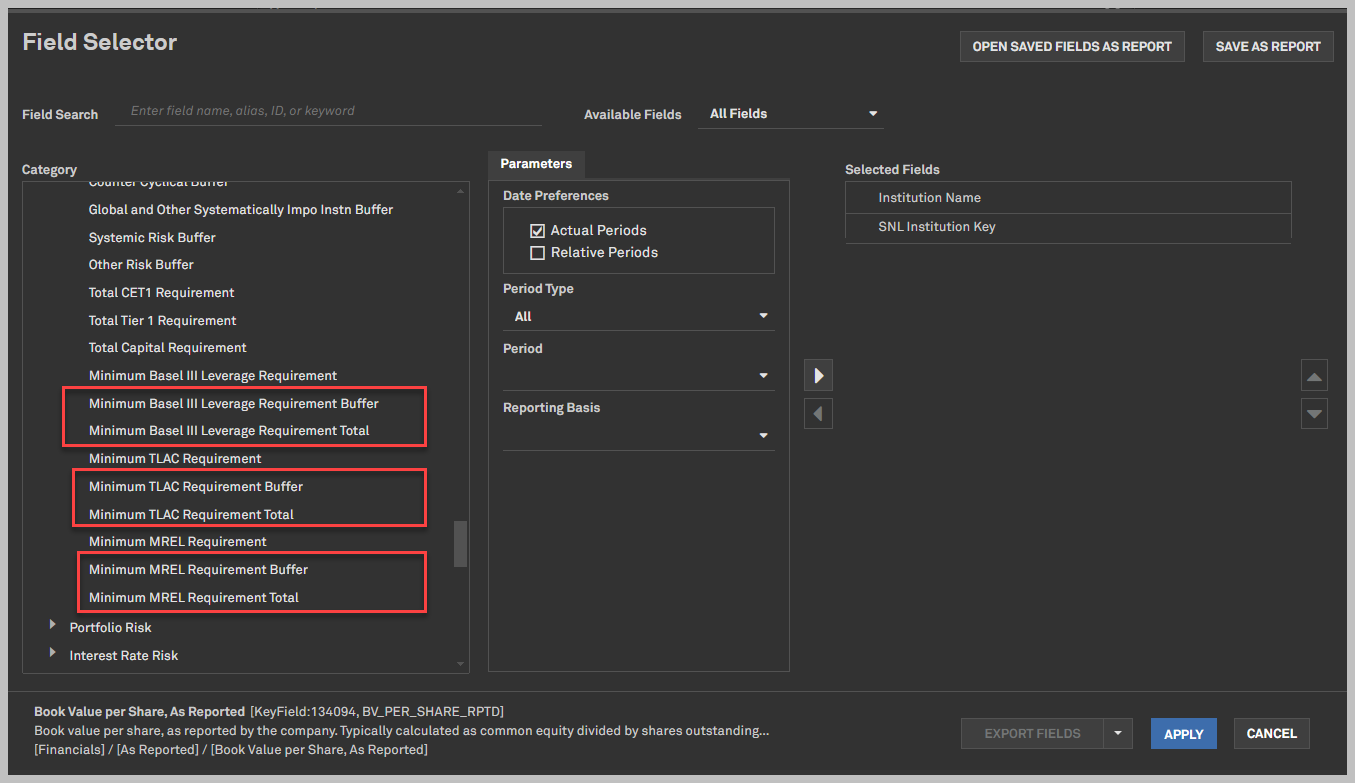
In this release, we added buffer fields related to leverage, Total Loss-Absorbing Capacity (TLAC), and Minimum Requirement for Own Funds and Eligible Liabilities (MREL) for U.S. and global banks.
Leverage, TLAC, and MREL Buffer Fields
Users can now access buffer fields related to leverage, Total Loss-Absorbing Capacity (TLAC), and Minimum Requirement for Own Funds and Eligible Liabilities (MREL) for U.S. and global banks.
Find it in the platform:
- Navigate to Screener from the top navigation menu or the Apps menu and select Companies under Key Workflows
- Select SNL Financial Fundamentals > Banks - US, Banks- Non-US, Banks- Global Summary
- Expand Industry Supplemental > Regulatory Capital menu
- Or select Companies (Classic) and expand Financial > As Reported menu
Coverage stats:
U.S. Business Listings
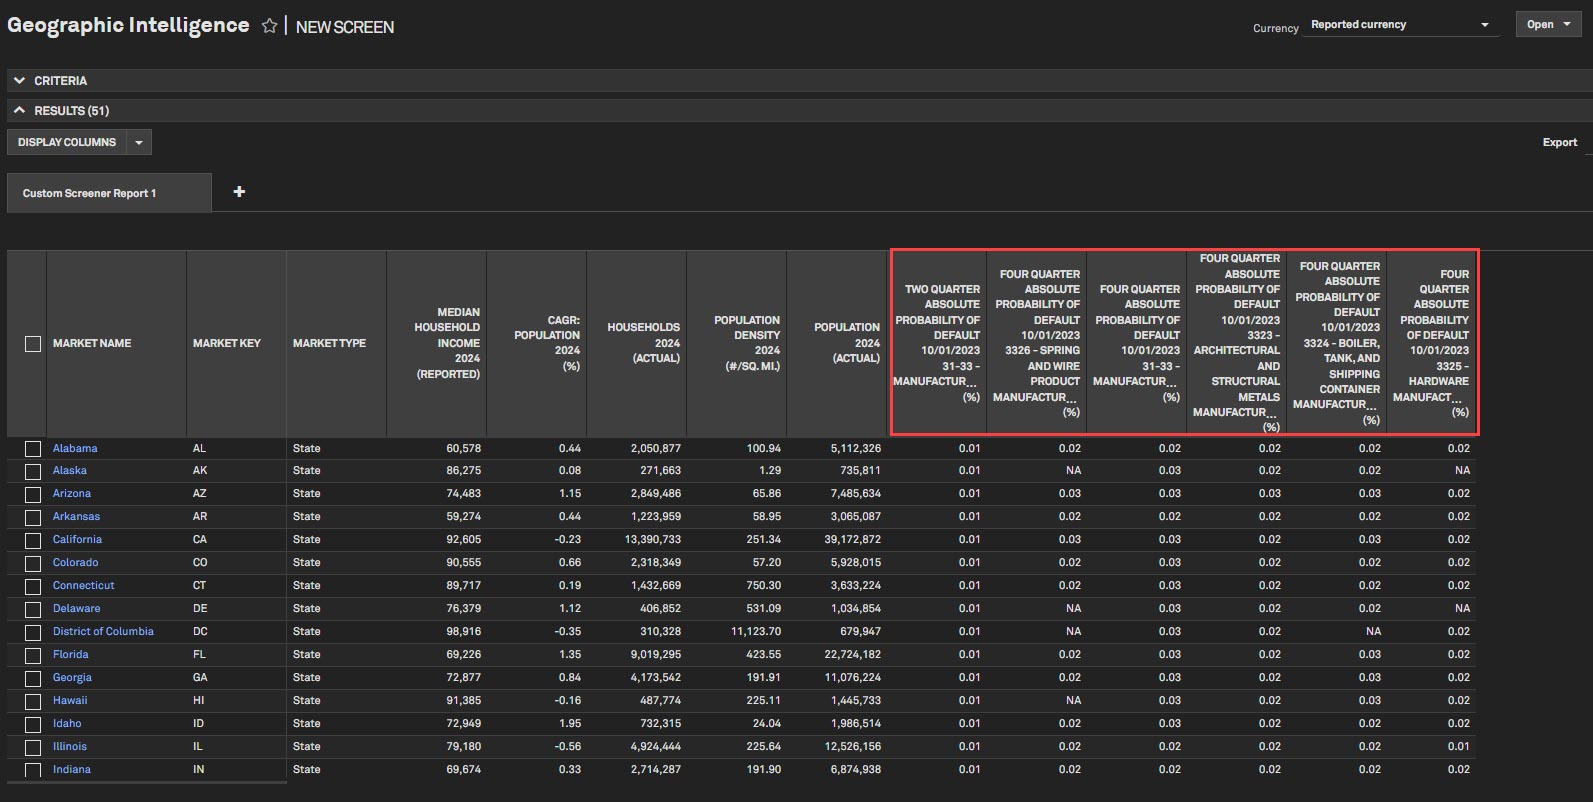
In this release, we enhanced our Geographic Intelligence data set by including Absolute Probability of Default (APD) data. Users can now analyze APD data specific to a particular geography and NAICS industry in Screener. Additionally, we extended our Business Listings coverage to include Canada, providing users with extended reach for Commercial Prospecting workflows.
Absolute Probably of Default (APD) Data on Geographic Intelligence
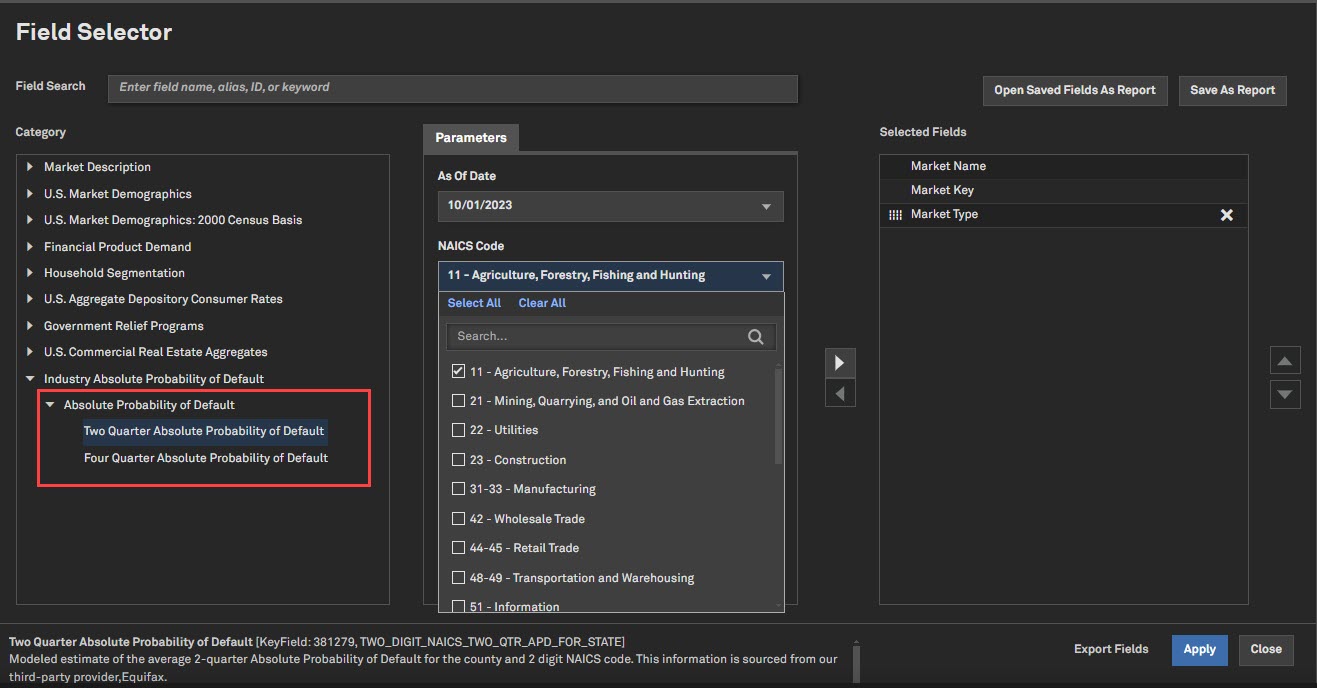
Users can now access the Absolute Probability of Default (APD) data in the Geographic Intelligence data set. This will allow users to view APD data by State or a more granular county view along with the NAICS classification.
Find it in the platform:
- Navigate to Screener from the top navigation menu or the Apps menu
- Select Geographic Intelligence, and click Add Search Criteria or Display Columns
- Expand U.S. Commercial Real Estate Aggregates and select the required fields
New Business Listings Coverage in Canada
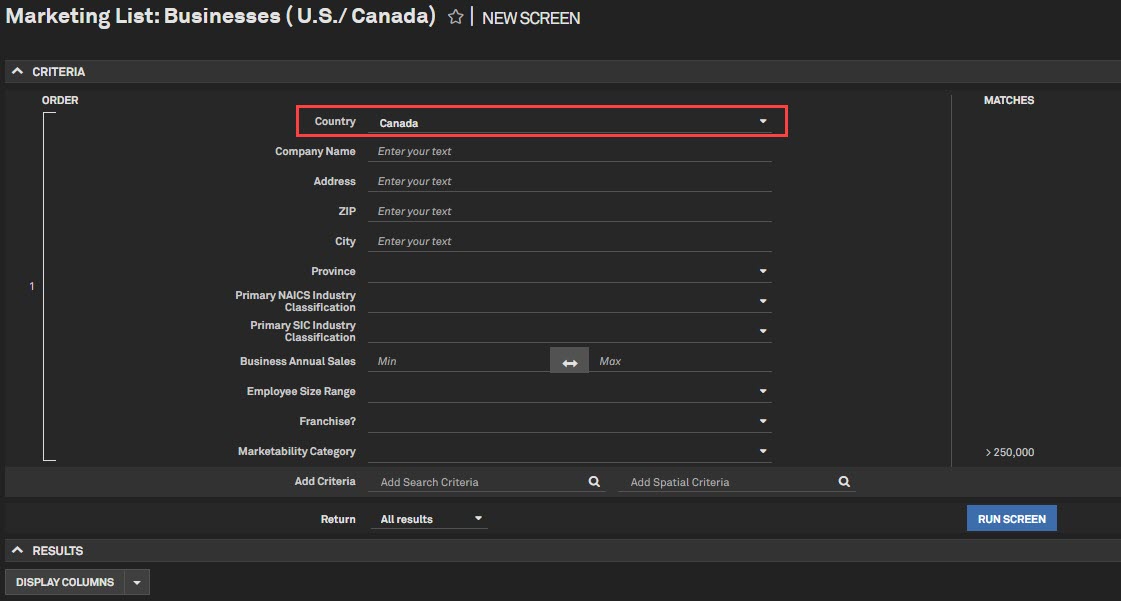
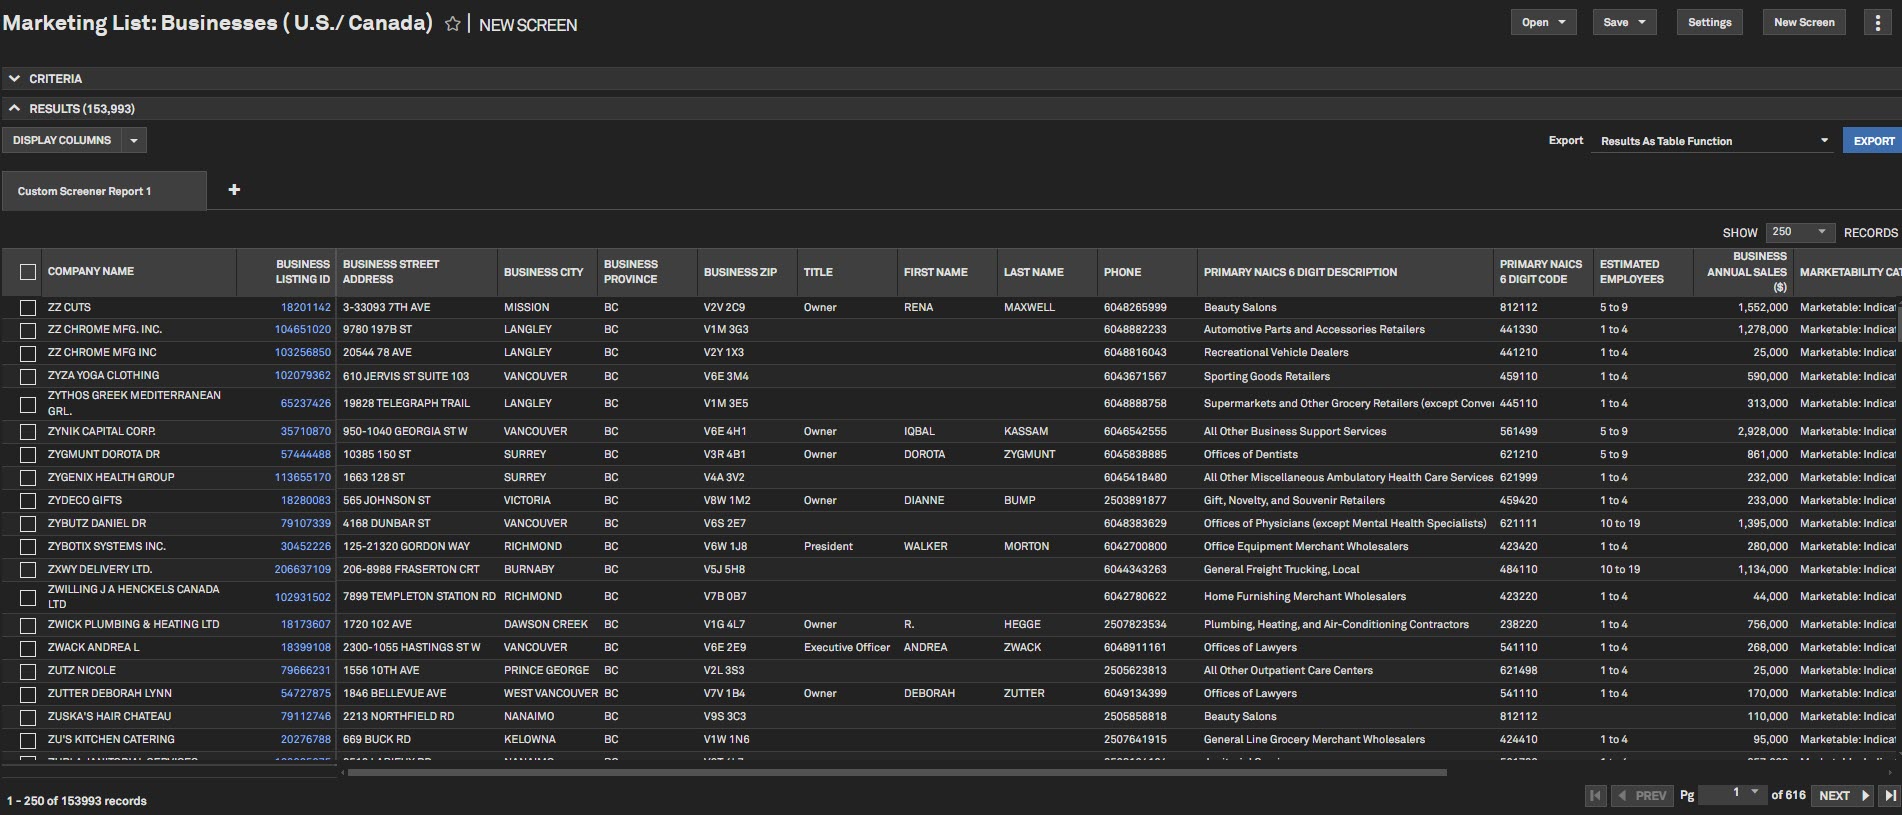
In this release, we expanded our coverage to include Canadian Business Listings in addition to U.S. for a broader reach in prospecting workflows.
Find it in the platform:
- Navigate to Screener from the top navigation menu or the Apps menu
- Under Commercial Prospecting, select Marketing List: Businesses (U.S./ Canada)
- Select Canada from the Country dropdown
- Click Add Search Criteria or Display Columns and expand Business Detail
- Select the required fields
Insurance
In this release, we added further breakout of Insurance and Reinsurance contact bifurcation under our Supplemental details section for IFRS 17. We also added Canadian Insurance statements in Screener, including Liability Roll Forward, Analysis of Income by LOB, and Life insurance Capital Adequacy summary calculations. In addition, we added as-reported parent-subsidiary relationships for Canadian Insurance companies to Screener.
Enhanced Data on Insurance and Reinsurance Contracts
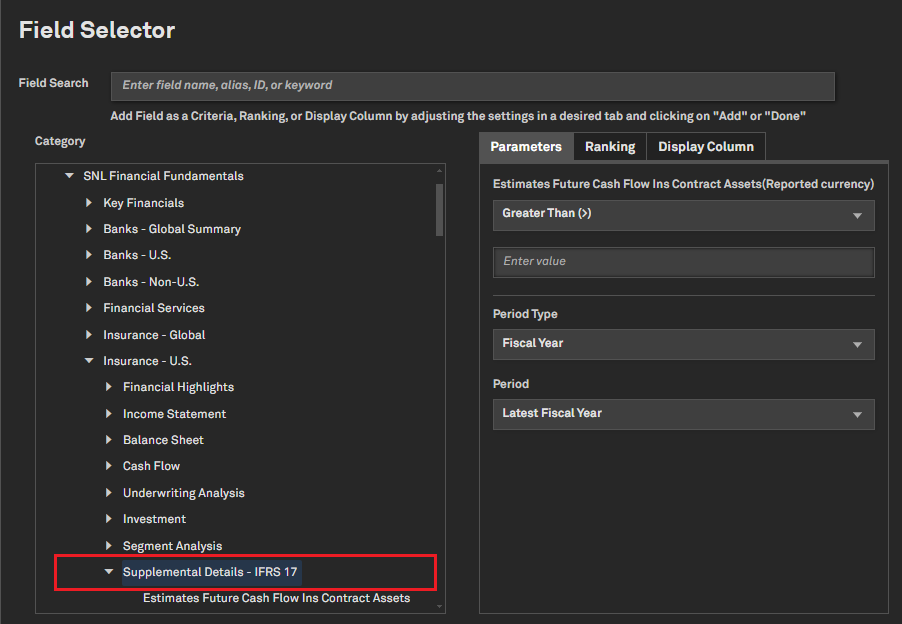
Users can access a more detailed view of Insurance and Reinsurance contract Assets and Liabilities reported under IFRS 17. This information is accessible in our supplemental details section for IFRS 17.
Find it in the platform:
- Navigate to Screener from the top navigation menu or the Apps menu and select Companies under Key Workflows
- Navigate to Financials > SNL Financial Fundamentals and select either Insurance EMEA, Insurance Asia-Pacific, or U.S. Insurance
- Select Supplemental Details - IFRS 17
Additional IFRS 17 disclosures for Canadian P&C and Life Insurers
In this release, we added additional Canadian Insurance statements and as-reported parent-subsidiary relationships for Canadian Insurance companies to Screener.
- Analysis of Income by Line of Business - Canada
- Analysis of Income by Line of Business - Out of Canada
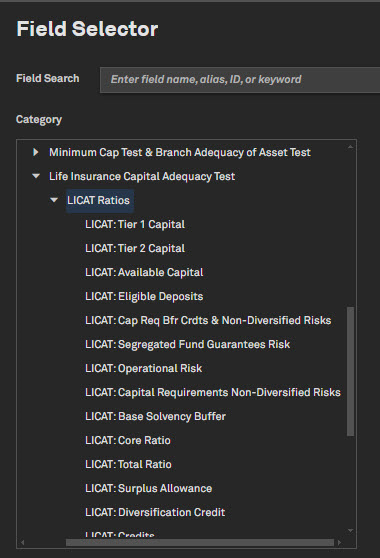
- LICAT Ratios - Summary Calculations
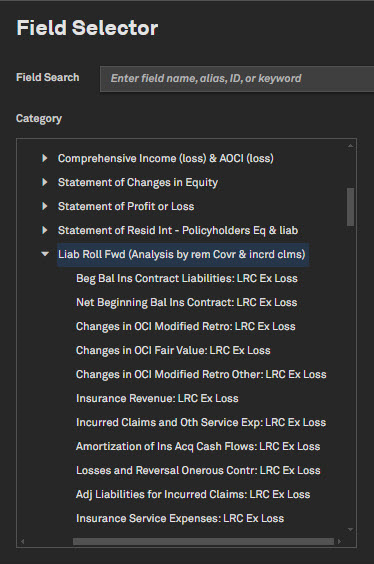
- Liability Roll Forward
- Insurance Revenue - Canada
- Insurance Revenue - Out of Canada
Find it in the platform:
- Navigate to Screener from the top navigation menu or the Apps menu and select Companies under Key Workflows
- In Display columns, go to Financials > Canadian Insurance Statements > Consolidated
Energy
In this release, we enhanced coverage of Global Day-Ahead Power Prices, including its addition to the commodity charting tool. Additionally, we added currency conversion functionality to the Power Plant and Power Plant Units perspectives in Screener.
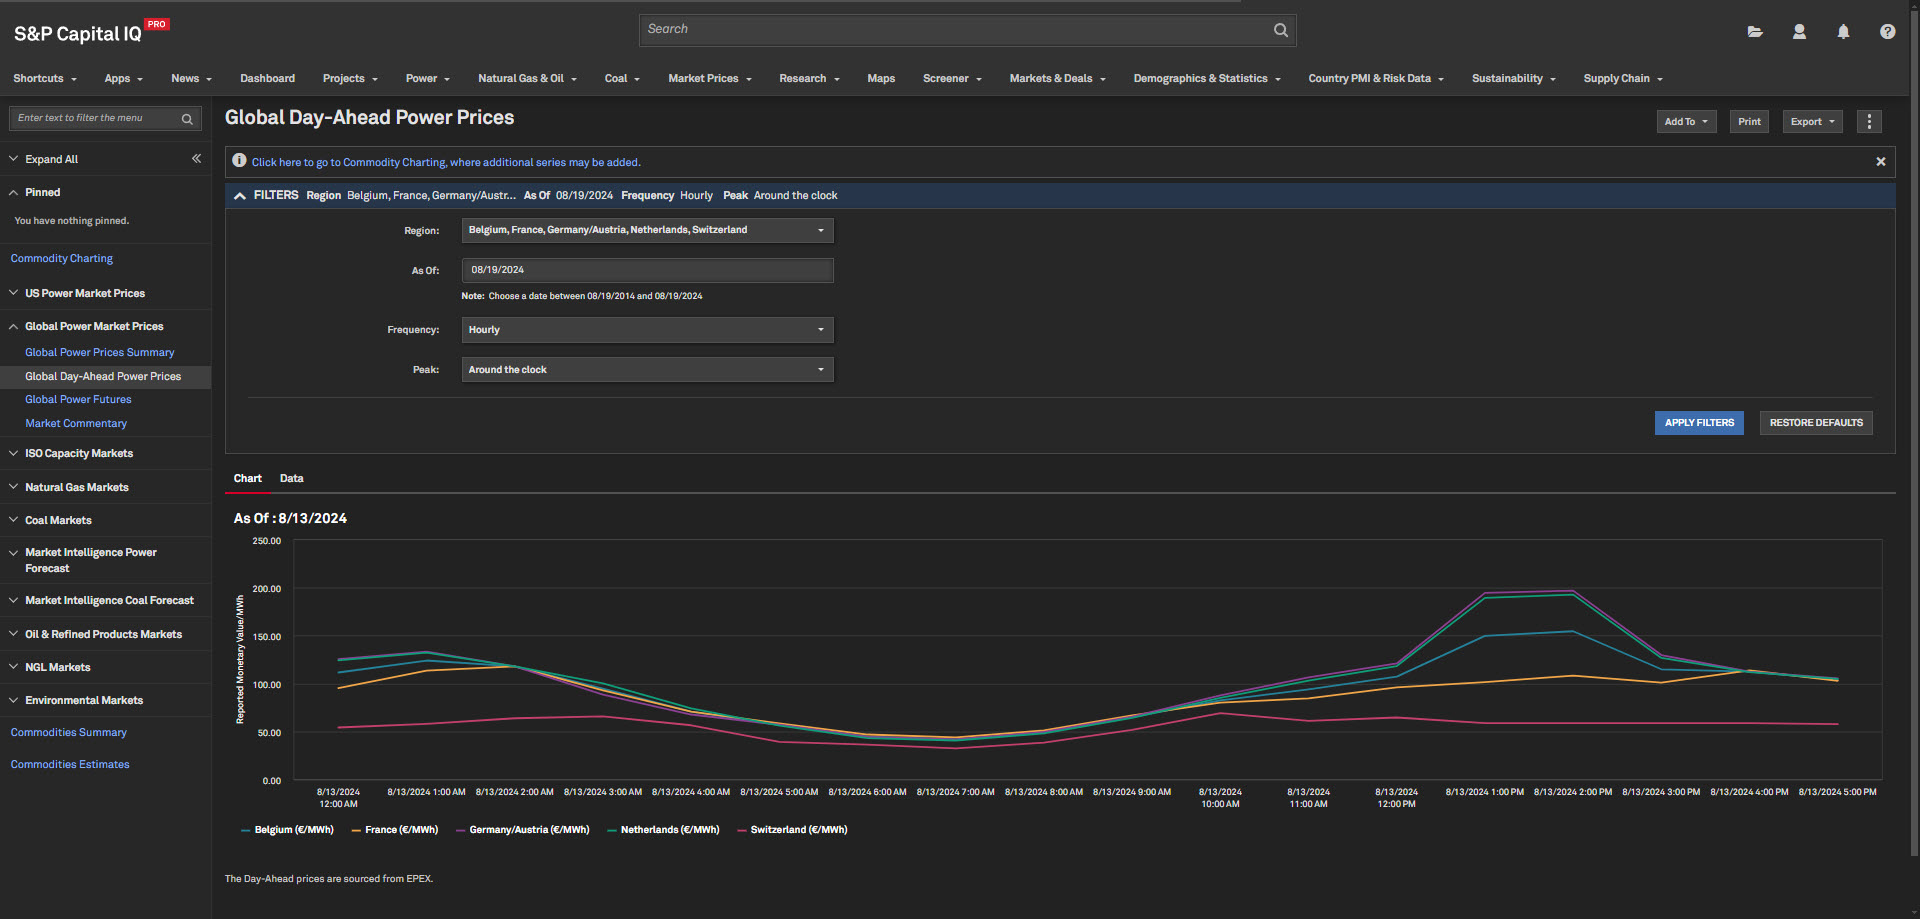
Global Day-Ahead Power Prices
Users can access Day-Ahead Prices for select European countries. This feature enables users to value power- generating assets and portfolios and track the impact of renewable integration in these regions.
Find it in the platform:
- On the Energy profile specialization, navigate to the Market Prices tab from the top navigation
- Select Global Power Prices Summary within the tab
- Navigate to the detail page by clicking on the Global Day-Ahead Power Prices link on the left-hand navigation
Coverage stats:
- Includes coverage for Netherlands, Austria, France, Germany, Switzerland, Belgium, United Kingdom, and Luxembourg
Power Plant and Power Plant Unit Currency Conversion
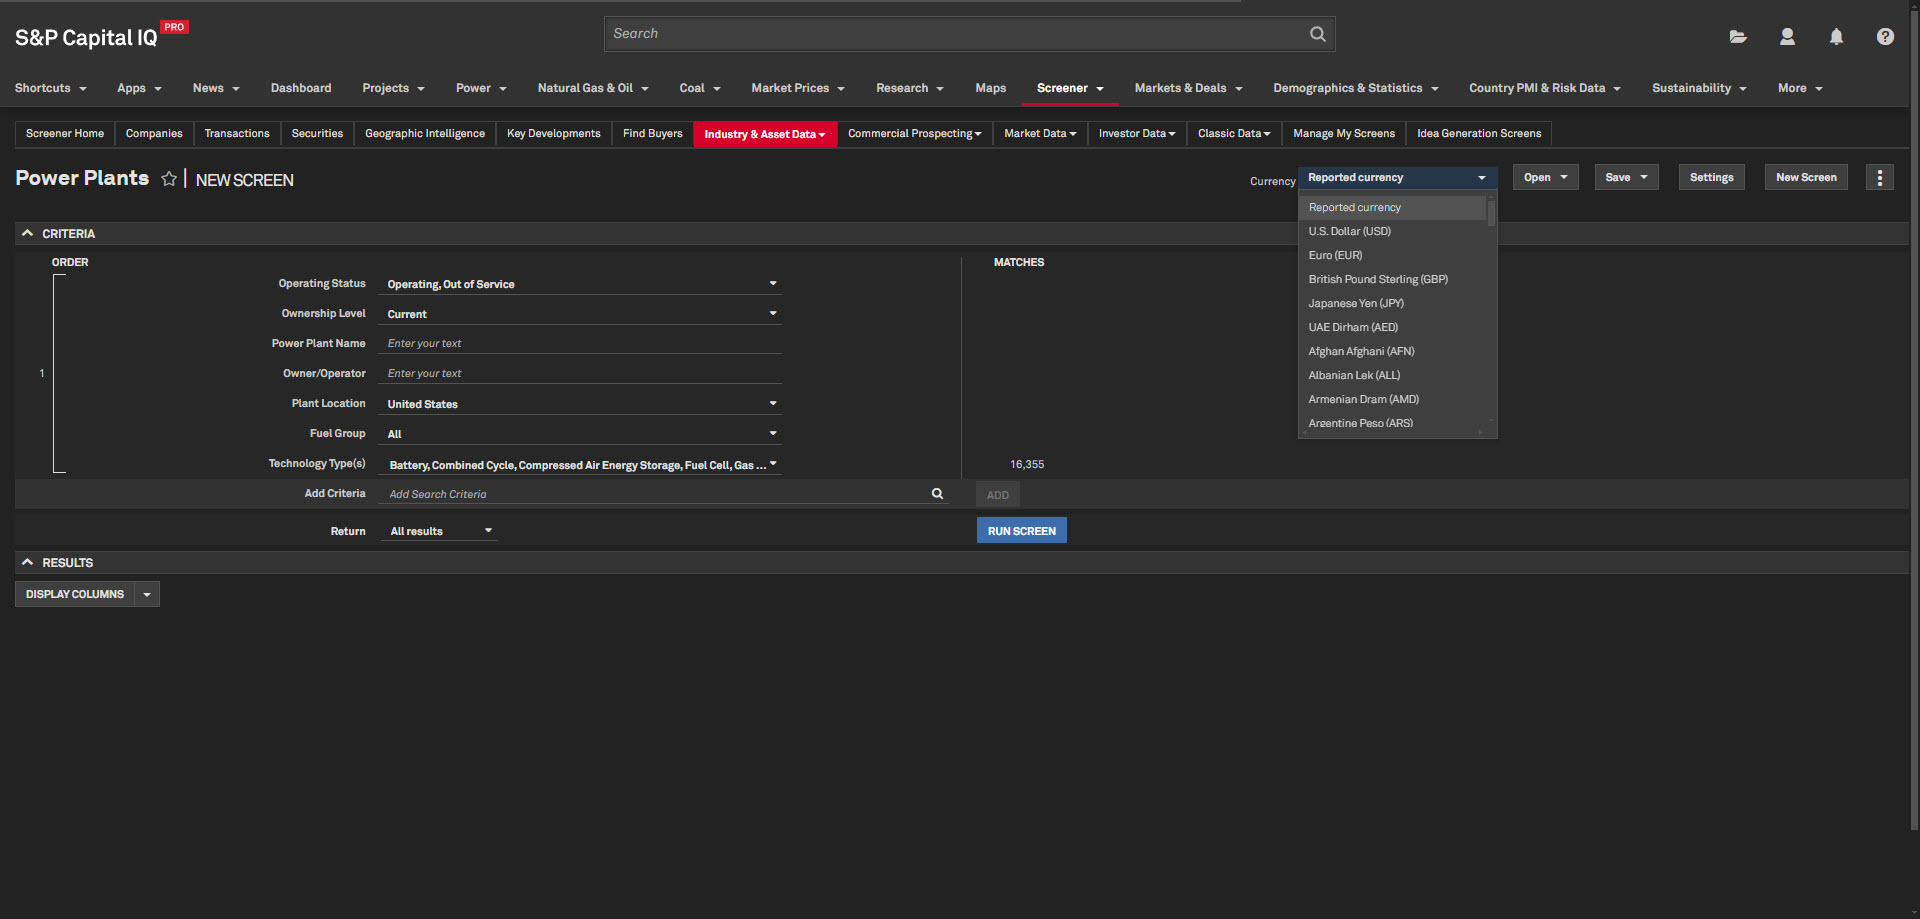
Users can change currencies in the Power Plant and Power Plant Unit perspectives in Screener. This enhancement allows users to gain deeper insights into the global power markets and help with value-generating assets to assess profitability by fuel/technology type.
Find it in the platform:
- On the Energy profile specialization, navigate to Screener from the top navigation menu
- Navigate to Industry & Asset Data > Energy & Utilities > Power Plants or Power Plant Units
- View the Currency drop-down on the top right
Coverage stats:
- Currency conversion is available for select cost items
Metals & Mining
In this release, we introduced an exciting capability to enhance the discoverability of Commodity Forecast Price, along with Supply & Demand in Screener and S&P Capital IQ Pro Plug-in. In addition, we extended the analysis available for Mine Cost Curves to 2050, offering users a longer-term perspective of mining costs and enabling them to track current and future mining operations.
Metals & Mining Market Forecast
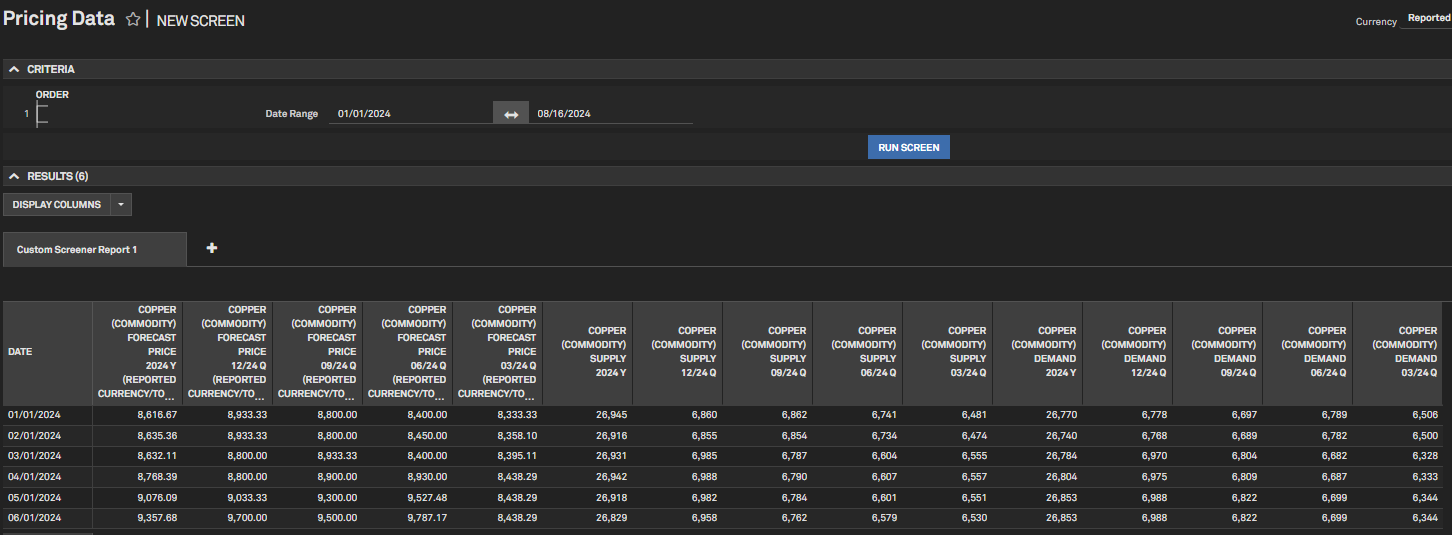
Users can access commodity forecast price, supply & demand, and market balance under Market Data in the Screener, sourced from the Metals & Mining Research team's monthly Commodity Briefing Service reports (CBS). This enables users to track market changes and create automated Excel templates using the S&P Capital IQ Pro Plug-In, simplifying analysis and decision-making.
Find it in the platform:
- Navigate to Screener from the top navigation or the Apps menu
- Go to Market Data > Pricing Data
- Switch the Display to Metals & Mining Market Forecast in the Field Selector
- In the search bar, type and select the commodity from the CBS coverage
- Select the desired fields along with the frequency and period - annual, quarterly, years
- The Date Range in the Criteria section, particularly the month in the date, signifies the CBS report’s month
Coverage stats:
- Cobalt, Copper, Gold, Iron ore, Lithium, Nickel, Zinc
Mine Economics Cost Curve Expansion
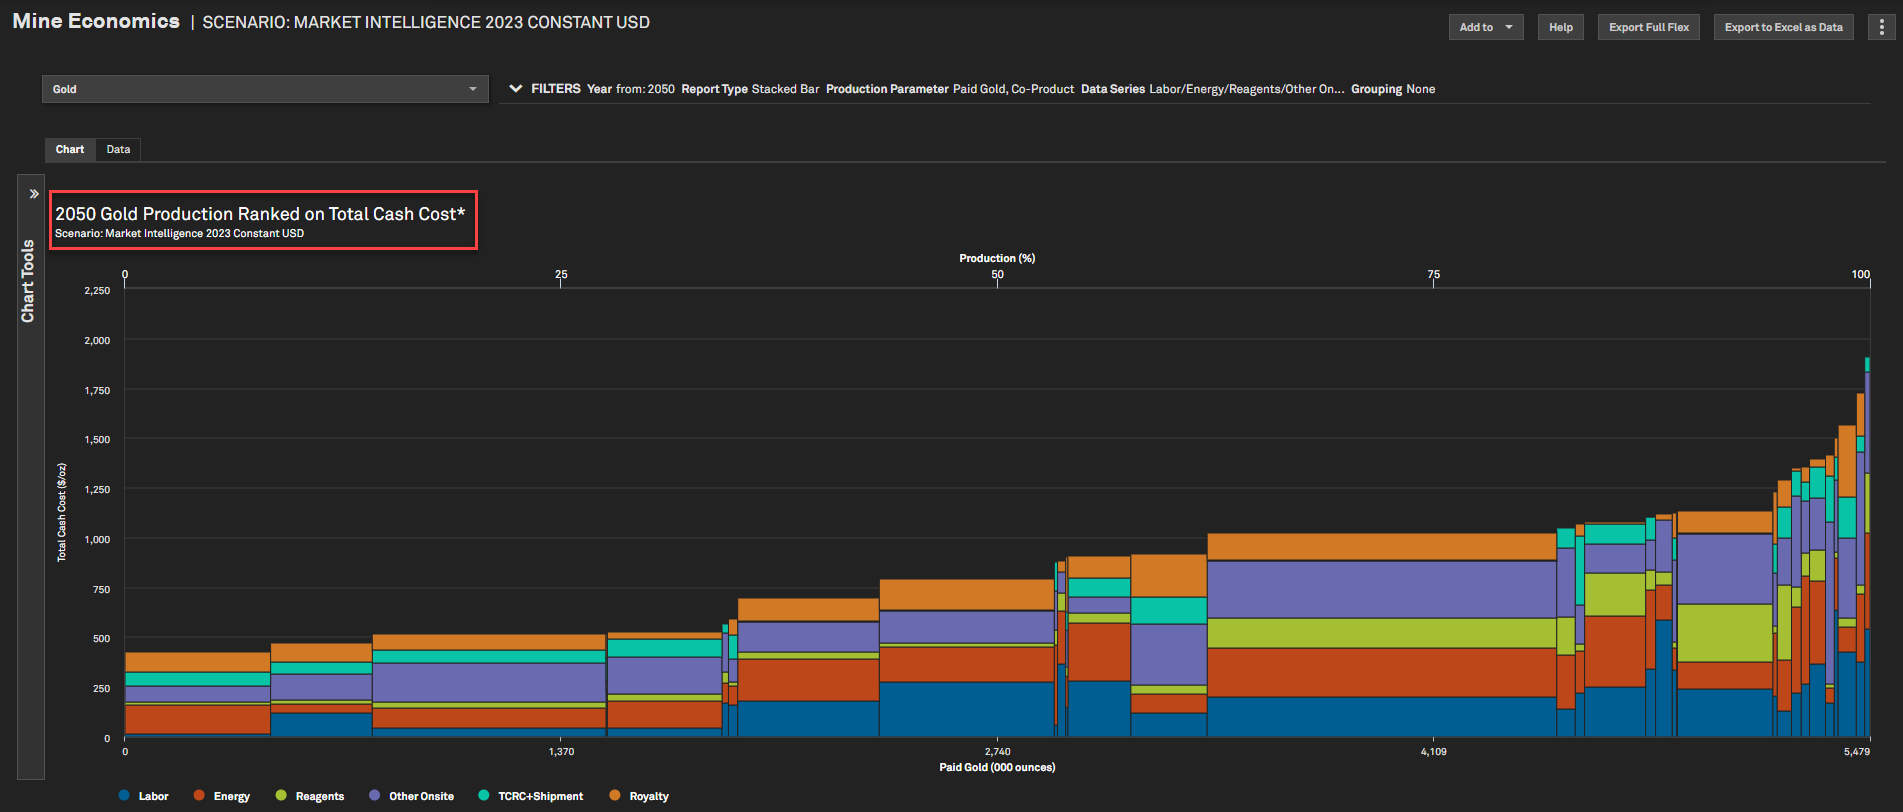
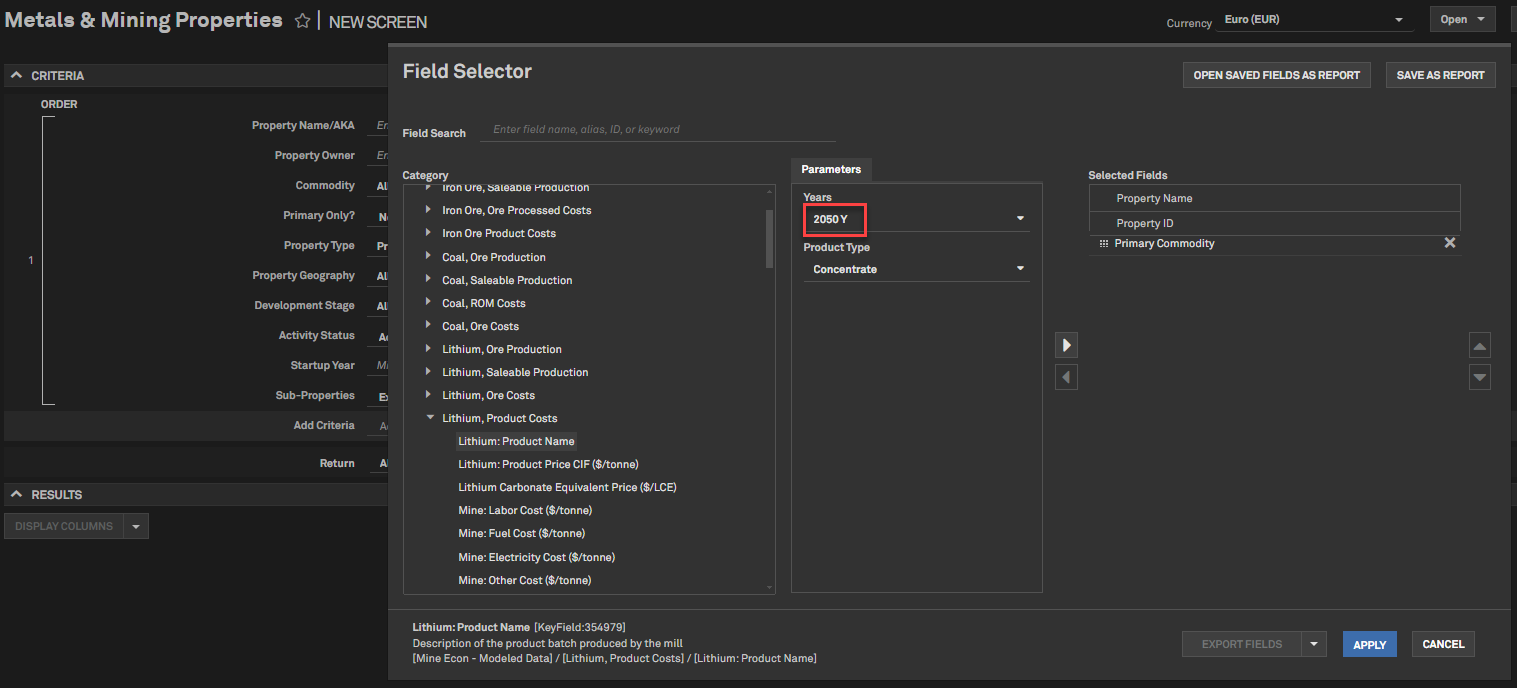
With the Cost Curve analysis expanded to 2050, users can now analyze mining costs over a longer time horizon. Whether evaluating projects or looking for cost-saving opportunities, this expanded view facilitates better business decision-making.
Find it in the platform:
- On the Metals & Mining profile specialization, navigate to the Mine Economics Cost curve from the Metals & Mining dropdown from the top navigation
- In the Year filter, select any year up to 2050 to view the Cost Curve for the additional years
Screener:
- Navigate to Screener from the top navigation or the Apps menu
- Go to Metals & Mining Properties dataset
- Click on Display Columns and expand the category Mine Econ – Modeled Data
- Expand any sub-category, e.g., Iron Ore, Ore Production and select the years up to 2050
Coverage stats:
- Cobalt, Copper, Gold, Iron ore, Lead, Lithium, Metallurgical/Coking Coal, Molybdenum, Nickel, Palladium, Platinum, Rhodium, Silver, U308, Zinc
Tech, Media & Telecommunications
In this release, we have launched the new Tower Location Database featuring over 200k locations across the United States, a Wireless License Database covering 70k+ licenses from 1800+ companies, and a U.S. Fixed Wireless Subscribers dataset with data on 1300+ operators. Additionally, we’ve added a Visualization widget on industry sector homepages and added a Research Summary page offering detailed insights on entities within the Corporate Profile page.
U.S. Tower Location Database
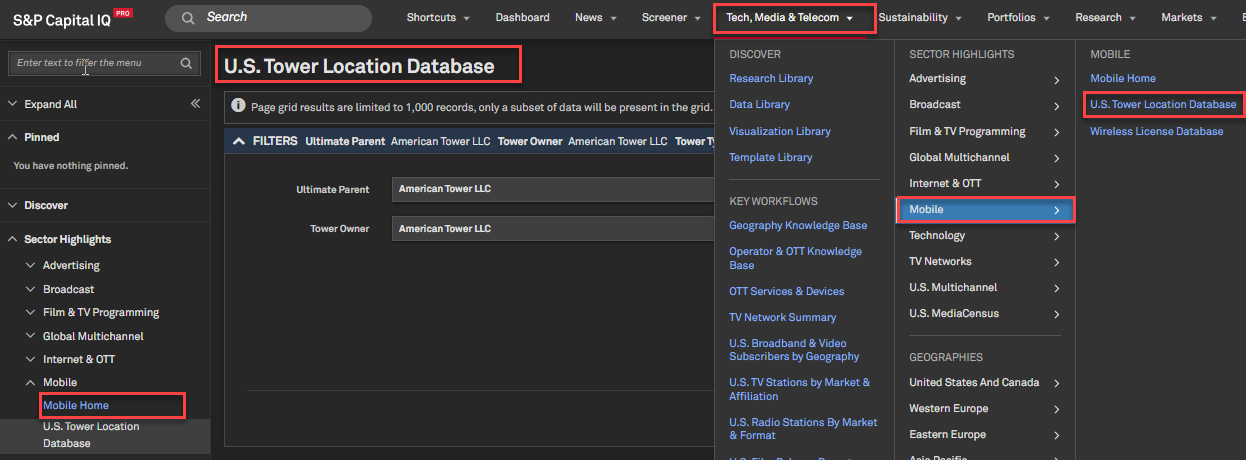
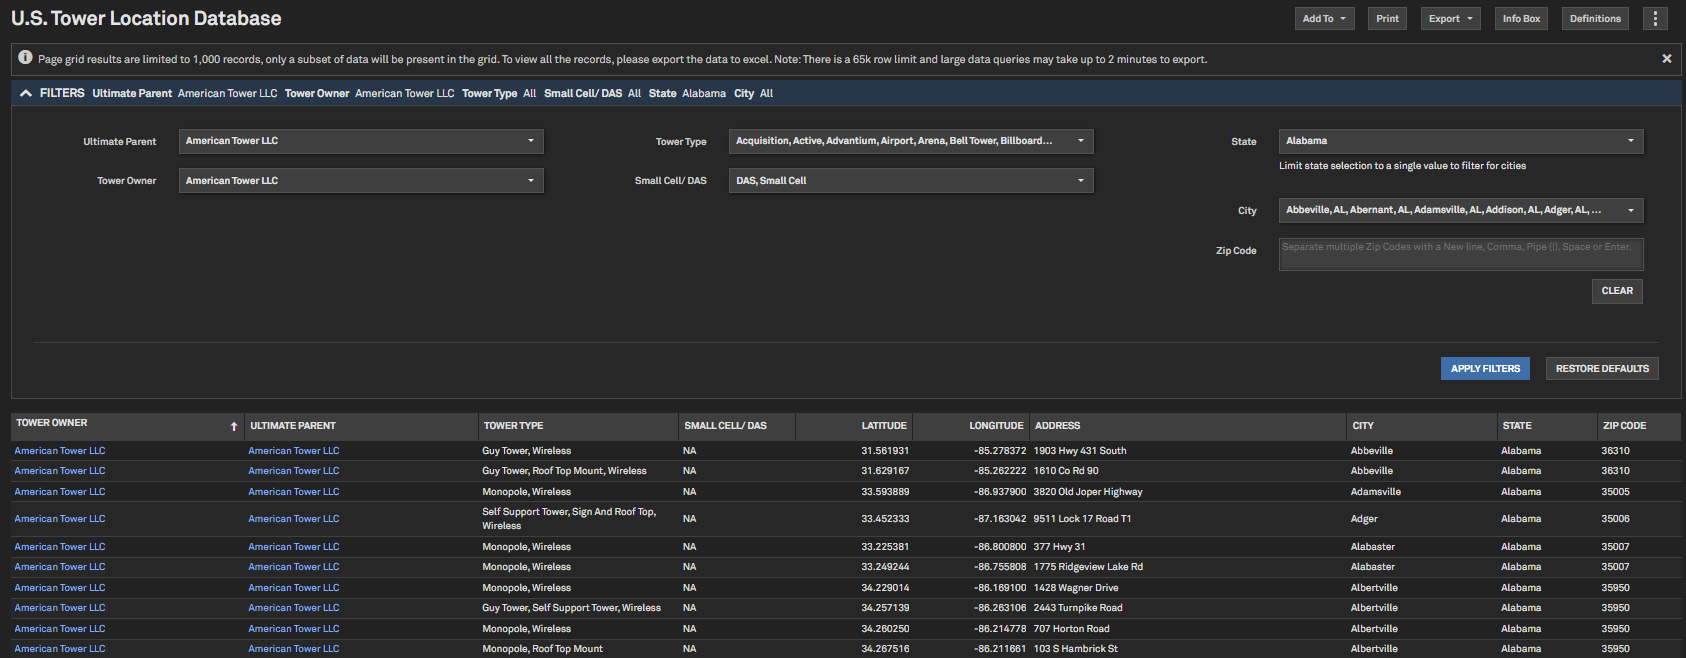
Users can now view the comprehensive tower location database, featuring over 205,000 tower locations across the U.S. with detailed latitude and longitude data. Users can drill down into the dataset using various filters, including Tower Owner, Ultimate Parent, Tower type, and geographic specifics such as State, City, Address, and Zip code.
Find it in the platform:
- On the Tech, Media & Telecom profile specialization, navigate to the Mobile Sector from the top navigation
- Click on Tower Location Database
U.S. Wireless License Database
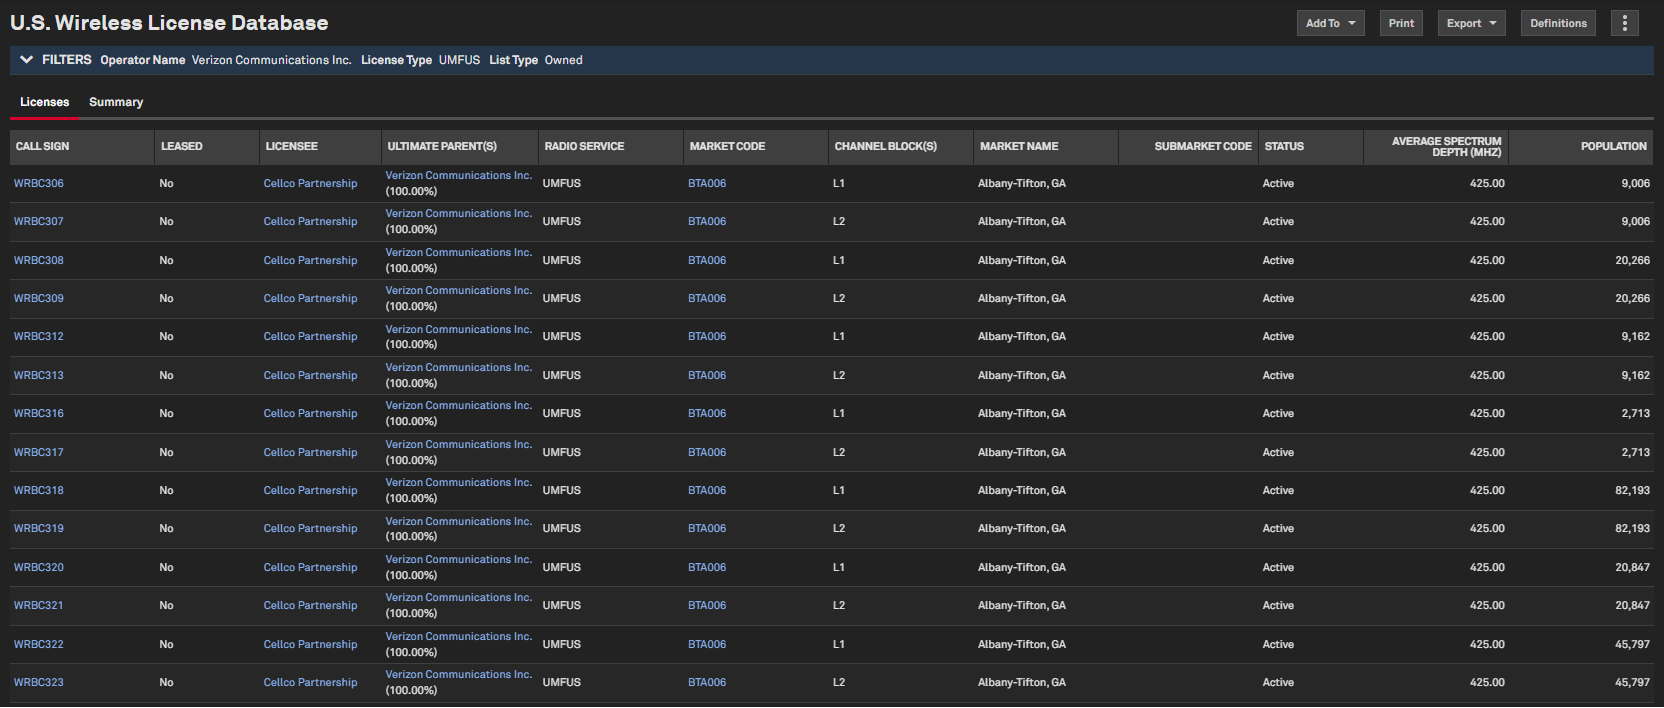
Users can view comprehensive Wireless license data by operator on this new page. This will enable users to view all wireless licenses owned by a particular operator along with relevant metadata both at the call sign level and the aggregated view.
Find it in the platform:
- On the Tech, Media & Telecom profile specialization, navigate to Mobile Sector from the top navigation
- Click on Wireless License Database
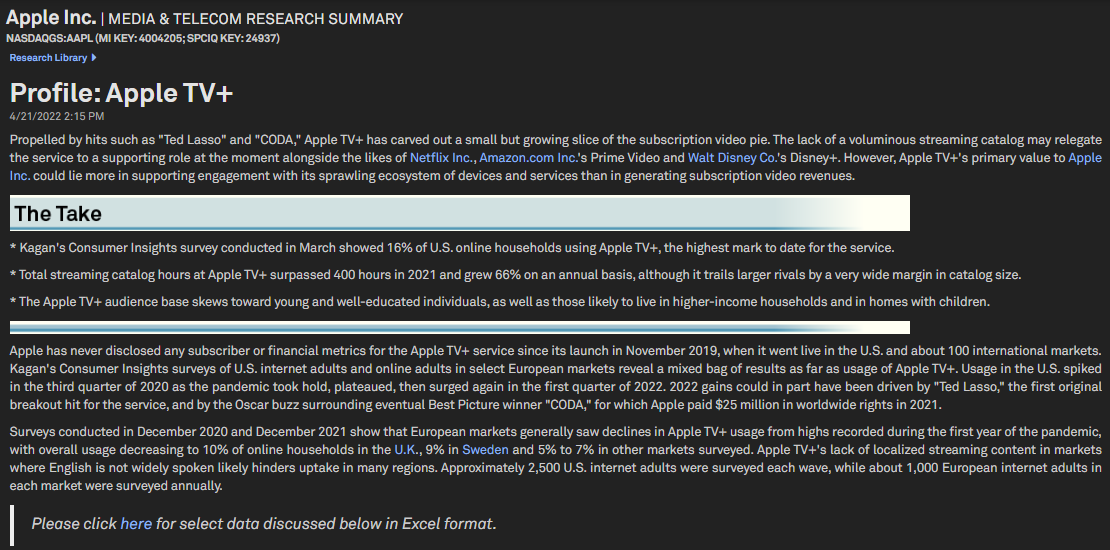
Media & Telecom Research Summary
Users can access a new Research Summary page with in-depth insights and expert analysis on specific entities, providing comprehensive performance, strategy and market position evaluations.
Find it in the platform:
- On the Tech, Media & Telecom profile specialization, search for a company with Over-the-Top service, such as Netflix
- Navigate to Corporate Profile and expand Assets and Operations
- Click on Media & Telecom Research Summary
Coverage stats:
- Currently available only for OTT services, with plans to expand to other entity types in the future.
Visualizations on Sector Homepages
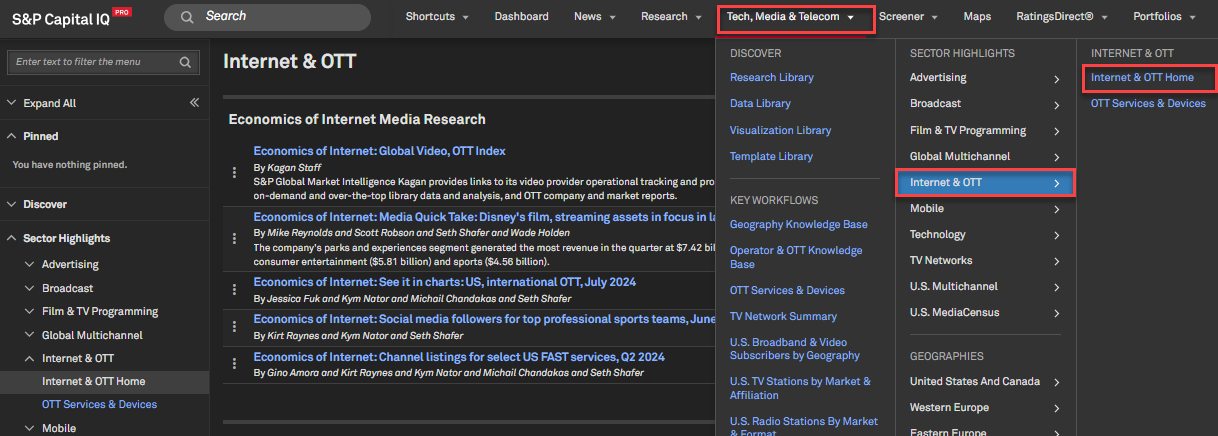
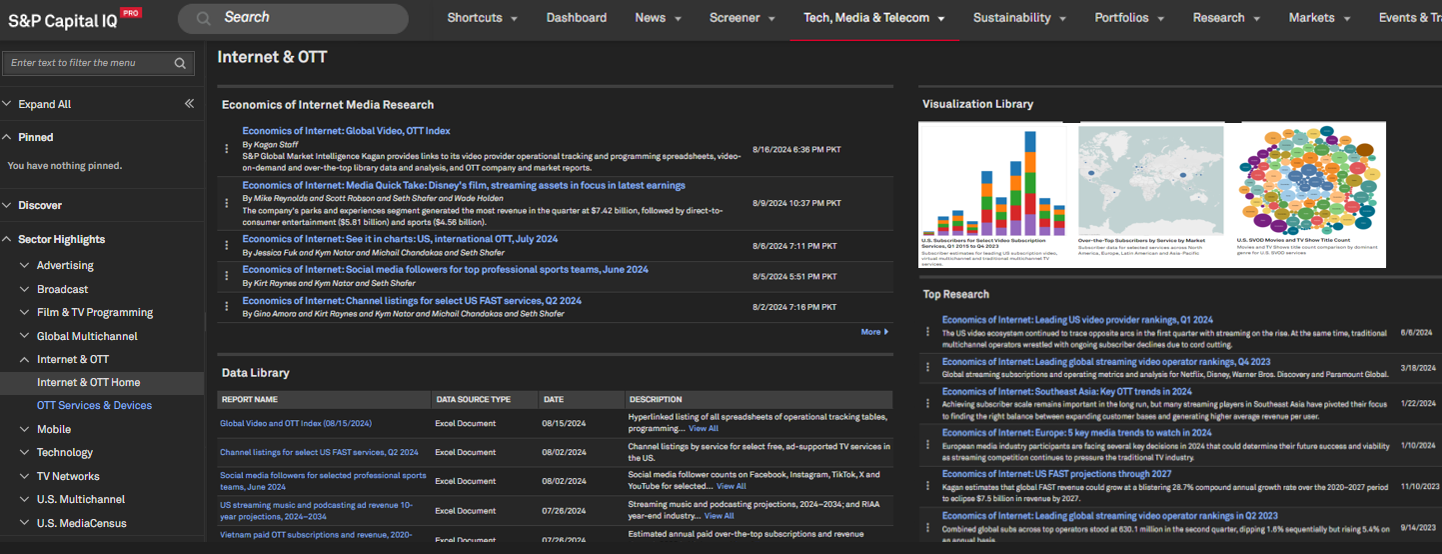
Users can now view industry-specific visualizations created with proprietary data on selected Tech, Media & Telecom sector homepages.
Find it in the platform:
- On the Tech, Media & Telecom profile specialization, navigate to Tech, Media & Telecom from the top navigation
- Select a sub-industry from the Sector Highlights, e.g. U.S. MediaCensus
- Click on the corresponding homepage, e.g., U.S. MediaCensus Home
Fixed Wireless Subscribers data for Video & Broadband
Users can view fixed wireless subscribers within the Broadband and Video Subscriber by Geography report filtered at different geography levels based on report type. This generates focused results along with technology-type values that are now aligned with FCC-reported data.
Find it in the platform:
- On the Tech, Media & Telecom profile specialization, navigate to Tech, Media & Telecom from the top navigation
- Click U.S. MediaCensus under Sector Highlights
- Click on Broadband & Video Subscribers by Geography

Boolean Search on Data Library
With this release, users can use Boolean operators to search within the Data Library. Users can also use the check box to focus their search on the Report name column only for more focused results.
Find it in the platform:
- On the Tech, Media & Telecom profile specialization, navigate to Data Library from the top navigation
- Type keyword in Search by Keyword

Sustainability
In this release, we added PCAF data quality scores in company environmental pages to improve transparency and comparability of GHG Scope 1, Scope 2, and Scope 3 emissions. In addition, we have published 2024 ESG scores and CSA scores for 3,000+ companies.
PCAF Scores in Company Environmental Pages
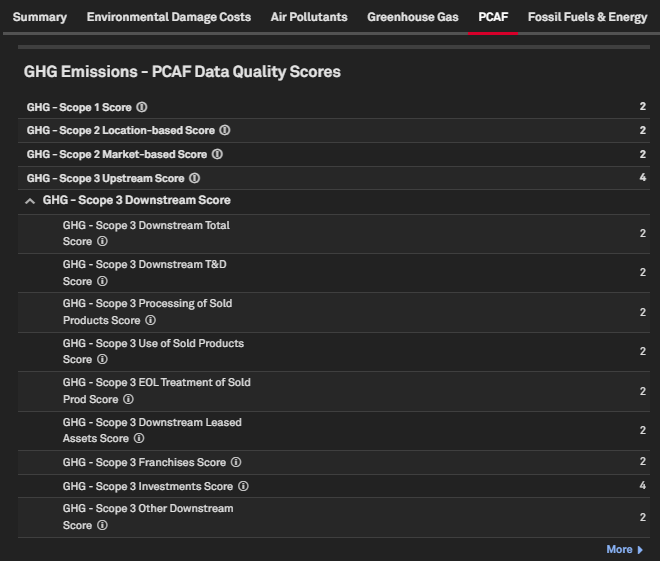
Users can access PCAF Data Quality Scores for S&P generated Scope 1, 2, and 3 GHG emission disclosures. The scores are based on financed emissions methodology and can help improve the transparency and comparability of emissions data disclosures.
Find it in the platform:
- Search for and select a target company from the top search bar and navigate to the Corporate Profile
- From the left menu, navigate to ESG & Climate > Environmental Analytics, and select either Environmental Profile, Environmental History, Environmental Briefing Archive, Environmental Peer Analysis
- Or view the list of covered companies on the Sustainability Coverage List page under the Sustainability menu in the top navigation
- In the row for your company of interest, locate the Environmental column and click Yes to navigate to the company’s Environmental Profile page

2024 ESG Scores Methodology Update
Users can now access the latest S&P Global ESG Scores and S&P Global CSA Scores. The latest scores are based on the 2024 annual CSA methodology, which evolves annually to ensure alignment with recent updates in recognized standards and frameworks and to accurately capture corporate efforts in answering upcoming sustainability challenges.
The updates to the CSA methodology include:
- Streamlining data requirements and reducing the length of the questionnaire
- Adjusting the questionnaire structure to promote transparency, delete the non-material topics and increase the public disclosure requirements
- Further alignment of the CSA with SBTi, CDP, TNFD, TCFD, and other recognized standards and frameworks, as well as integrating data from other S&P methodologies into the CSA
- Adding new and forward-looking metrics on the topic of Sustainable Raw Materials
Find it in the platform:
- S&P Capital IQ Pro platform
- Search for and select a target company from the top search bar and navigate to the Corporate Profile
- From the left menu, navigate to ESG & Climate > ESG Profile > ESG Scores
- Portfolio Analysis
- Select Portfolio Analysis from the Sustainability menu in the top navigation and select ESG Scores as the report type to access the ESG Portfolio Analysis report
- Or access ESG Scores in Portfolio Analytics available under the Sustainability > ESG Scores folder in the widget metric library
- Screener
- Navigate to Screener from the top navigation or the Apps menu
- Select Companies view and locate the Sustainability category under Browse Criteria on the left
- Expand ESG Scores category to find the updated fields
- S&P Capital IQ Pro Plug-in
- Launch S&P Capital IQ Pro Plug-in and open Formula Builder
- Under Data Items, expand Sustainability > ESG Scores to find the updated fields
Coverage stats:

Sustainability Overview Tile Update
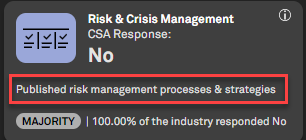
Users can now access the latest 2024 methodology year data for 3000+ companies. Since the existing question is no longer valid for 2024, we updated the Risk & Crisis Management tile sub-header and definition to support the 2024 methodology year data.
Find it in the platform:
- Search for and select a target company from the top search bar and navigate to the Corporate Profile
- From the left menu, navigate to Sustainability Overview
Coverage stats:
Portfolio Analytics
In this release, we expanded coverage by making composite portfolios accessible in the Dashboard Portfolio widget. We have also enhanced Batch Scheduler functionality, improved user experience with reusable custom grouping and an ability to quickly review security values in any of the reporting subperiods, regardless of security inclusion or exclusion in a portfolio at a given time.
Composite Portfolios in Dashboard
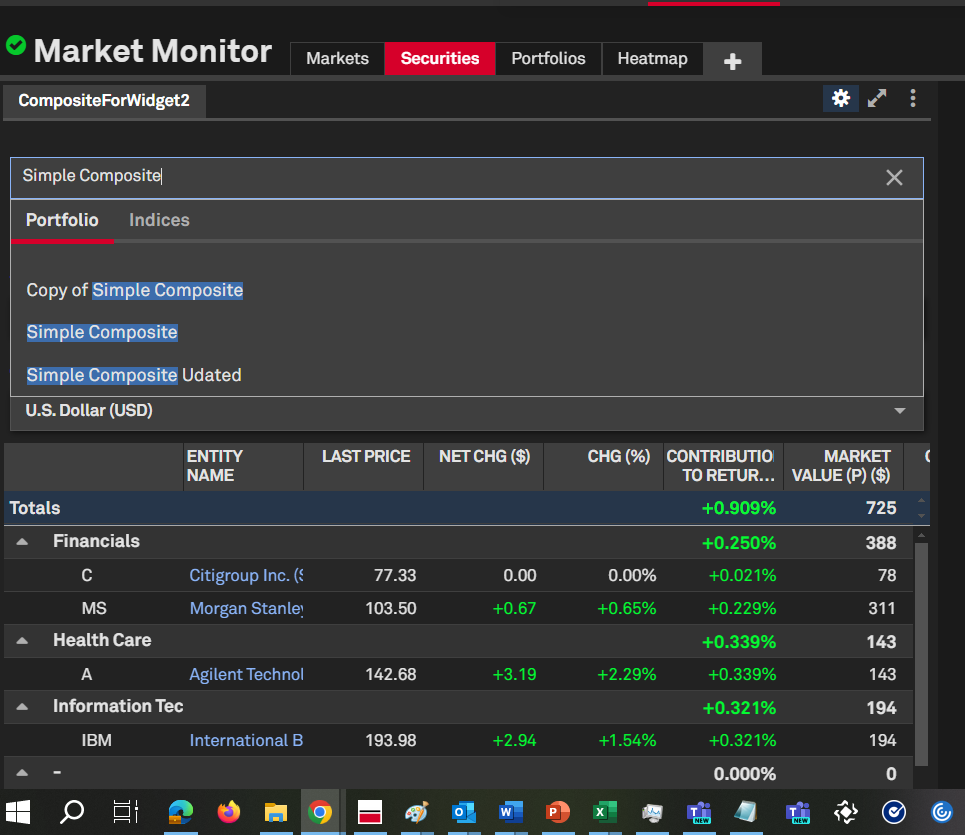
The Portfolio widget on the Capital IQ Pro Dashboard now allows users to access their composites and portfolios, which are available for selection.
Find it in the platform:
- Navigate to Dashboard, click on Add Widget and select Portfolio Widget
- In the Search Portfolio field, search for the desired composite portfolio
- The list will display composites along with portfolios
- Click on the composite name, which will refresh the portfolio widget with constituents and data for the selected composite
Ability to apply custom pricing to scheduled reports
Users can now apply custom or default pricing source to all layouts within the schedule when applicable.
Find it in the platform:
- Navigate to Portfolios from the top navigation and select Schedules
- Create a new schedule or edit an existing one
- Click on Options next to the schedule name
- Select Apply pricing options to all reports in schedule checkbox
- Set up a Pricing Source scheme
- Save the edited schedule
- All generated reports will automatically have the same pricing option applied

Duplicating an Existing Schedule
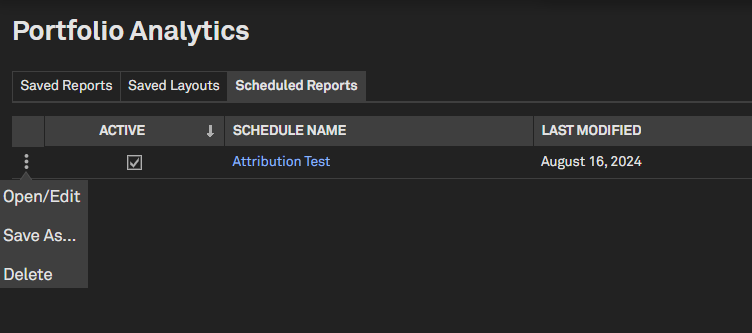
Users can copy a scheduled report, customize it and save it as a new version, allowing for duplication and quick editing of schedules that require only a few modifications in the selections.
Find it in the platform:
- Navigate to Portfolios in the top navigation and select Schedules
- Go to Saved Schedules and find the schedule to copy
- Right-click on the three-dot icon to the left of the schedule’s name
- Select Save As and make desired changes to the schedule
- Enter a new name and click Save
Application of Custom Grouping
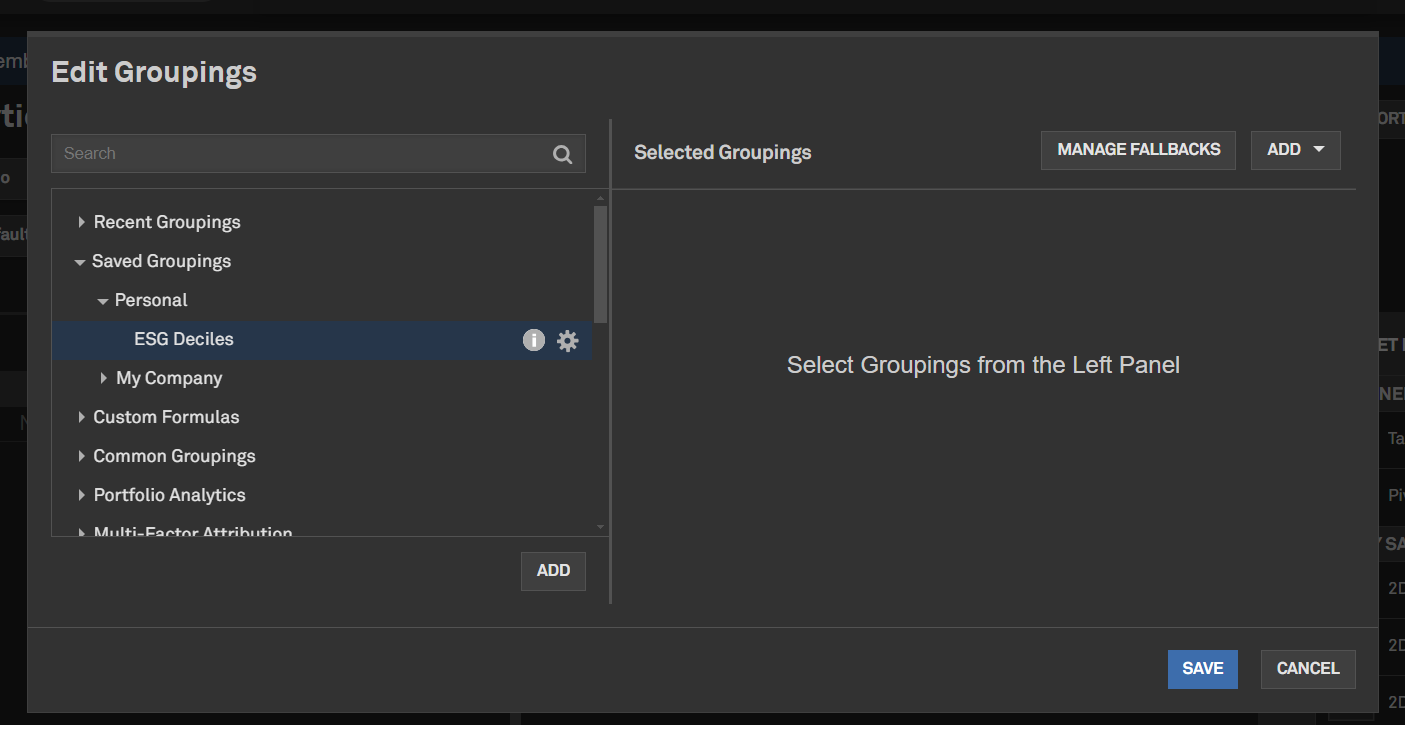
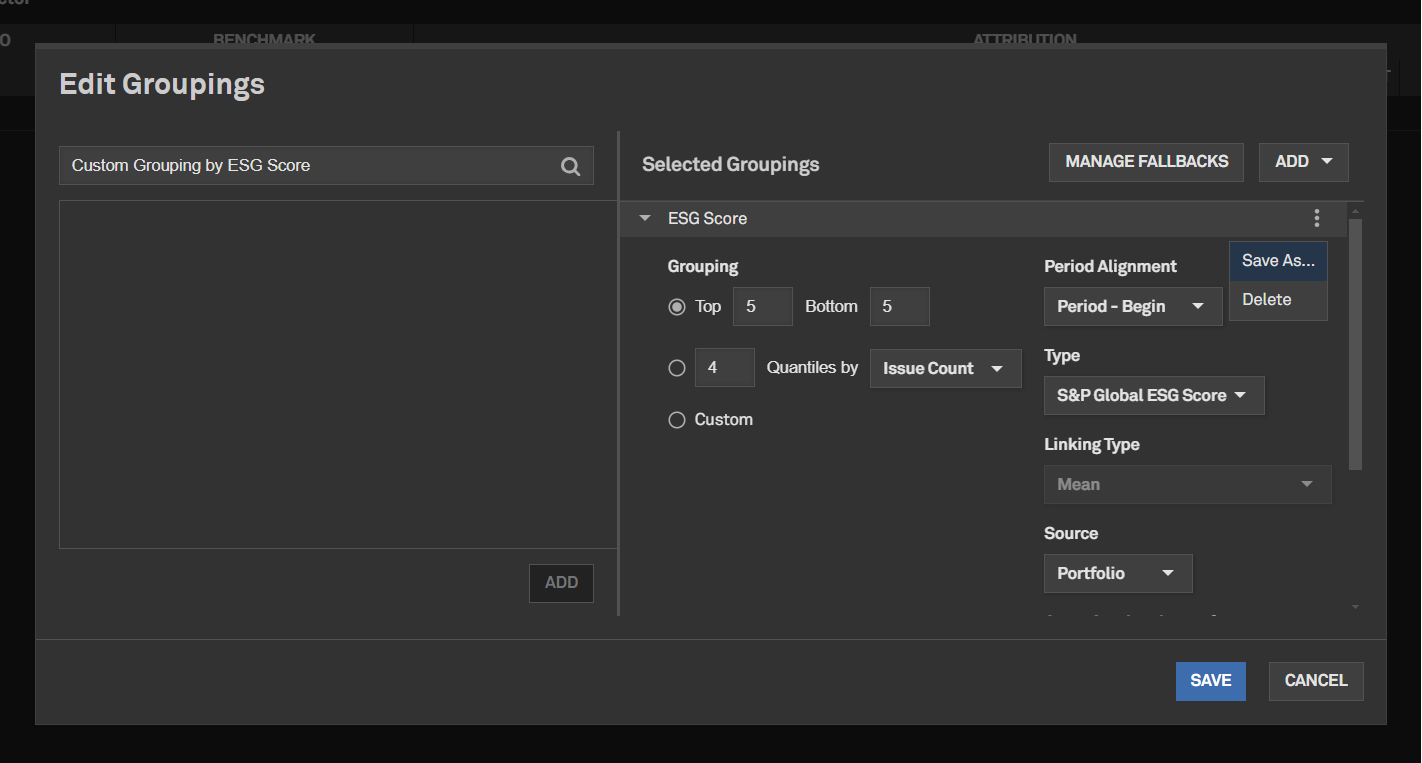
Users can now create and save groupings to the Custom Groupings library and apply them to any table or chart. This makes it easy to reuse commonly saved groupings across widgets and reports or share them with others in the company.
Find it in the platform:
- Navigate to Portfolios in the top navigation and select Reports
- Click on Grouping > Select Grouping
- In the selected grouping, click on the icon to the far right of the grouping name and select Save As
- Enter a name to the new grouping and click Save
- Choose whether the grouping will be accessible only to the user or shared firm-wide
- Click Save
- Users can find saved grouping when adding a grouping to the Global bar or a widget-specific grouping by navigating to the Saved Groupings folder
Instant Run Option for New Schedules
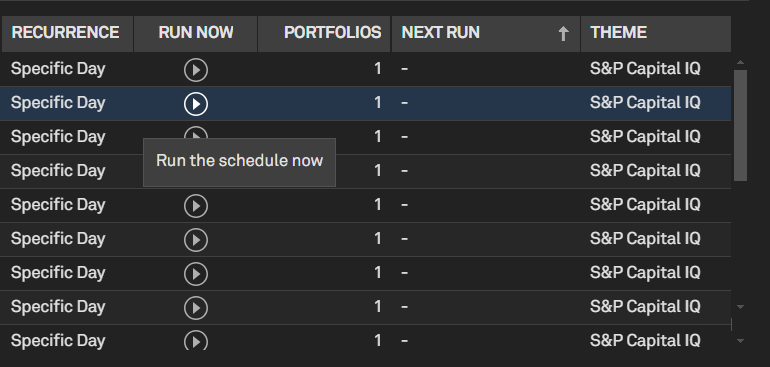
Users can now trigger the schedule at any time, including immediately after creation, by clicking the newly introduced ‘Run Now’ button.
Find it in the platform:
- Navigate to Portfolios in the top navigation and select Schedules
- Go to Saved Schedules
- Click on the Run Now arrow button to the right of the Recurrence column
- The schedule will be queued to run immediately
View Security Data for All Dates in the Portfolio
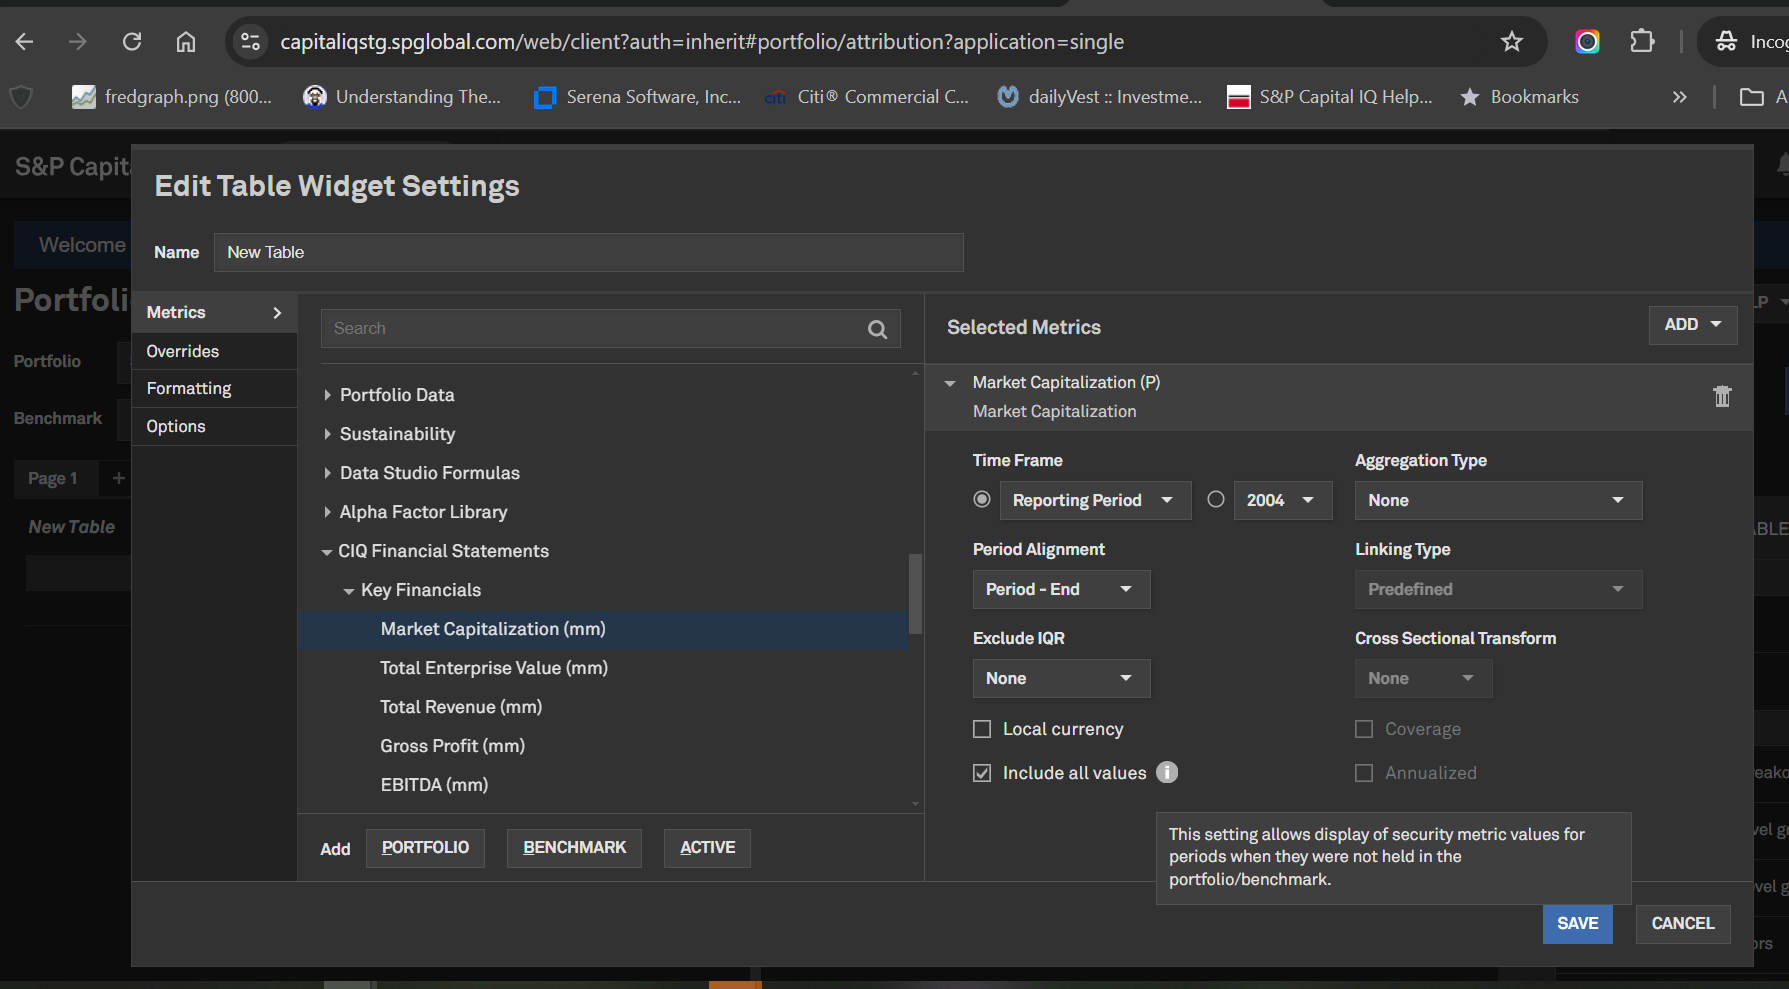
Users can view all associated numeric metrics for portfolio securities, regardless of their inclusion in the portfolio on a given date, to evaluate all holdings’ data side by side when applicable. Users can choose to display metrics for securities not in the portfolio during the subperiods.
Find it in the platform:
- Navigate to Portfolios in the top navigation and select Reports
- Select a report, edit or add a table widget
- Add or Edit metrics
- Click on the Include All Values checkbox for the metrics that should display value regardless of the holding’s inclusion in the portfolio during the time frame
- For metrics where this selection is applied, portfolio-level aggregation will default to None
- Save and Run the report
RatingsDirect®
In this release, RatingsDirect® introduced the Credit Monitor tool, a robust platform for users to track credit risk, set alerts, and conduct deeper analysis for a list of entities and securities. The CreditStats Direct® Reconciliation click-through functionality for Corporates provides transparent analyst adjustments across all financial statements, streamlining the reconciliation process. The updated top navigation RatingsDirect menu enhances user navigation, providing seamless access to RatingsDirect's comprehensive resources. These enhancements collectively elevate the user experience and decision-making process in credit analysis.
Credit Monitor
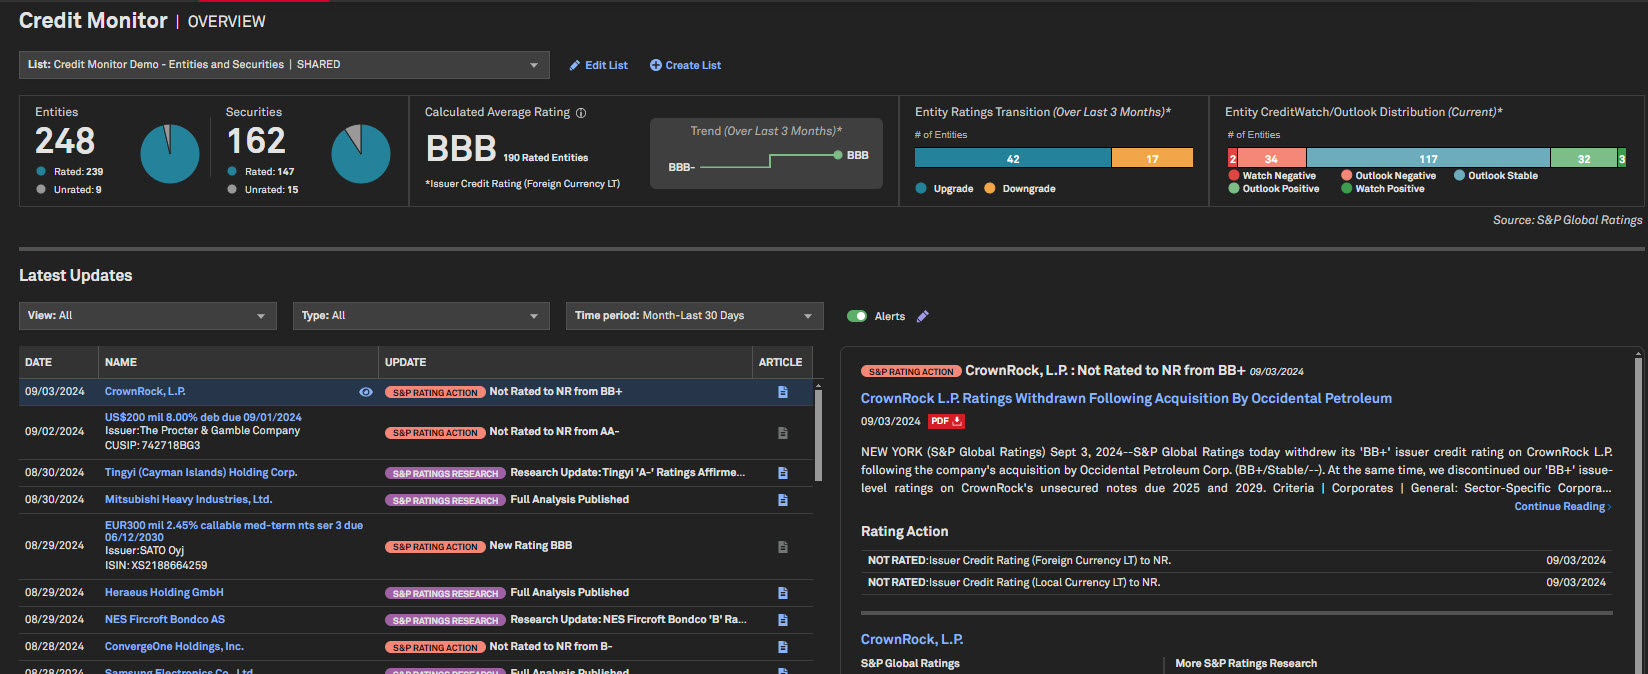
RatingsDirect® users can access the innovative Credit Monitor, a comprehensive tool designed to streamline credit risk monitoring for lists of entities and securities. This centralized hub provides users with an intuitive overview page showcasing the latest ratings and research updates, outlook distribution, average rating, and core Capital IQ Pro features such as filings and key developments across entities and securities in a list.
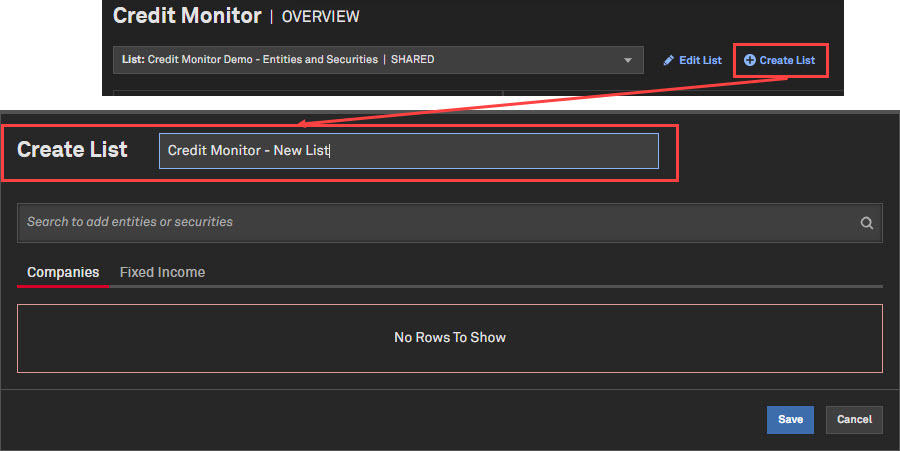
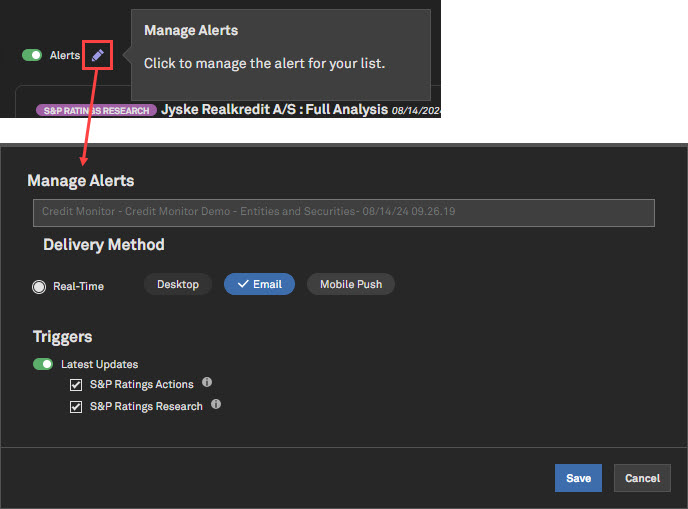
Users can create new lists, modify existing ones, and set up quick alerts for recent updates directly within the Credit Monitor interface. The tool supports lists comprising entities and securities, enabling users to conduct in-depth risk analysis tailored to their needs. The entity view provides access to credit ratings, outlook thresholds, and CreditStats Direct financials, while the security view provides insights into credit ratings and fixed income pricing data. The Credit Monitor equips users with tools to monitor credit risk effectively and make informed investment decisions.
Find it in the platform:
- Overview:
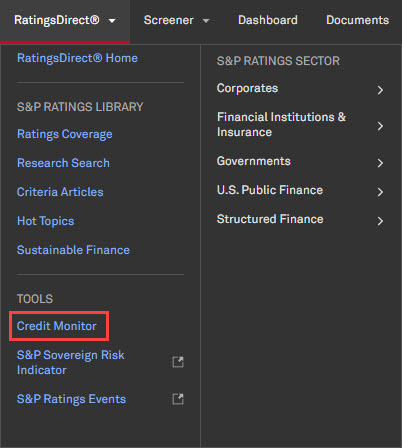
- Click the RatingsDirect® menu on the top navigation and select Credit Monitor in the Tools section
- Entity View:
- Within the Credit Monitor left-hand navigation menu, select Entity View
- Or Within the Credit Monitor ribbon, click the hyperlinked entity count
- Security View:
- Within the Credit Monitor left-hand navigation menu, select Security View
- Or Within the Credit Monitor ribbon, click the hyperlinked security count
- List Management
- At the top of the Overview page, click the List dropdown to select a personal or shared list
- Select Create List to create a new list of entities and securities
- Select Edit List to edit the selected list
- Quick Alerts
- Within the Latest Updates widget, toggle the Alerts radio button to enable alerts for the latest updates of the active list
- When toggled on, select the pencil icon to manage alert parameters
CreditStats Direct® Reconciliation Click-through for Corporates
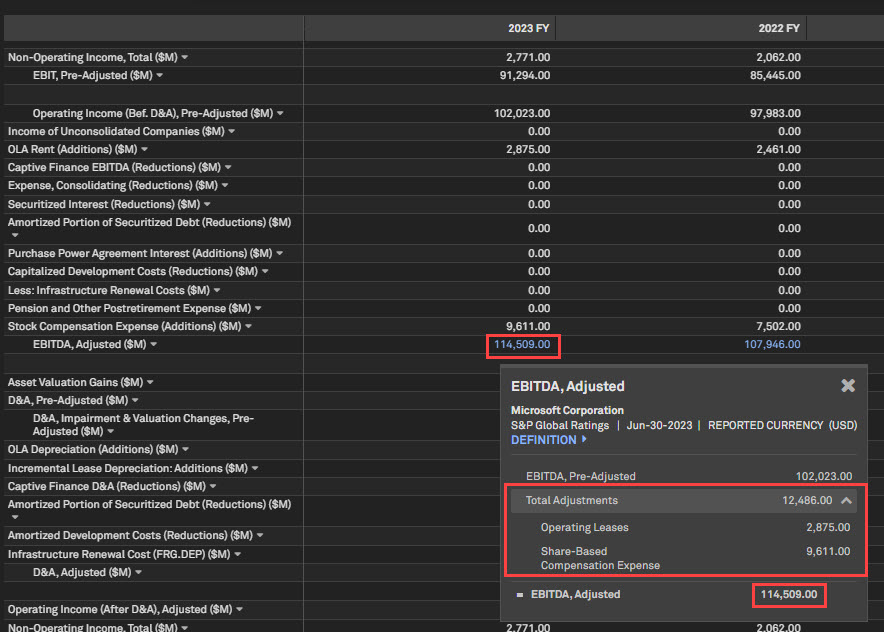
RatingsDirect users can benefit from the newly introduced CreditStats Direct® reconciliation click-through functionality for Corporates. This enhancement enables users to click on key financial line items within the CreditStats Direct® financial statements and instantaneously display a detailed breakdown that traces the analyst adjustments from pre-adjusted to adjusted financials. This feature provides a transparent look into the adjustments made by S&P Ratings analysts, ensuring users understand the methodologies applied by S&P Ratings. The click-through functionality streamlines the user experience by eliminating the need to navigate to a separate reconciliation page, saving time and simplifying the process of reconciling financial statements.
Find it in the platform:
- Navigate to the Corporate Profile of a corporate entity via search or hyperlinks throughout the Capital IQ Pro platform
- Expand the CreditStats Direct® menu within the RatingsDirect dropdown
- Select Financial Highlights, Income Statement, Balance Sheet, Cash Flow or Capital Structure
- Click on hyperlinked line items in the financial statements to open the reconciliation popup
Redesigned Top Navigation Menu
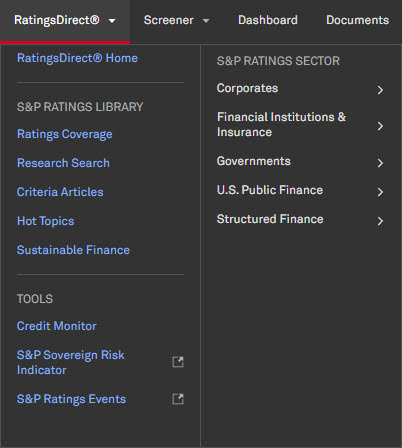
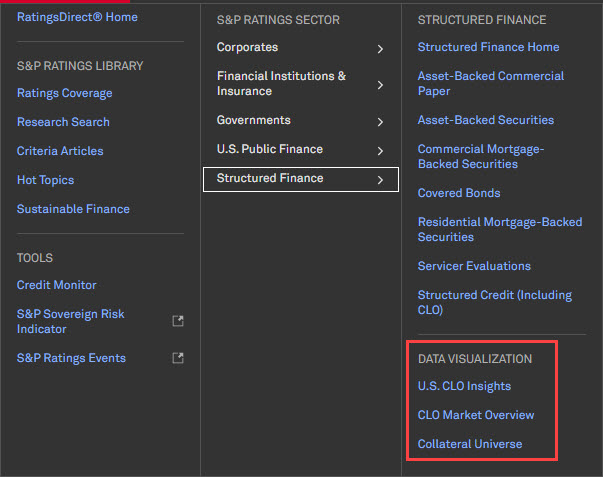
RatingsDirect® users can access a revamped and reorganized top navigation menu to improve navigation and offer an intuitive and streamlined workflow. The new menu is divided into three main sections: S&P Ratings Library, Sectors, and Tools.
The S&P Ratings Library section encompasses essential resources such as Ratings Coverage, Research Search, and Criteria Articles. The Sector section simplifies navigation to specific sectors, subsectors, or industries and access to sector-specific data visualizations. The Tools include productivity-enhancing features, such as the new Credit Monitor. The reorganization of the RatingsDirect top navigation menu is designed to enhance the overall user experience, making it more efficient and user-friendly.
Find it in the platform:
- Click the RatingsDirect® menu on the top navigation to access the new menu
S&P Ratings Entity Peer Analysis Excel Template
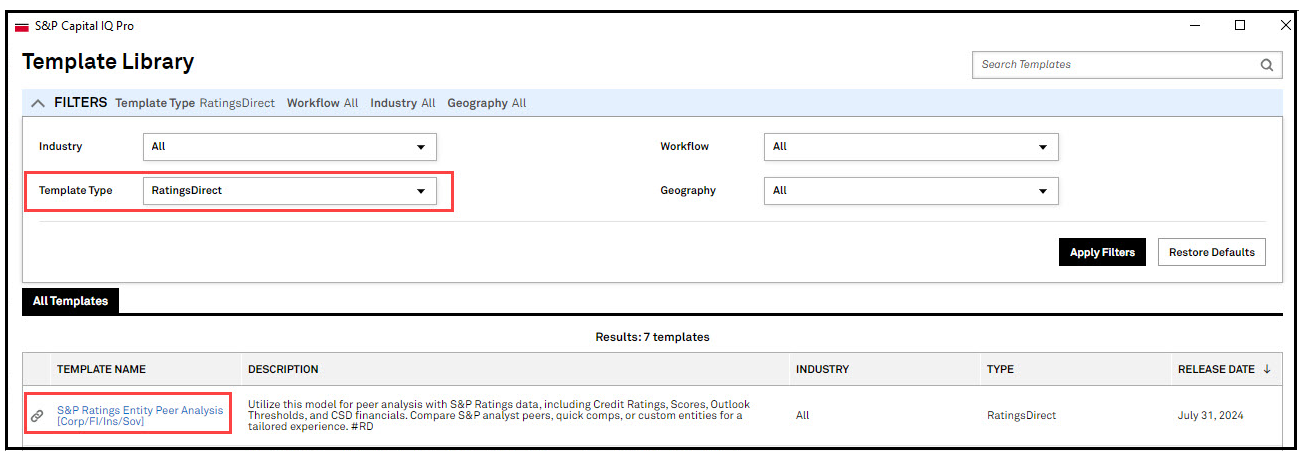
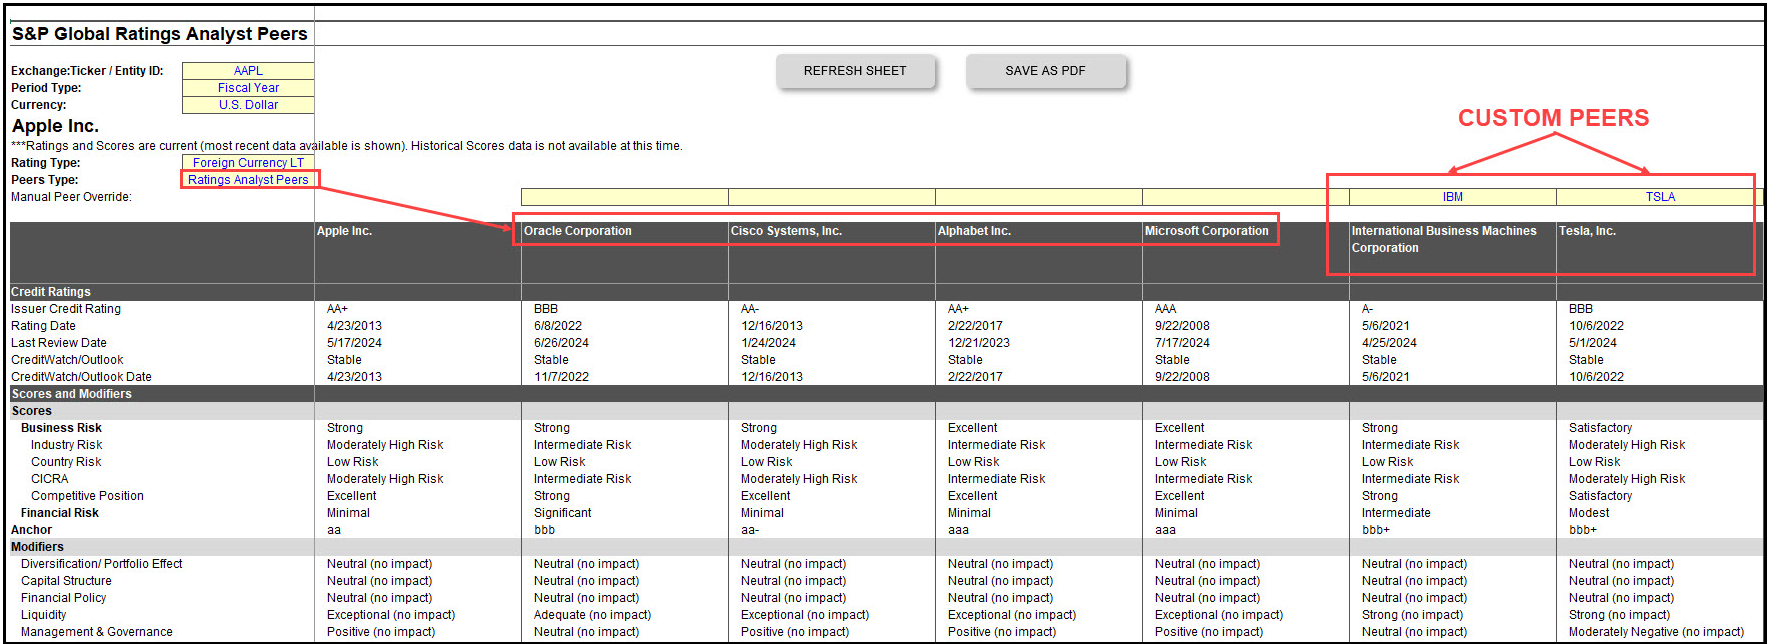
RatingsDirect users can access the S&P Ratings Entity Peer Analysis Excel template within the S&P Capital IQ Pro Plug-in template library. This template facilitates comprehensive peer analysis for Corporates, Banks, Insurance, and Sovereign entities, using S&P Ratings data, including Credit Ratings, Scores & Modifiers or Factors, Financial Outlook Thresholds, and CreditStats Direct financials. The model allows for comparisons utilizing S&P Ratings analyst peers, quick comps, or custom peer entities for a personalized experience. The tool also provides efficient PDF output downloads for reporting and presentations.
Find it in the platform:
- Launch S&P Capital IQ Pro Plug-in and open Templates
- Filter Template Type to RatingsDirect
- Click the S&P Ratings Entity Peer Analysis (Corp/FI/Ins/Sov) template to launch the model
Market Data
In this release, we added a new Index Aggregates Key Ratios widget and Index Analytics report on the Index Profile page, providing greater analytical capabilities to users. We also expanded our global data coverage by adding the Tadawul All Shares Index (TASI) family from Saudi Arabia and enhanced the history of four S&P Sharia indices. Additionally, users can now view previous day index close values and percentage change during exchange non-trading hours, enhancing parity between company-level and index-level pricing offerings.
Index Key Ratios Widget
Users can now view aggregated index ratios and multiples on the Index Profile page for supported S&P and FTSE indices. This provides a snapshot of underlying index constituents' financial health and performance. The widget also includes a hyperlink, which navigates users to Index Financials pages to facilitate deeper analysis.
Find it in the platform:
- Search for and select an Index from the top search bar
- Navigate to the Index Profile page to view the Index Key Ratios widget
- Click on More in the bottom-right corner of the widget to redirect to the detailed Index Key Ratios page, housing more fields and data for multiple periods
*Note: Access to FTSE index aggregates may require additional subscriptions/licenses. Please reach out to your Relationship Manager for details.

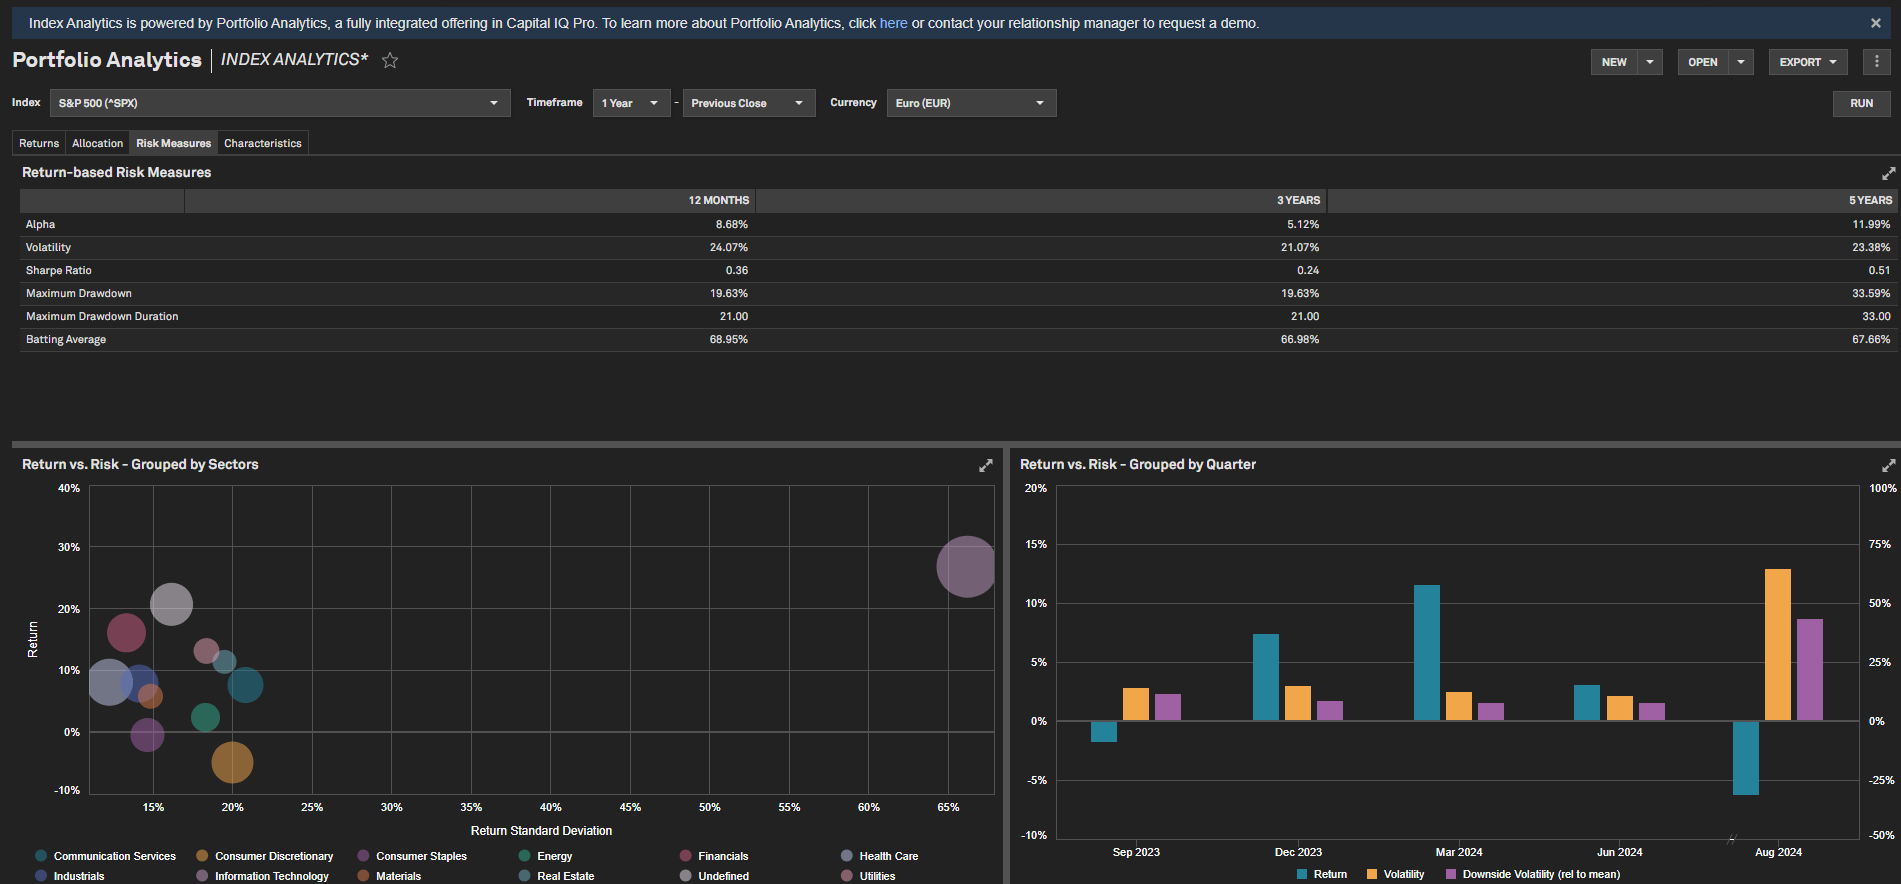
Index Analytics Report
Users can now leverage the new Index Analytics report on the Index Profile page to view risk, return, sector-level data and aggregated ratios & multiples for supported indices. This information is calculated via bottom-up aggregation of constituent-level data.
Find it in the platform:
- Search for and select an Index from the top search bar
- Navigate to the Index Profile page and click the Index Analytics hyperlink in the left-hand navigation menu
- Index Analytics report will open in a new tab
Note: The report is accessible for S&P Indices with constituent-level data that is freely available with the standard desktop package.

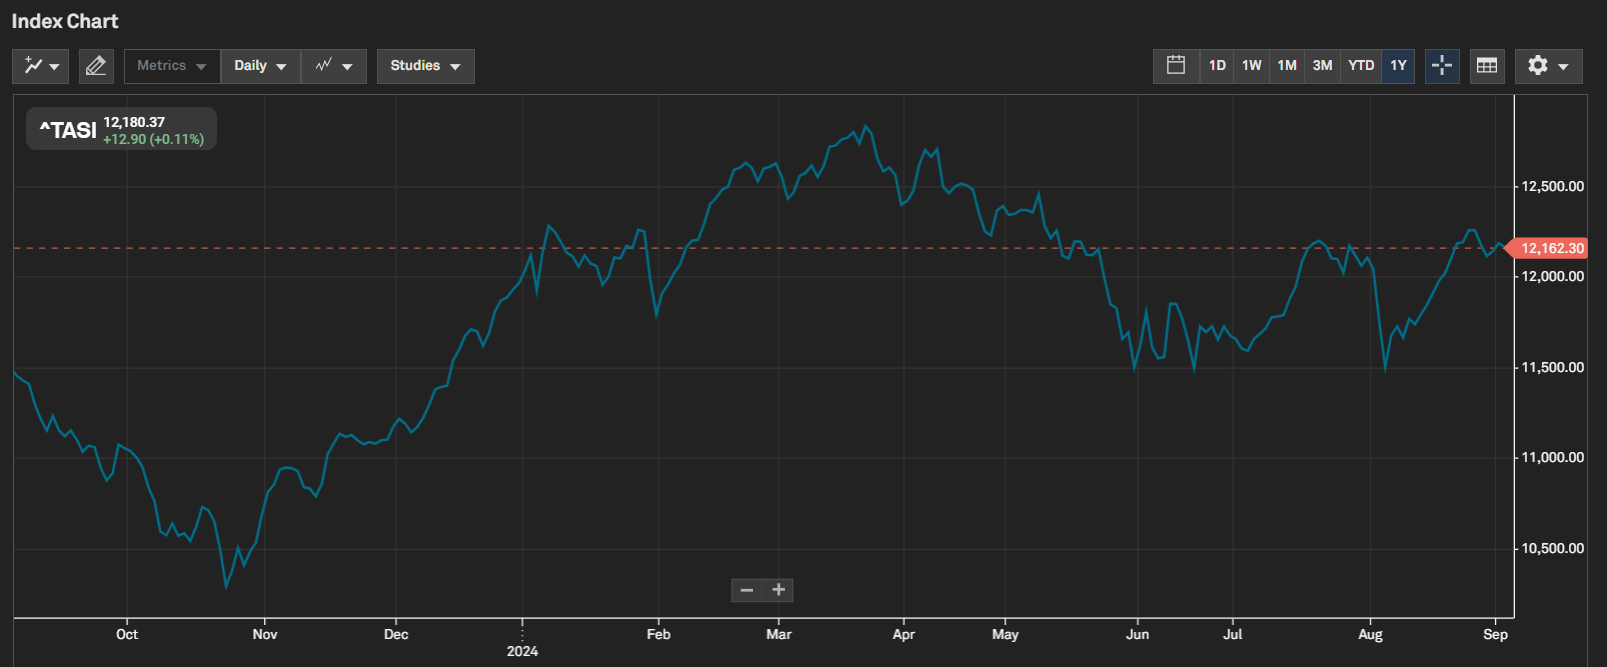
Index Coverage Expansion: Tadawul All Shares Index (TASI) Saudia Arabia Family
Users can access index prices for the TASI Saudi Arabia indices listed below, enhancing S&P Capital IQ Pro’s coverage in the Middle East region.
Find it in the platform:
- Index Prices:
- Search for and select an Index from the top search bar
- Navigate to the Index Profile page and scroll down to the Index Chart
Coverage stats: 22 Indices included in the TASI family listed below:
- Tadawul All Shares Index, Tadawul Energy Index, Tadawul Materials Index, Tadawul Capital Goods Index, Tadawul Commercial & Professional Svc Index, Tadawul Transportation Index, Tadawul Consumer Durables & Apparel Index, Tadawul Consumer Services Index, Tadawul Media and Entertainment Index, Tadawul Consumer Discretionary Distribution & Retail Index, Tadawul Consumer Staples Distribution & Retail Index, Tadawul Food & Beverages Index, Tadawul Health Care Equipment & Svc Index, Tadawul Pharma, Biotech & Life Science Index, Tadawul Banks Index Tadawul Financial Services Index, Tadawul Insurance Index, Tadawul Software & Services Index, Tadawul Telecommunication Services Index, Tadawul Utilities Index, Tadawul REITs Index, Tadawul Real Estate Mgmt & Dev't Index
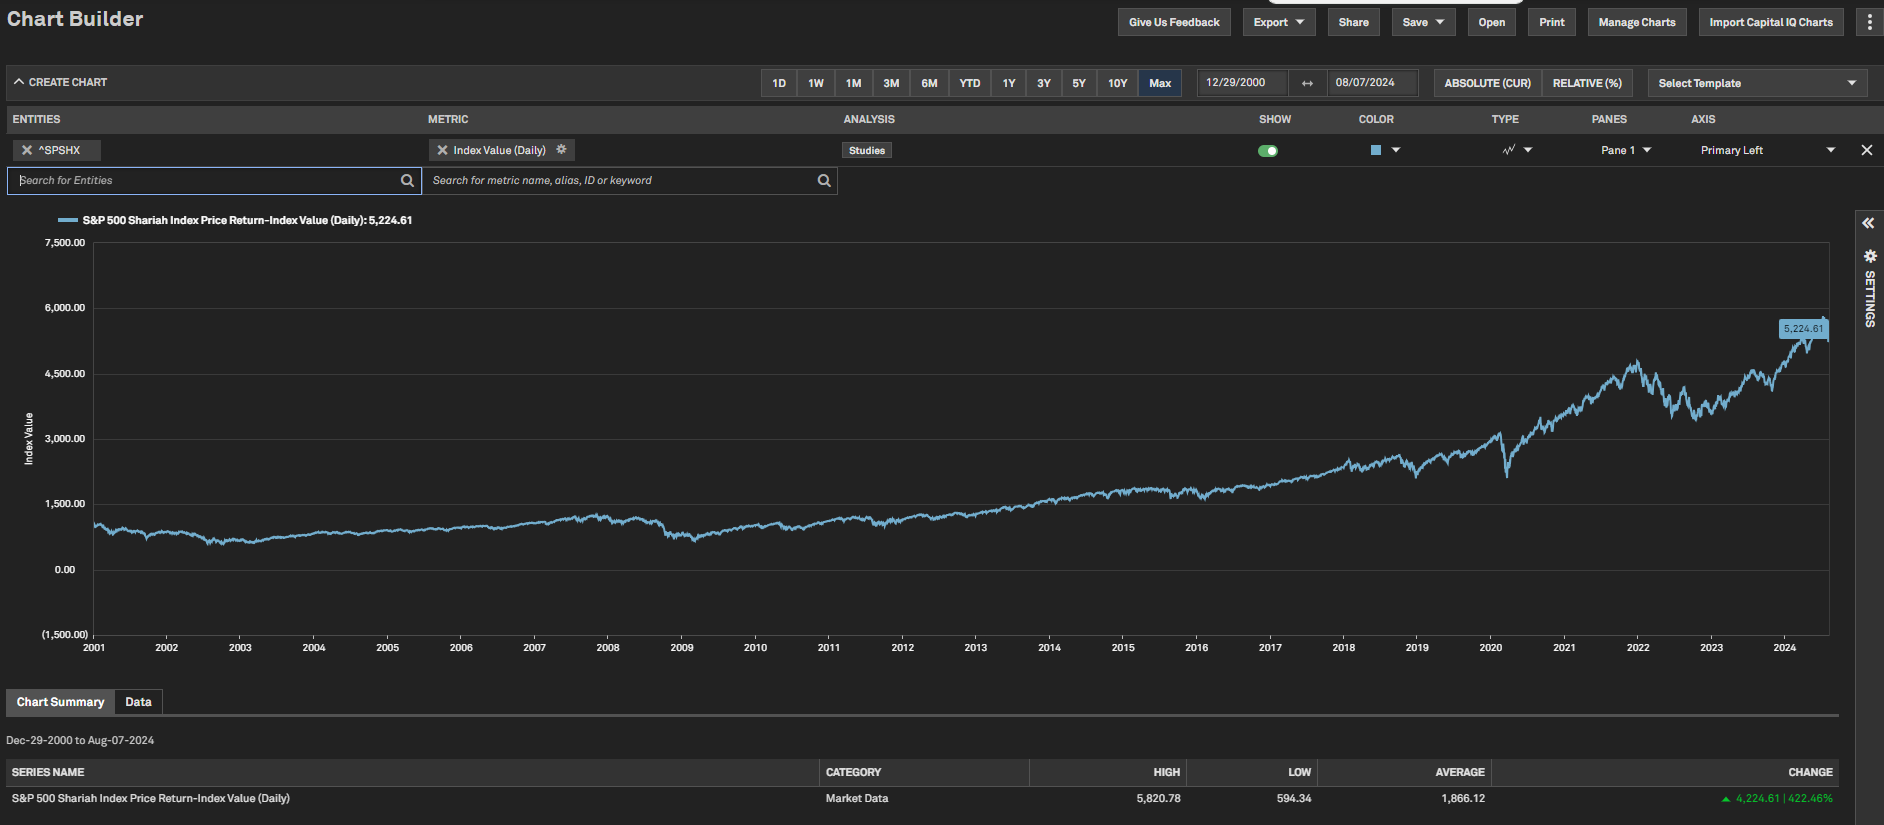
Index Pricing History Expansion: S&P Sharia Indices
Users can now view extended pricing history for the following indices. Previously available only up to early 2023, the pricing history has now been updated through the specified years
- S&P 500 Shariah Index – 2001
- S&P Pan Asia Shariah Index - 2007
- S&P Japan 500 Shariah Index - 2001
- S&P EUROPE 350 Shariah Index – 2001
Find it in the platform:
- Navigate to Chart Builder from the top navigation bar or the Apps menu
- Add any of the above four indices to the chart using the Entities Search
- Select Index Value as the metric
- Select Max as the pricing history period
Pre-Market Close and Change Percentage for Indices
Users can now view the previous day’s closing price and price change percentage for indices, even when the underlying securities are not trading.
Find it in the platform:
- Index Profile:
- Search for and select an Index from the top search bar
- Closing Price and Price Change percentage will be available during non-trading hours within the Market Data section
- Dashboard:
- Navigate to Dashboard and open the Add Widget menu on the top right
- Select Quote widget to add it to the Dashboard
- Select an Index in the widget
- Closing Price and Price Change percentage will be available during non-trading hours


Custom Reports
In this release, we provided the ability to download financial data from the Key Stats, As Reported, and Templated Financials pages using the new Custom Export option. This feature provides a fast and efficient way to download data while ensuring full transparency and control over the datasets exported.
Custom Export
Users can now download financial data from the Key Stats, As Reported, and Templated pages using the new Custom Export option available in the Exports dropdown menu.
Find it in the platform:
- Search for and select a company from the top search bar and navigate to the Corporate Profile
- Navigate to Financials > Keystats > Templated or As Reported and select a required page
- Click on the Exports drop-down menu on the top right
- Click on Custom Export, select the pages to download and click on Generate Excel file
- Report will be downloaded in the browser


Corporate Profile
In this release, we added the ability to click-through and audit market data metrics such as Market Capitalization and Total Enterprise Value on the Corporate Profile. This enables users to dive deep into the calculation components and understand how the final values are derived.
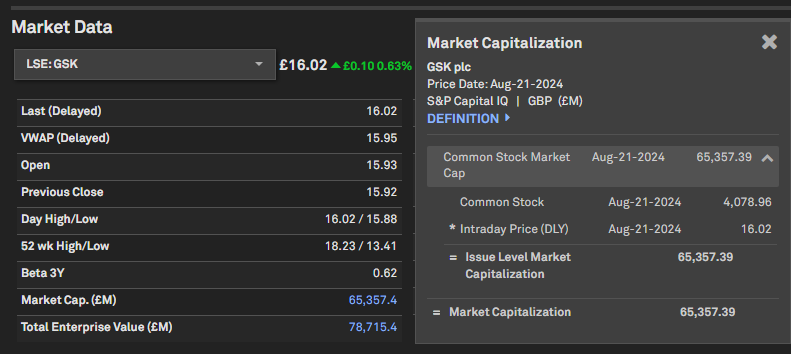
Market Data Click-through
Users can now audit market data metrics such as Market Capitalization, Total Enterprise Value and Implied Market Capitalization on the Corporate Profile Market Data widget.
Find it in the platform:
- Search for and select a company from the top search bar and navigate to the Corporate Profile
- Click on the hyperlinked Market Capitalization or Total Enterprise value in the Market Data widget to launch click-through
- Continue to click to navigate through various levels of the audit
Transactions
In this release, we added click-through functionality for M&A forward multiples for better transparency. We also added industry averages for M&A multiples and premiums, enabling users to compare the existing M&A deal multiples with the industry averages derived from comparable deals. Finally, we expanded our M&A coverage to include reinsurance block deals and related data items.
Click-through for Estimates and Pricing Ratios
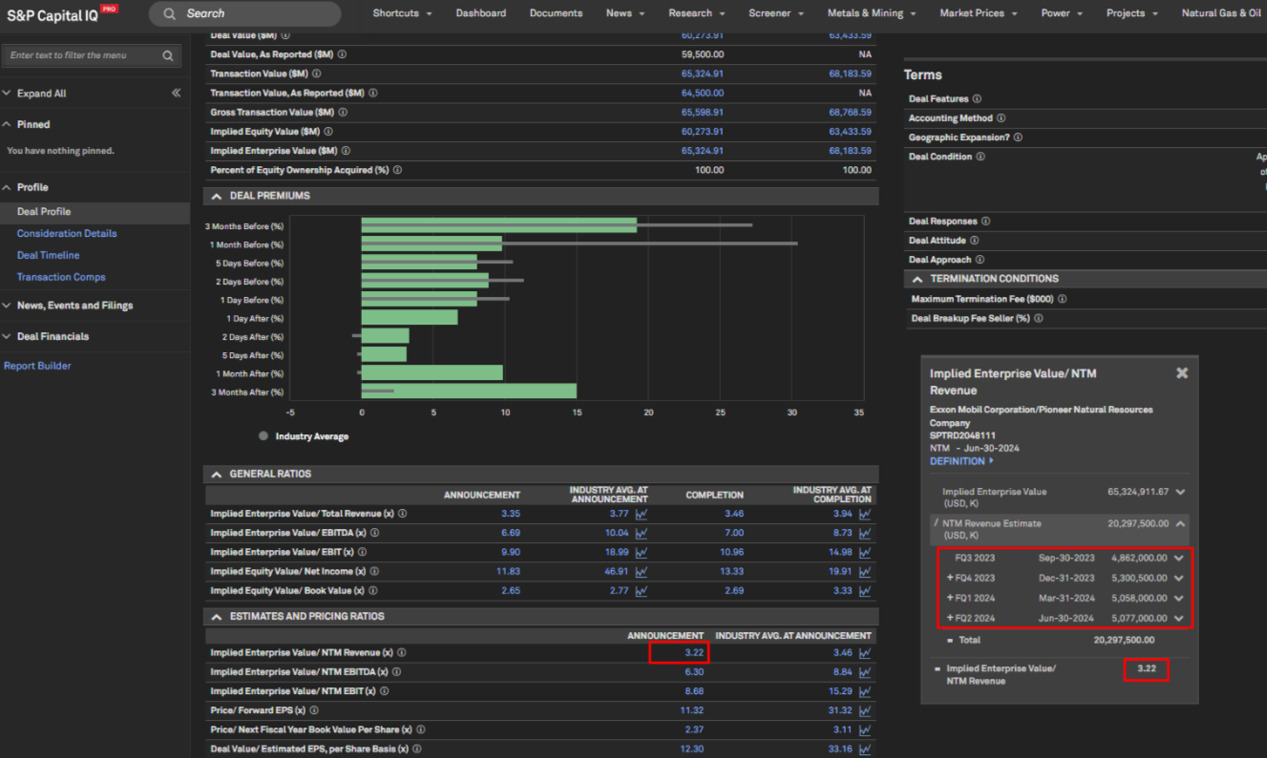
Users can now click through and audit M&A forward multiples to see how they are calculated based on broker estimates found in investment research documents.
Find it in the platform:
- Search for and select a company in the top search bar to navigate to the Corporate Profile page
- Expand Transactions in the left-hand navigation, and select the Detailed M&A History page
- Open an M&A transaction and navigate to Estimates and Pricing Ratios, e.g., Transaction ID SPTRD2048111
- Click on Implied Enterprise Value/ NTM Revenue value to open the click-through pop-up window and audit the calculations to the available source documents
- Similarly, click any hyperlinked metric in Estimates and Pricing Ratios to view the calculation details
- Click-through is also available for Estimates and Pricing Ratios on Transactions Screener and S&P Capital IQ Pro Plug-in
Note:
- Access to a specific broker's investment research requires respective broker entitlements.
Industry Averages on M&A Profiles
Users can now compare an M&A deal’s multiples and premiums against industry averages on the deal profile page, with visuals indicating the deal’s pricing performance against industry trends. Users can click through to review the peer deals and the criteria used to calculate the respective industry average as well as a historical sector trend of the multiple under review.
Find it in the platform:
- Search for and select a company in the top search bar to navigate to the Corporate Profile page
- Expand Transactions in the left-hand navigation, and select the Detailed M&A History page
- Open an M&A transaction and navigate to the Valuation section containing Deal Premiums, General Ratios and Estimates and Pricing Ratios, e.g., Transaction ID SPTRD2048111
- Review the valuation metrics against their corresponding industry averages
- Click on the average values or the line graph icons in the Ratios widgets to review peer deals and historical sector trends, respectively

Reinsurance M&A Deals Expansion
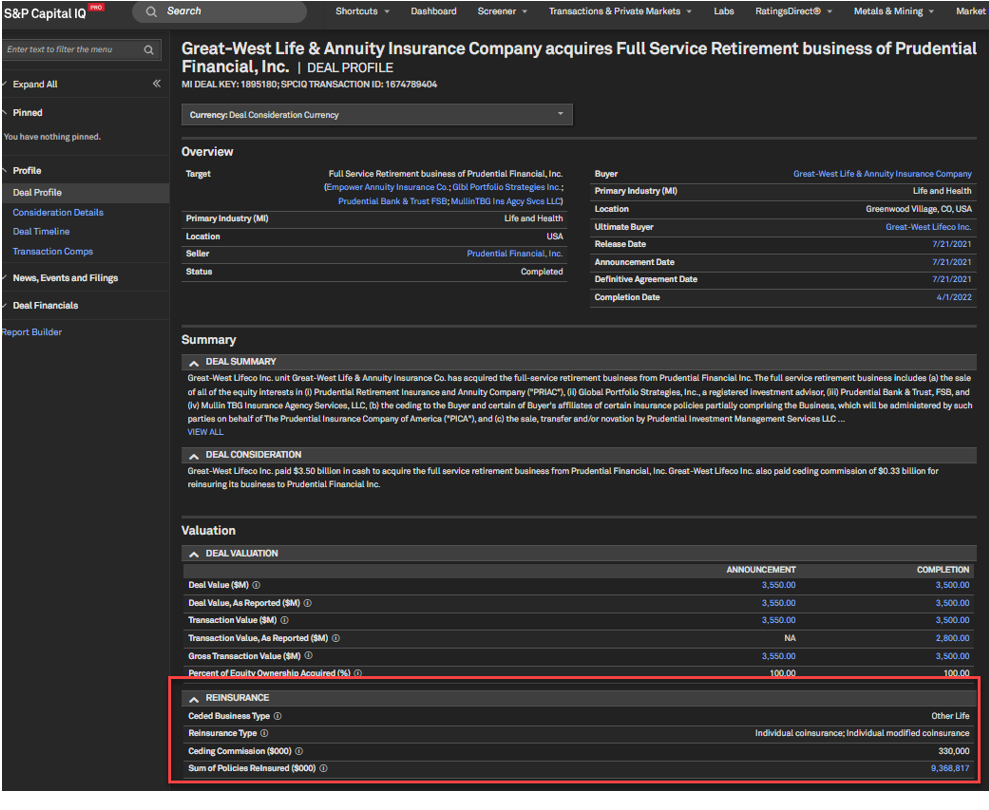
Users can now access enhanced M&A coverage with the addition of reinsurance block deals and reinsurance-specific data items, available on the M&A Deal Profile page, Screener and S&P Capital IQ Pro Plug-in. The new Reinsurance M&A feature type allows users to filter for such deals across Transactions pages and Screener. These reinsurance block M&A deals are also credited on M&A league tables.
Find it in the platform:
- Navigate to Screener from the top navigation or the Apps menu and select Transactions under Key Workflows
- In the Browse Criteria, expand M&A Details > M&A Feature Type
- Add criteria for M&A Feature Type in Reinsurance and Run Screen
- Open Display Columns and expand M&A Details > Industry Specific > Reinsurance to find new Reinsurance-specific data items:
- Ceded Business Type
- Reinsurance Type
- Ceding Commission
- Sum of Policies Reinsured
- Alternatively, when you are in a deal profile of an M&A deal that involves a reinsurer, you can navigate to the Reinsurance widget to find new fields
New Underwriter Roles on Offerings League Tables
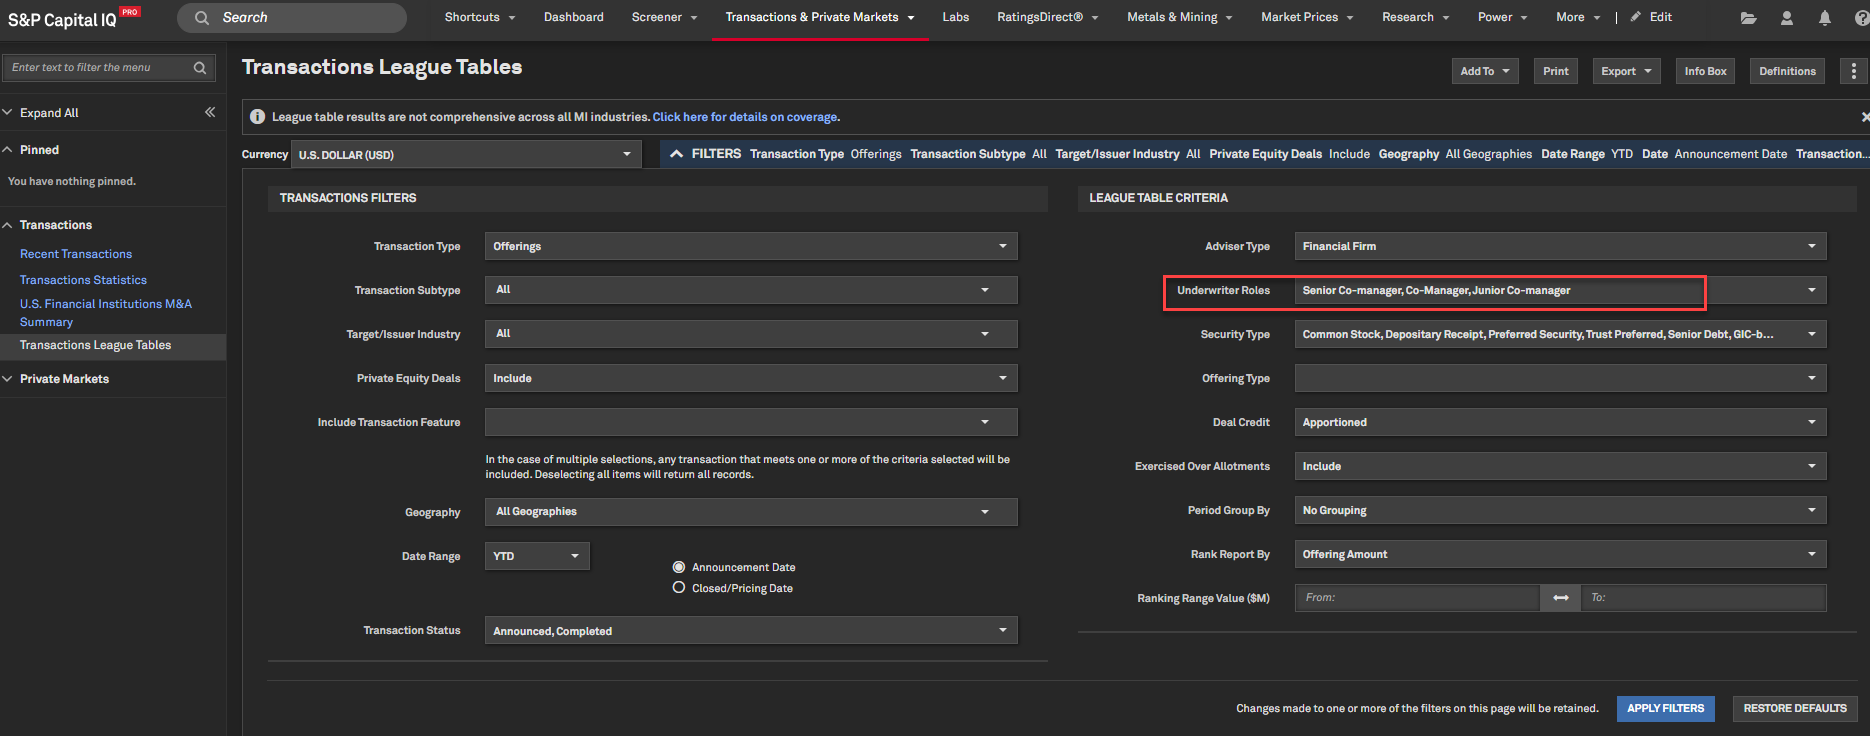
Users can now generate Offerings League Tables using specific Co-Manager role types, namely Senior Co-Manager and Junior Co-Manager. Previously, league table credits for these roles were combined under the general Co-Manager category. With this update, they can now be distinctly categorized into three separate role types.
Find it in the platform:
- Navigate to Transactions & Private Markets dropdown from the top navigation and select Transactions League Tables
- Within filters, select Offerings as the Transaction Type
- Review and Run league tables using specific Co-Manager role types i.e., Senior Co-Manager and Junior Co-Manager
Fundamentals
In this release, we enhanced the financial pages to enable users to highlight and view the data points they are interested in.
Custom Highlights
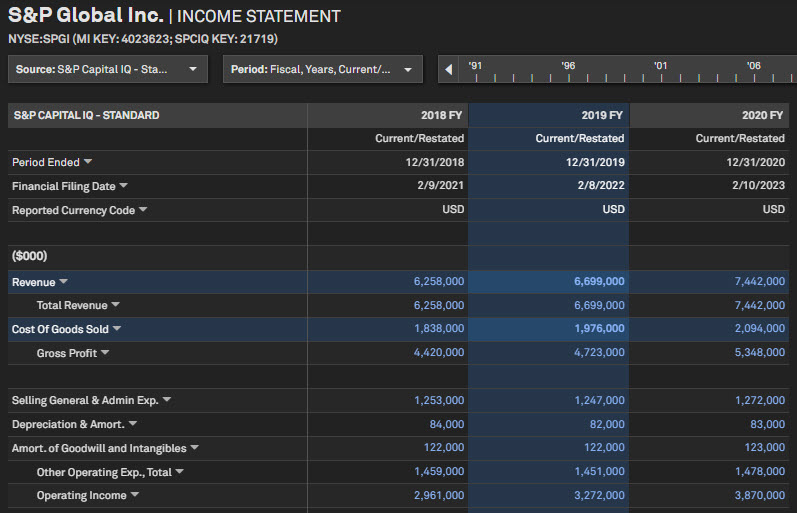
Users can highlight multiple rows and columns on the financial pages, with intersections further distinguished by color and bold text. These highlights can be toggled on and off by the user and will reset upon page refresh. This feature enables users to focus on specific data of interest when the financial page is loaded with a large volume of information.
Find it in the platform:
- Search for and select a company from the top search bar and navigate to the Corporate Profile
- In the left-hand navigation, expand Financials >Templated and select a required page
- Click on any row and column of data to highlight it
- To remove the highlights, click on the highlighted row or column
- Or to remove all selected highlights at once, refresh the page
Estimates
With this release, when a user makes period filter selections on the Estimates pages, these selections will be retained as users navigate between companies. This enhancement improves usability for users comparing estimates and actuals across multiple companies.
Estimates Period Filter Stickiness
When users choose to apply period filter selections on any of the Estimates pages, these selections will be retained when navigating from company to company.
Find it in the platform:
- Search for and select a company from the top search bar and navigate to the Corporate Profile
- Under Estimates in the left-hand navigation, click on Consensus
- In the main filters, set a Period From/To range, e.g., 2020 through 2025
- Search for another company using the top search bar and notice that the period selections are retained, provided contributors cover the same periods for both companies


Ownership
In this release, we added indicators (yellow flags) to the Ownership pages to show when a holder has launched an active campaign against the target company. Additionally, we added a “New Screen” button on the Results tab of the Investor Screening tool to allow users create a new session more easily. Furthermore, we improved timeliness of updates of the UK Share Register data by increasing the frequency of data updates from weekly to daily, and incorporating the reporting frequency change for FTSE 100 and FTSE 250 companies, from quarterly to monthly.
Activism Campaign Flags on Ownership pages
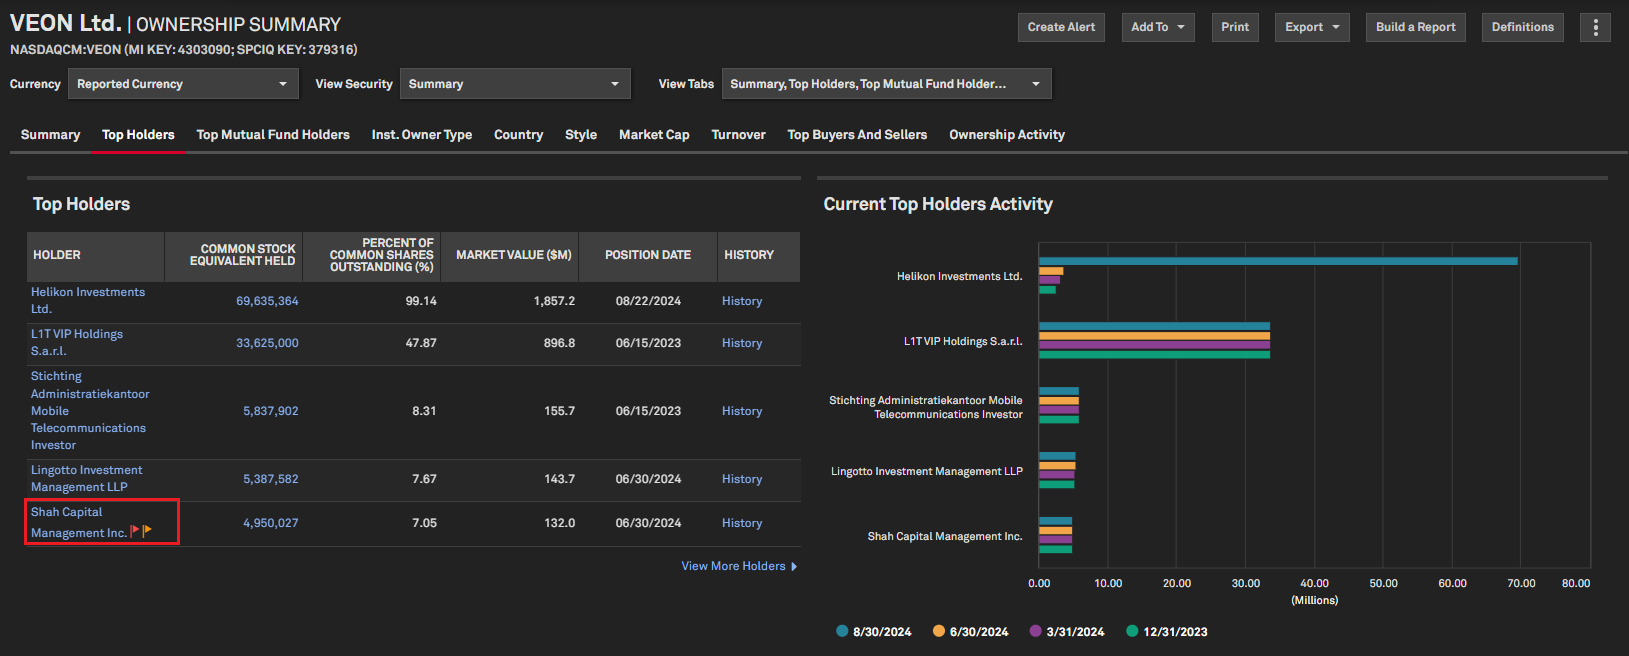
Users can now quickly identify and find direct links to ongoing activism campaigns on Ownership pages, indicated by yellow flags.
Find it in the platform:
- Search for and select a company in the top search bar, e.g. VEON Ltd. (NASDAQCM:VEON)
- Expand Ownership in the left-hand navigation, and select Ownership Summary
- Navigate to either Top Holders, Top Mutual Fund Holders, or Top Buyers and Sellers tabs
- In the data grids, any holder with an ongoing campaign against the focus company will have a yellow flag icon beside its name
- Click on the yellow flag to navigate to the Campaign Profile
- The yellow flag is also available in the data grids on the Ownership Detailed, Ownership History and Ownership Crossholdings pages
'New Screen' feature in Investor Screening
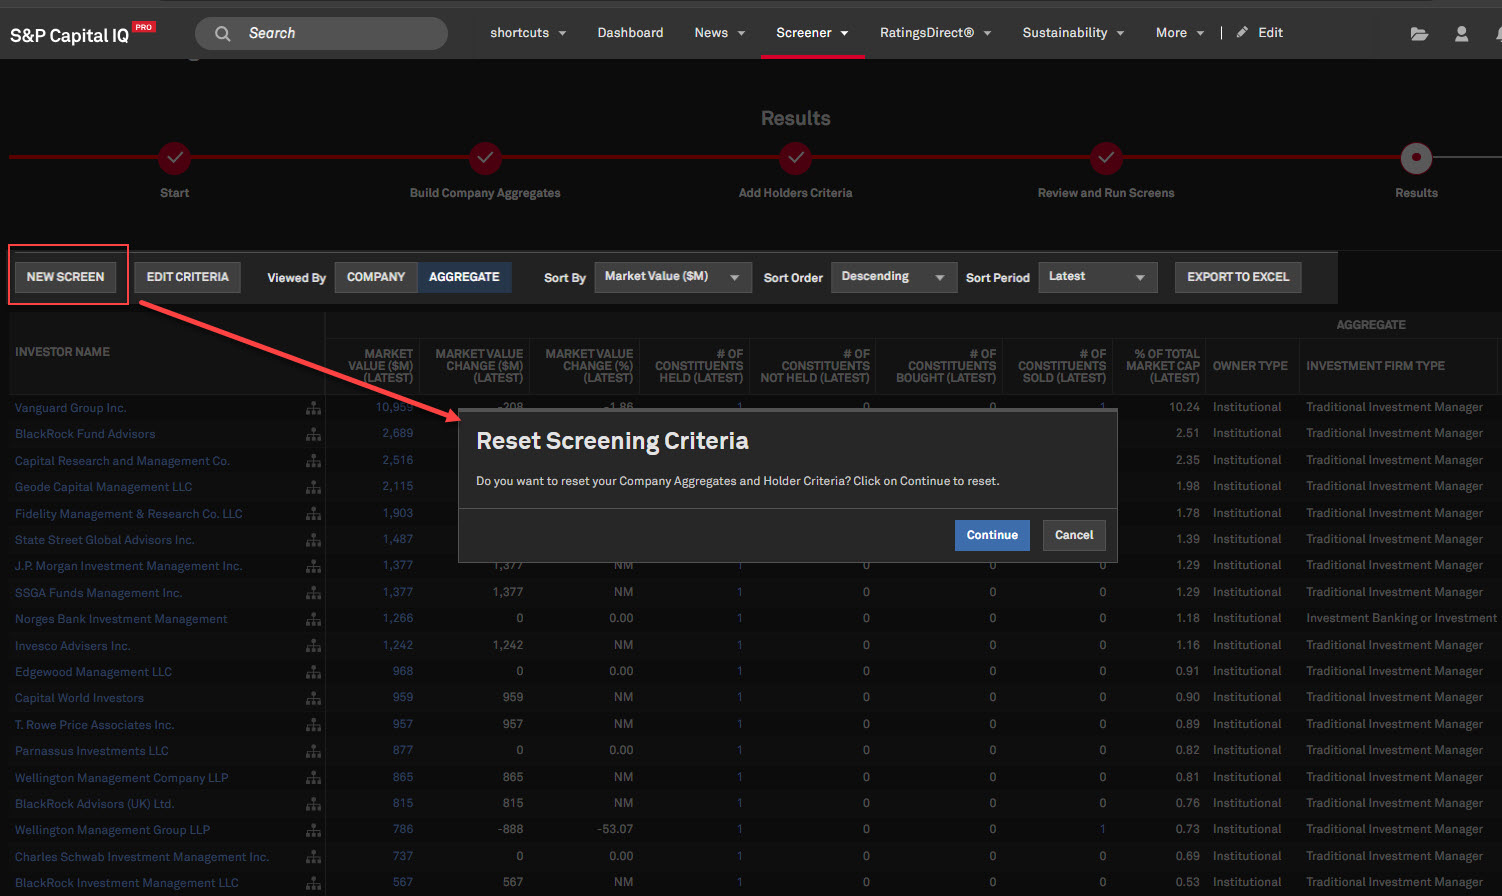
Users can now utilize a ‘New Screen’ feature in the Investor Screening tool to quickly reset the screen, clear company aggregates and restore the holders' criteria to default settings.
Find it in the platform:
- Navigate to Screener from the top navigation bar or the Apps menu
- Select Investor Data > Investor Screening
- Follow the steps on the tool to generate results
- On the Results step, click on the New Screen option located above the data grid
Enhanced UK Share Register Data Frequency
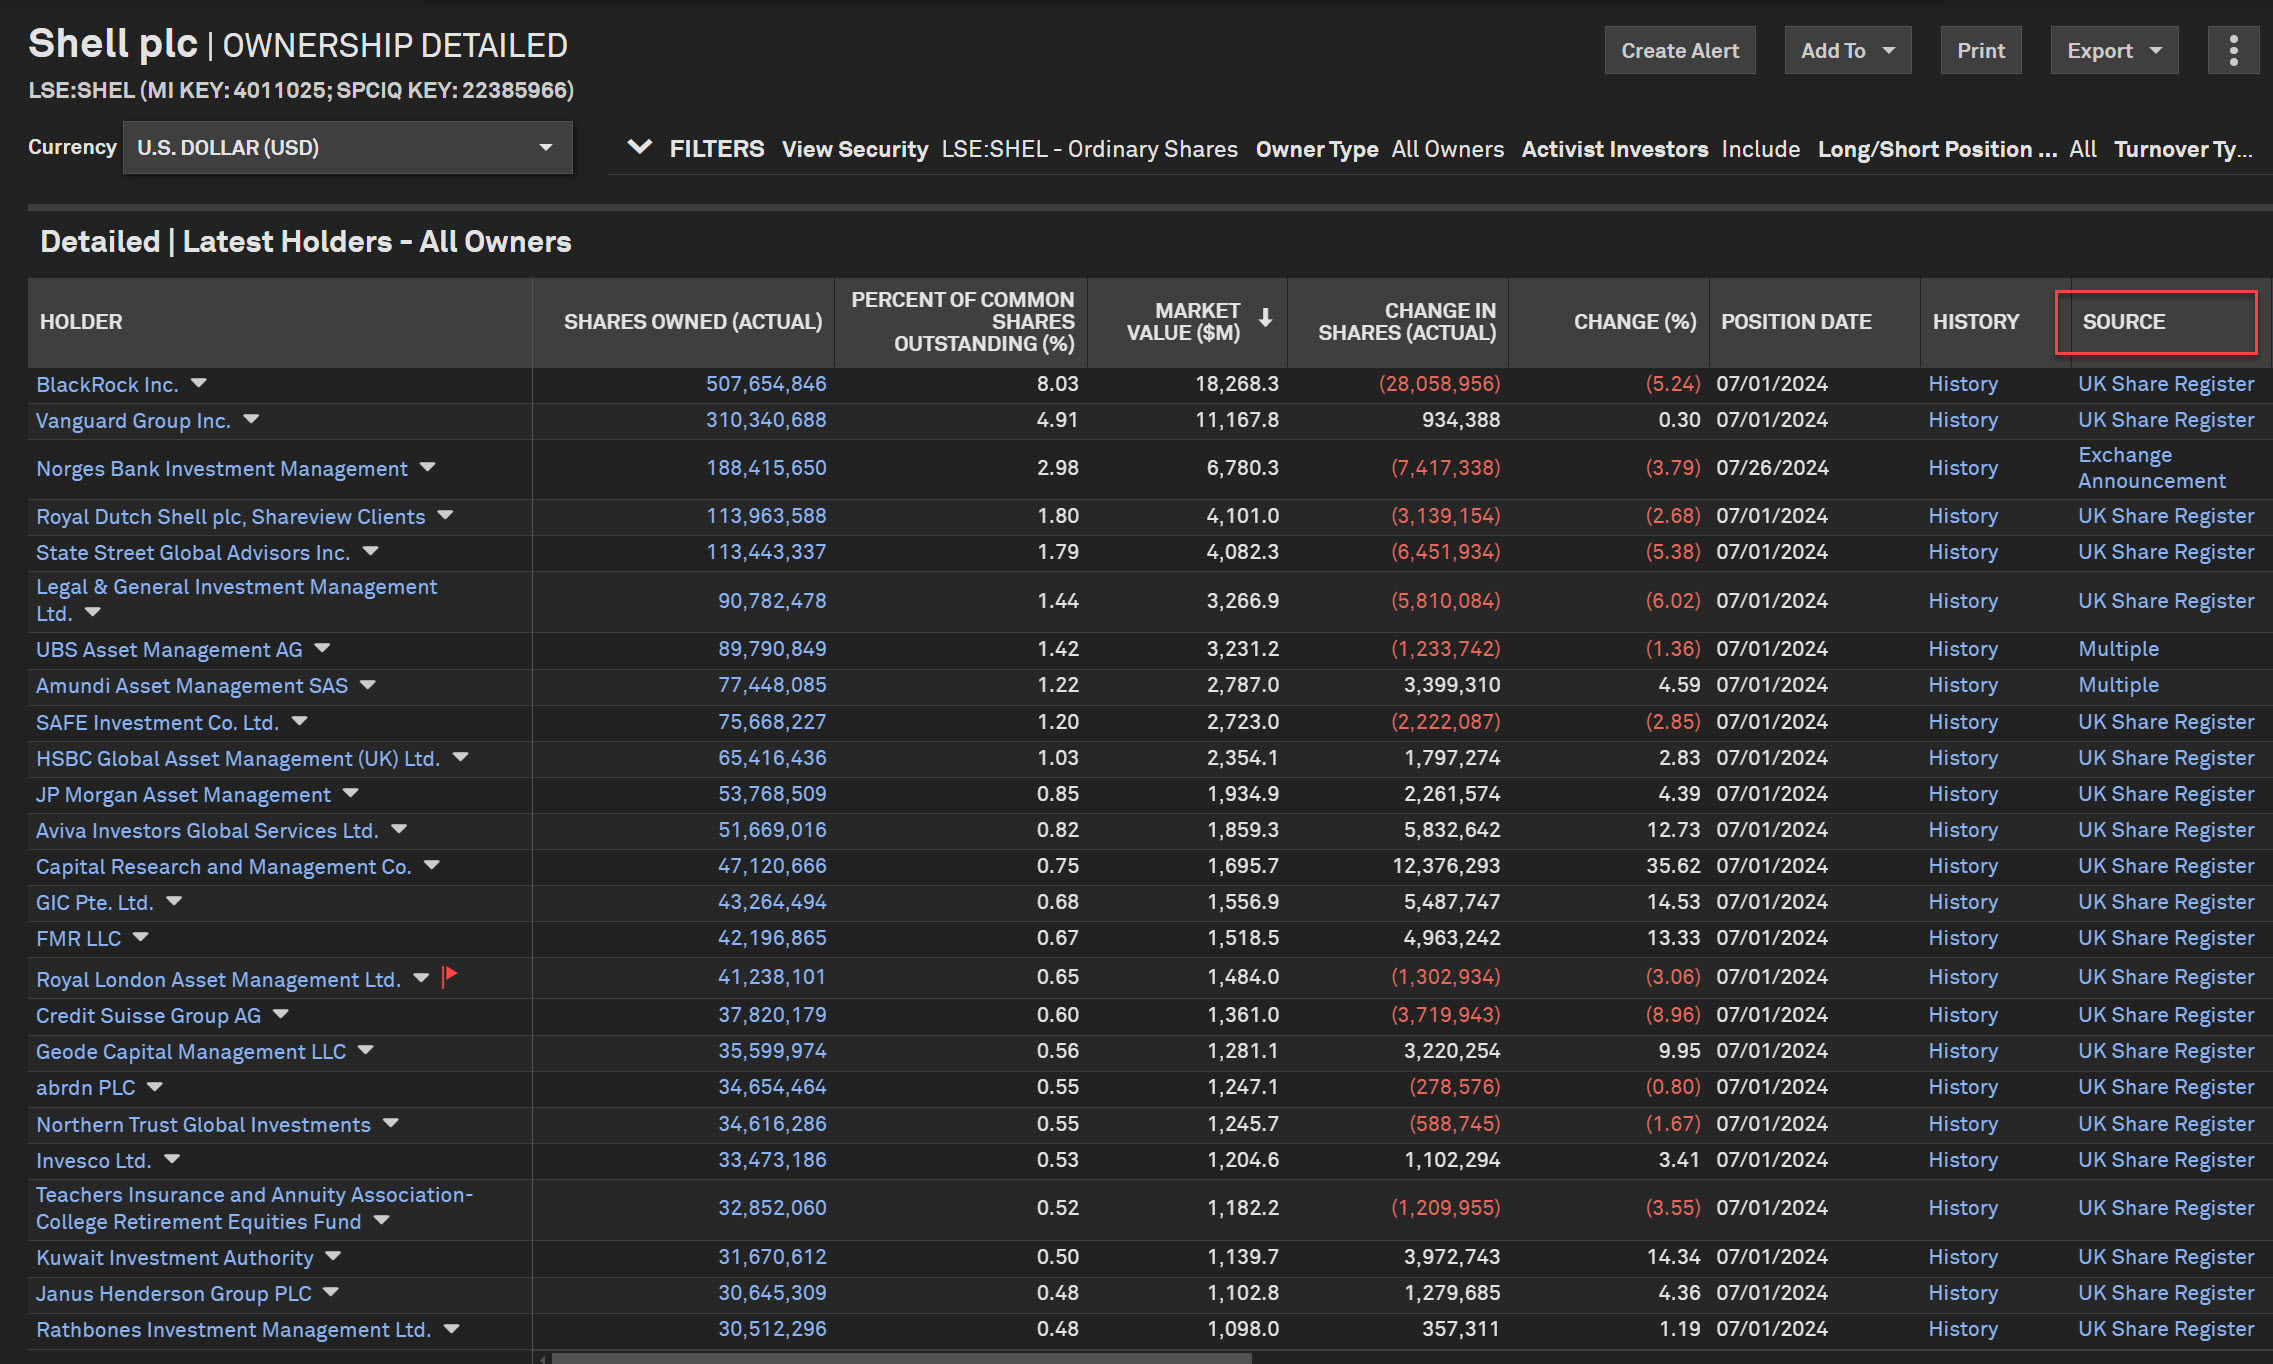
Users will now receive daily updates to Ownership data sourced from the UK Share Register, a significant improvement from the previous weekly updates. In addition, FTSE 100 and FTSE 250 companies will be refreshed with updates from quarterly to monthly, while the AIM profiles will be updated on a quarterly basis.
Find it in the platform:
- Search for and select a company based in the United Kingdom, e.g., Shell plc. (LSE: SHEL)
- Expand Ownership in the left-hand navigation and select Ownership Detailed
- The enhanced data frequency applies to holders where the Source column is UK Share Register
Mapping
In this release, we added more country-level demographic and macroeconomic data within the Maps application.
Improved Demographics & Macroeconomic data
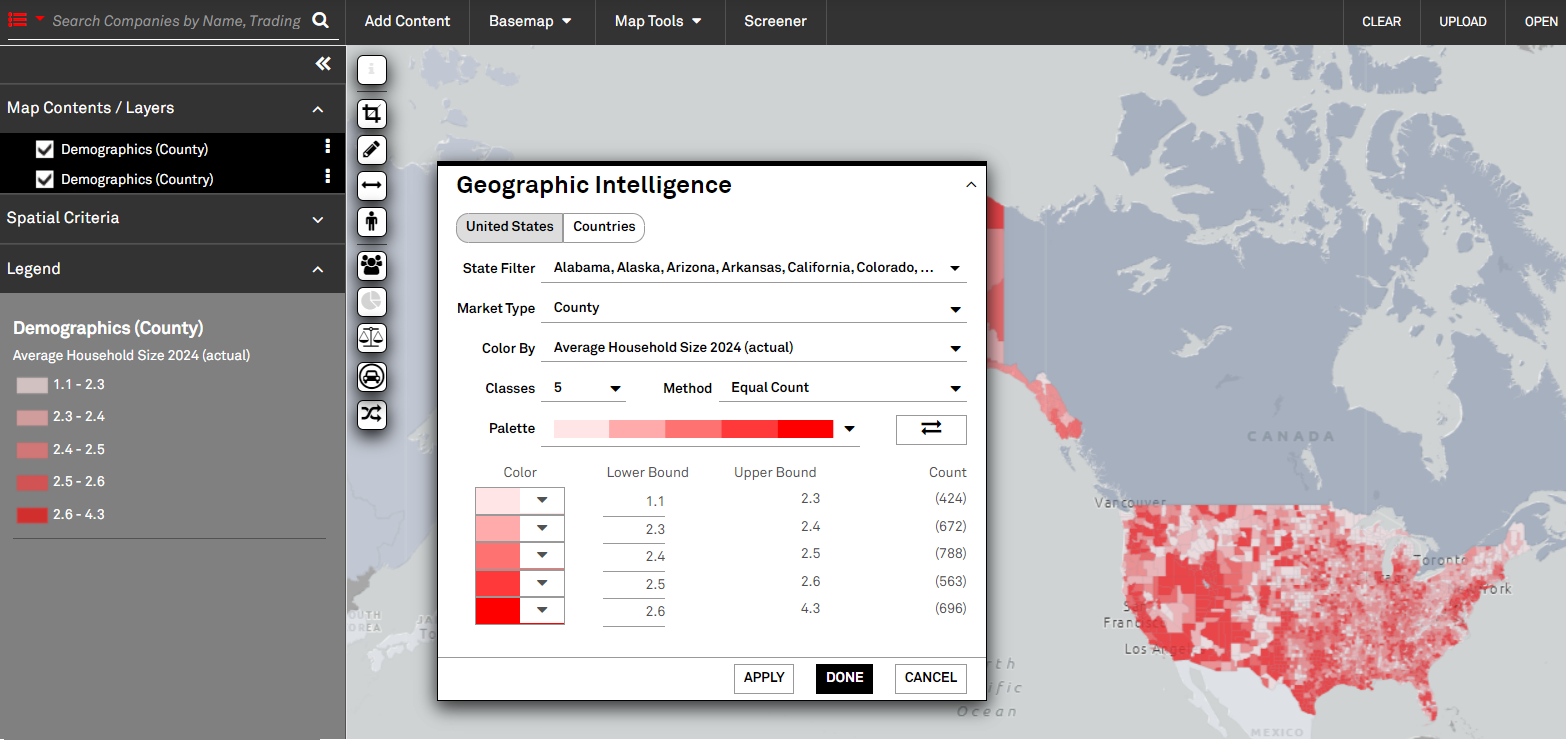
Users can now use the Market Intelligence tool in Maps to add U.S. demographic data, financial product demand, depository rates, CRE aggregates, and more. Users can also add macroeconomic data, global banking aggregates, sovereign ratings, and more at the country level.
Find it in the platform:
- Navigate to the Apps menu from the top navigation and select Maps
- On the left sidebar of the map, click the Market Intelligence icon, represented by three people
- Click the color by dropdown and choose More Metrics
Investor Activism
In this release, we introduced grouping functionality and the ‘Add Companies’ feature to the Investor Activism data set on Screener. Additionally, we added the ability to generate a list of Activist Campaigns in the S&P Capital IQ Pro Plug-in.
Investor Activism Screener Enhancements
Users can now screen for activist campaigns using the ‘Add Companies' option. They can also group results by several company and campaign attributes with the ‘Group By’ function on the Screener Investor Activism data set.
Find it in the platform:
- Navigate to Screener from the top navigation bar or the Apps menu
- Under Investor Data, select Investor Activism
- Click Add Companies to screen for campaigns based on Target, Activist, Adviser, or Any Role
- For the Group By function, enter any criteria and hit Run Screen
- Click Options and select a metric from the Group By dropdown list
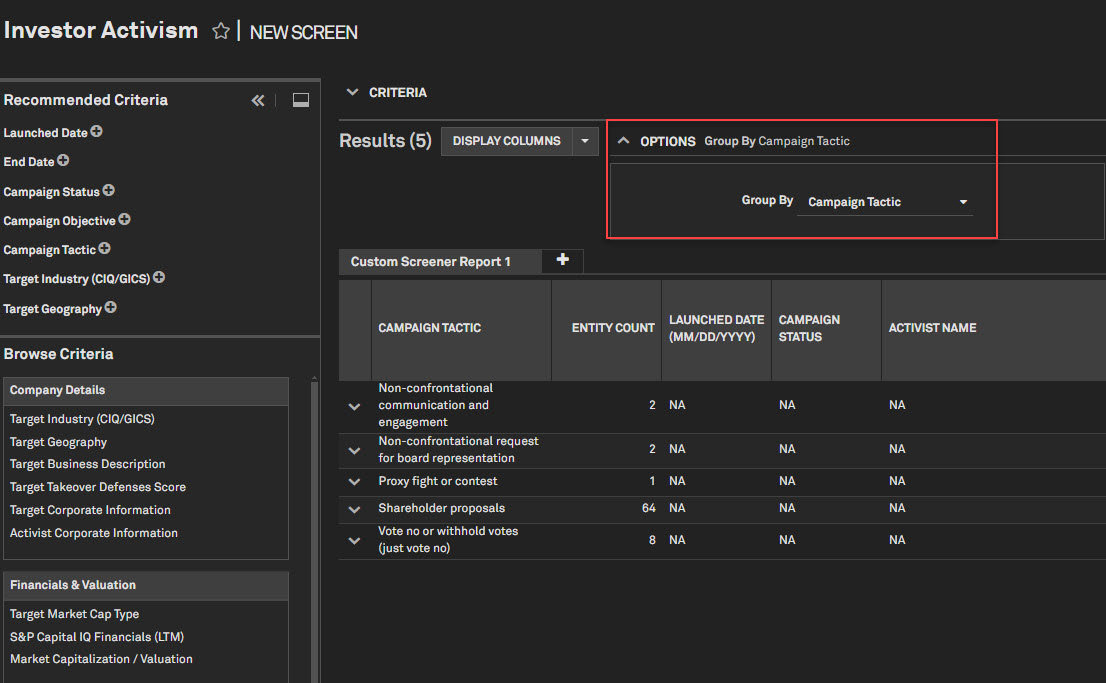
Activist Campaigns List
Users can now generate an activist campaigns list using S&P Capital IQ Pro Plug-in.
Find it in the platform:
- Launch the S&P Capital IQ Pro Plug-in and open the Formula Builder
- In the top menu, select Key Workflows > Companies
- Select Company Details > Lists > Investor Activism > Investor Activism Campaigns
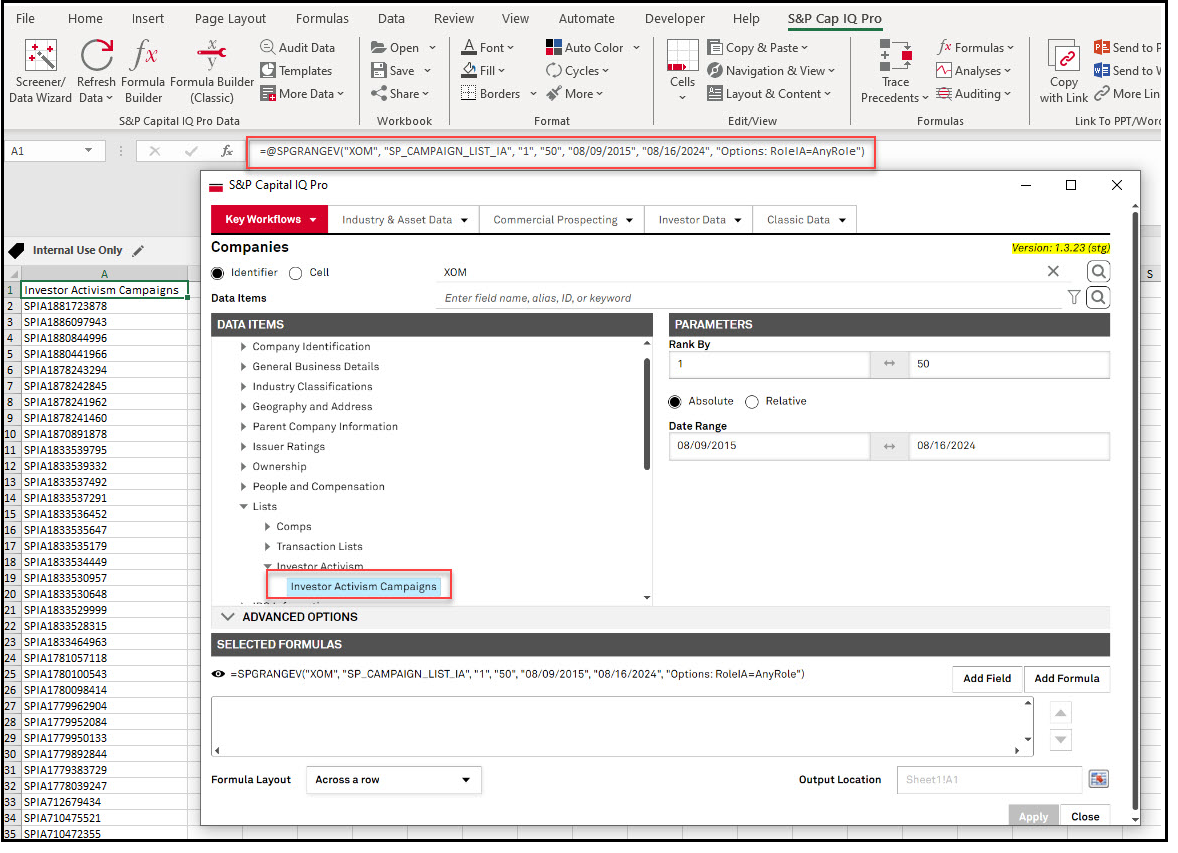
S&P Capital IQ Pro Plug-in
In this release, we added right-click functionality to the S&P Capital IQ Pro Plug-in, enabling clients to quickly and efficiently access frequently used features. We also added Dividend Adjusted Price Close and Class Level Shares Outstanding & Market Cap metrics.
Right-Click Support in S&P Capital IQ Pro Plug-in
Users can now use right-click functionality within the S&P Capital IQ Pro Plug-in which enables them to access the functionality easily.
Right-clicking on a cell with the SPG function will display the following options:
- Audit Data
- Refresh Cells
- Insert Formulas
- Unlink Formulas
Right-clicking on a blank cell will display the following options:
- Insert CIQ Pro Identifiers
- Launch Screener/Data Wizard
- Create Custom Formulas
- Insert Period Constants
- Unlink Formulas
- Access Web platform from Excel
Find it in the platform:
- Launch S&P Capital IQ Pro plug-in
- In Excel, right-click on a cell either with a =SPG Formula or a blank cell to see the option
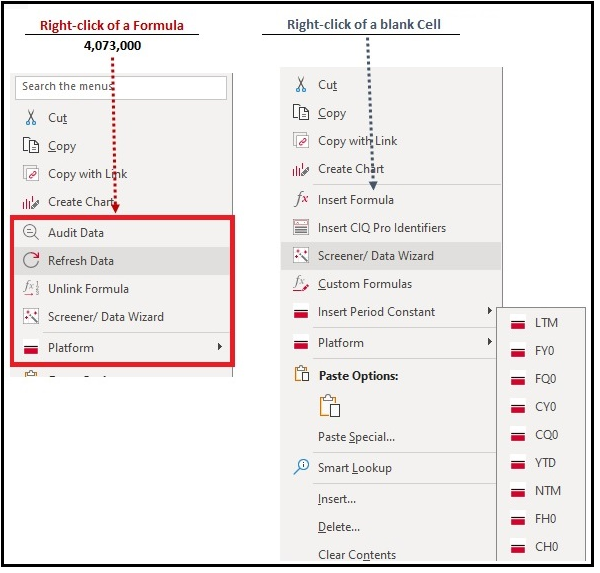
Dividend Adjusted Price Close & Class Level Metrics
Users can now pull Dividend Adjusted Price Close as well as Class Level Shares Outstanding & Market Cap in S&P Capital IQ Pro Plug-in for specific as-of dates. Dividend Adjusted Price Close metric addition will allow users to calculate total return manually for any specific time frame.
Find it in the platform:
- Launch S&P Capital IQ Pro Plug-in and open Formula Builder
- Navigate to Companies > Data Items, expand Market Data > Equity Market Data
- Dividend Adjusted Price Close metric is available under Pricing Information folder
- Class Level Market Capitalization & Shares Outstanding are available under Market Cap., TEV and Shares folder
- Diluted Outstanding & Exercisable Class-level metrics are available under the specific Diluted folders
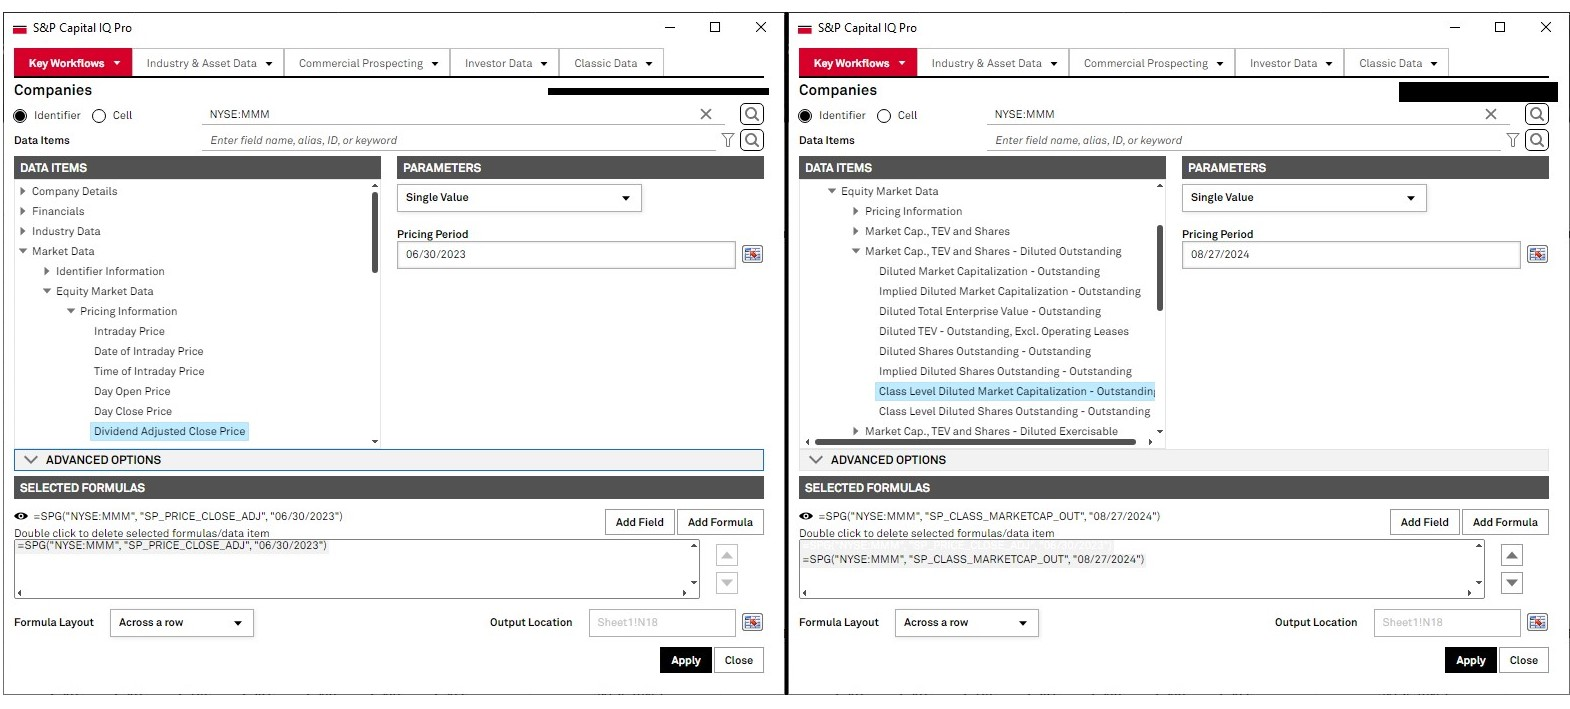
S&P Capital IQ Pro Labs
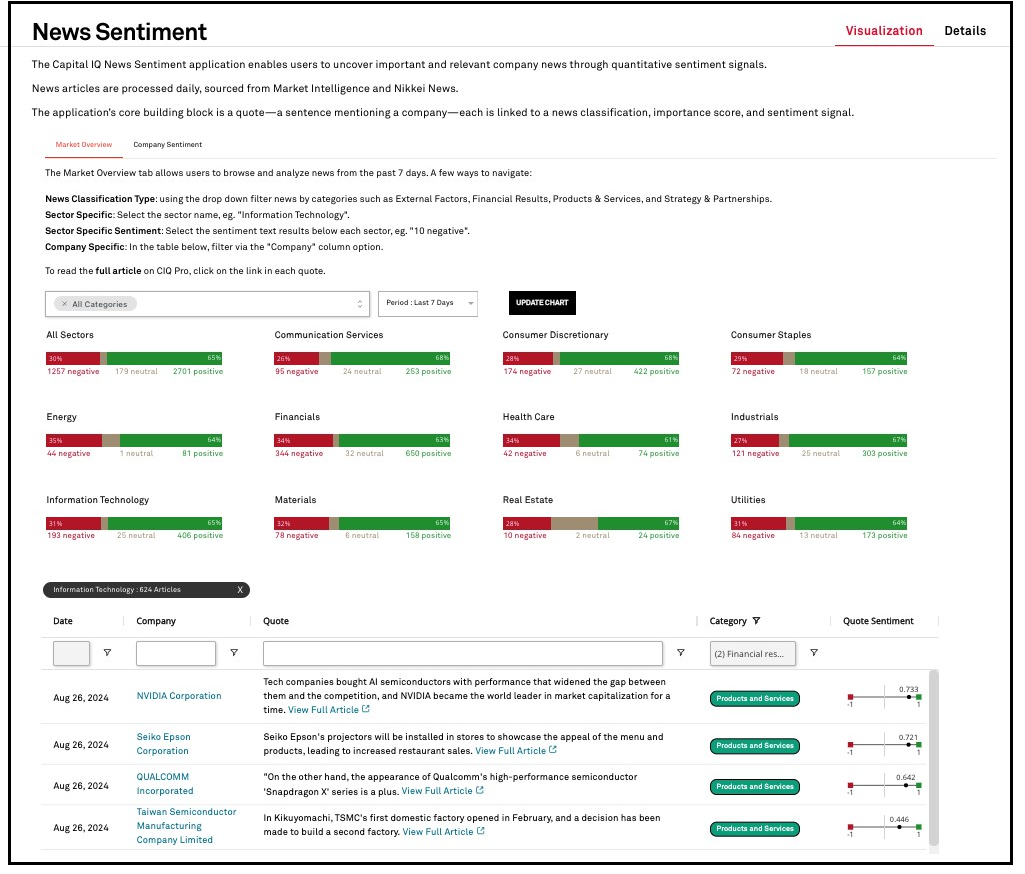
In this release, users can access a new S&P Capital IQ Application, News Sentiment, to analyze companies in the spotlight and discover positive and negative news articles that are driving market sentiment.
News Sentiment
Users can utilize News Sentiment to stay informed on the most relevant and impactful news within the Market Intelligence and Nikkei News universe. Analyze companies in the spotlight and discover the news articles, both positive and negative, that influence market sentiment across various sectors and news types. The application enables visualization of overall net positivity on a company level across time and is also broken out for each news classification, such as Financial Results, External Factors, Products & Services and Strategy & Partnerships.
Find it in the platform:
- Navigate to the Labs from the top navigation
- If you do not see Labs in your top navigation, add it to your list of current menu items by selecting Edit on the top menu. Select Labs, drop it into Current Menu Items and select Save
- Select the tile News Sentiment to access the application
September 2024 CIQ Release Notes
September 2024 Capital IQ Release Notes
Read September 2024 Capital IQ Pro Release NotesIn this release, we enhanced Portfolio Analytics Batch Scheduler, improved custom grouping, and enabled security value reviews across all reporting subperiods. We launched Bond Implied Scoring model in Credit Analytics and introduced key updates to the Project Finance Scorecard. Additionally, we improved ProSpread, with significant user experience and added flexibility for financial data spreading.
August 2024 CIQ Pro Release Notes
August 2024 Capital IQ Pro Release Notes
Read August 2024 Capital IQ Pro Release Notes
In this release, we added new datasets and tools on Capital IQ Pro designed to enhance your daily workflows:
- We improved our Search capabilities to make it easier to discover relevant information on the platform, including company logos, company information cards, recommended news articles, and improved relevancy.
- We enhanced our Corporates and Sovereign Bonds page with improved visualizations for Governments, Agencies, and Sovereigns.
- We simplified the subscription process for our new IQ Newsletters, so you can quickly sign up for our daily recap emails covering the U.S., EMEA, and APAC regions.
- We redesigned the Help menu to make it easier to find helpful information on the latest enhancements, training webinars, videos, and Help articles.
- We introduced Transcripts Trending Topics and Topical Key Phrases applications within S&P Capital IQ Pro Labs, the home for innovation and research & development within Capital IQ Pro, that enable the discovery of trending and relevant topics across the S&P 500 earnings call transcripts universe.
Marketplace Data & Solutions Communiqué
The Marketplace Data & Solutions Communiqué reflects developments in the S&P Global Marketplace, your discovery tool for differentiated data and robust solutions with an integrated support site.Marketplace Data & Solutions Communiqué
Data: Leverage premium fundamental and alternative datasets available seamlessly, along with expert analysis, to accelerate your journey from data to insight.
Solutions: Gain maximum value from your big data with technology solutions designed to enhance your workflow, increase your insights, and complement your datasets. Our solutions, including Snowflake, Kensho NERD, Xpressfeed, Xpressfeed Loader, and API Solutions, help you make the most of all your data.
If you wish to subscribe, sign up on the Communiqué Marketplace site.


