In this release, users will experience a new top menu on the S&P Capital IQ Pro platform that can be customized for a personalized navigation experience, ensuring that the most vital information for your workflow is easily accessible. We enhanced the layout of top menu icons focusing on Saved Items, User profiles, Alerts, and Help. Additionally, we revamped the organization of links and options within these menus to optimize overall user experience.
Users can now select the content and capabilities in the top menu to personalize their navigation experience in the S&P Capital IQ Pro platform. This will enable quick and easy access to relevant and tailored content that aligns to their workflow. While the default navigation aligns with a user’s industry focus, the top menu display can be modified to accommodate individual preferences.
Find it in the platform:

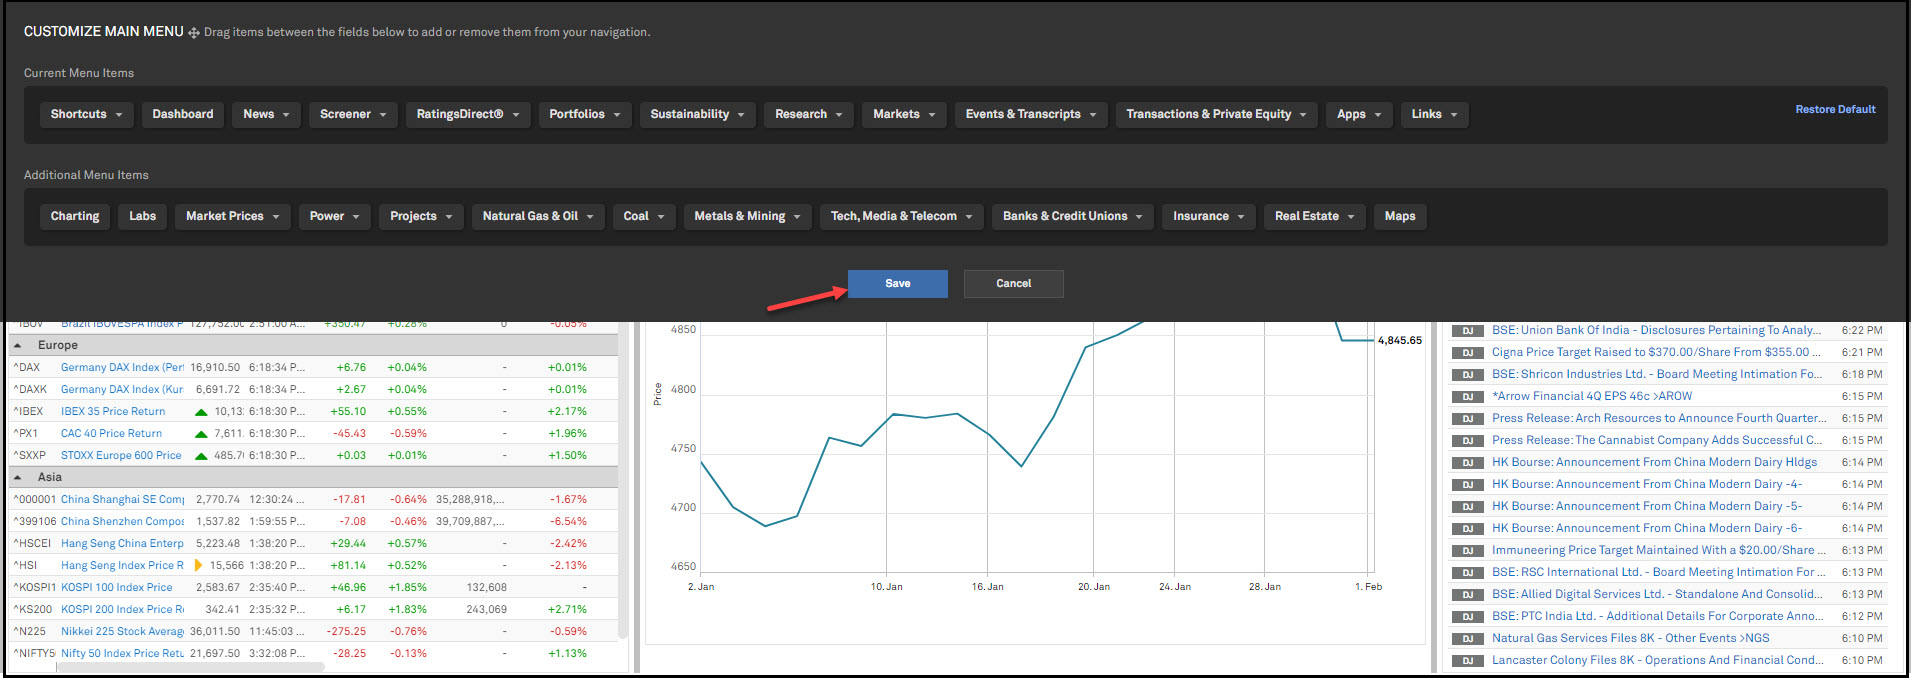
We have updated menu icons for Saved Items, User Profiles, Alerts, and Help located in the top right corner of the Capital IQ Pro platform.
Find it in the platform:
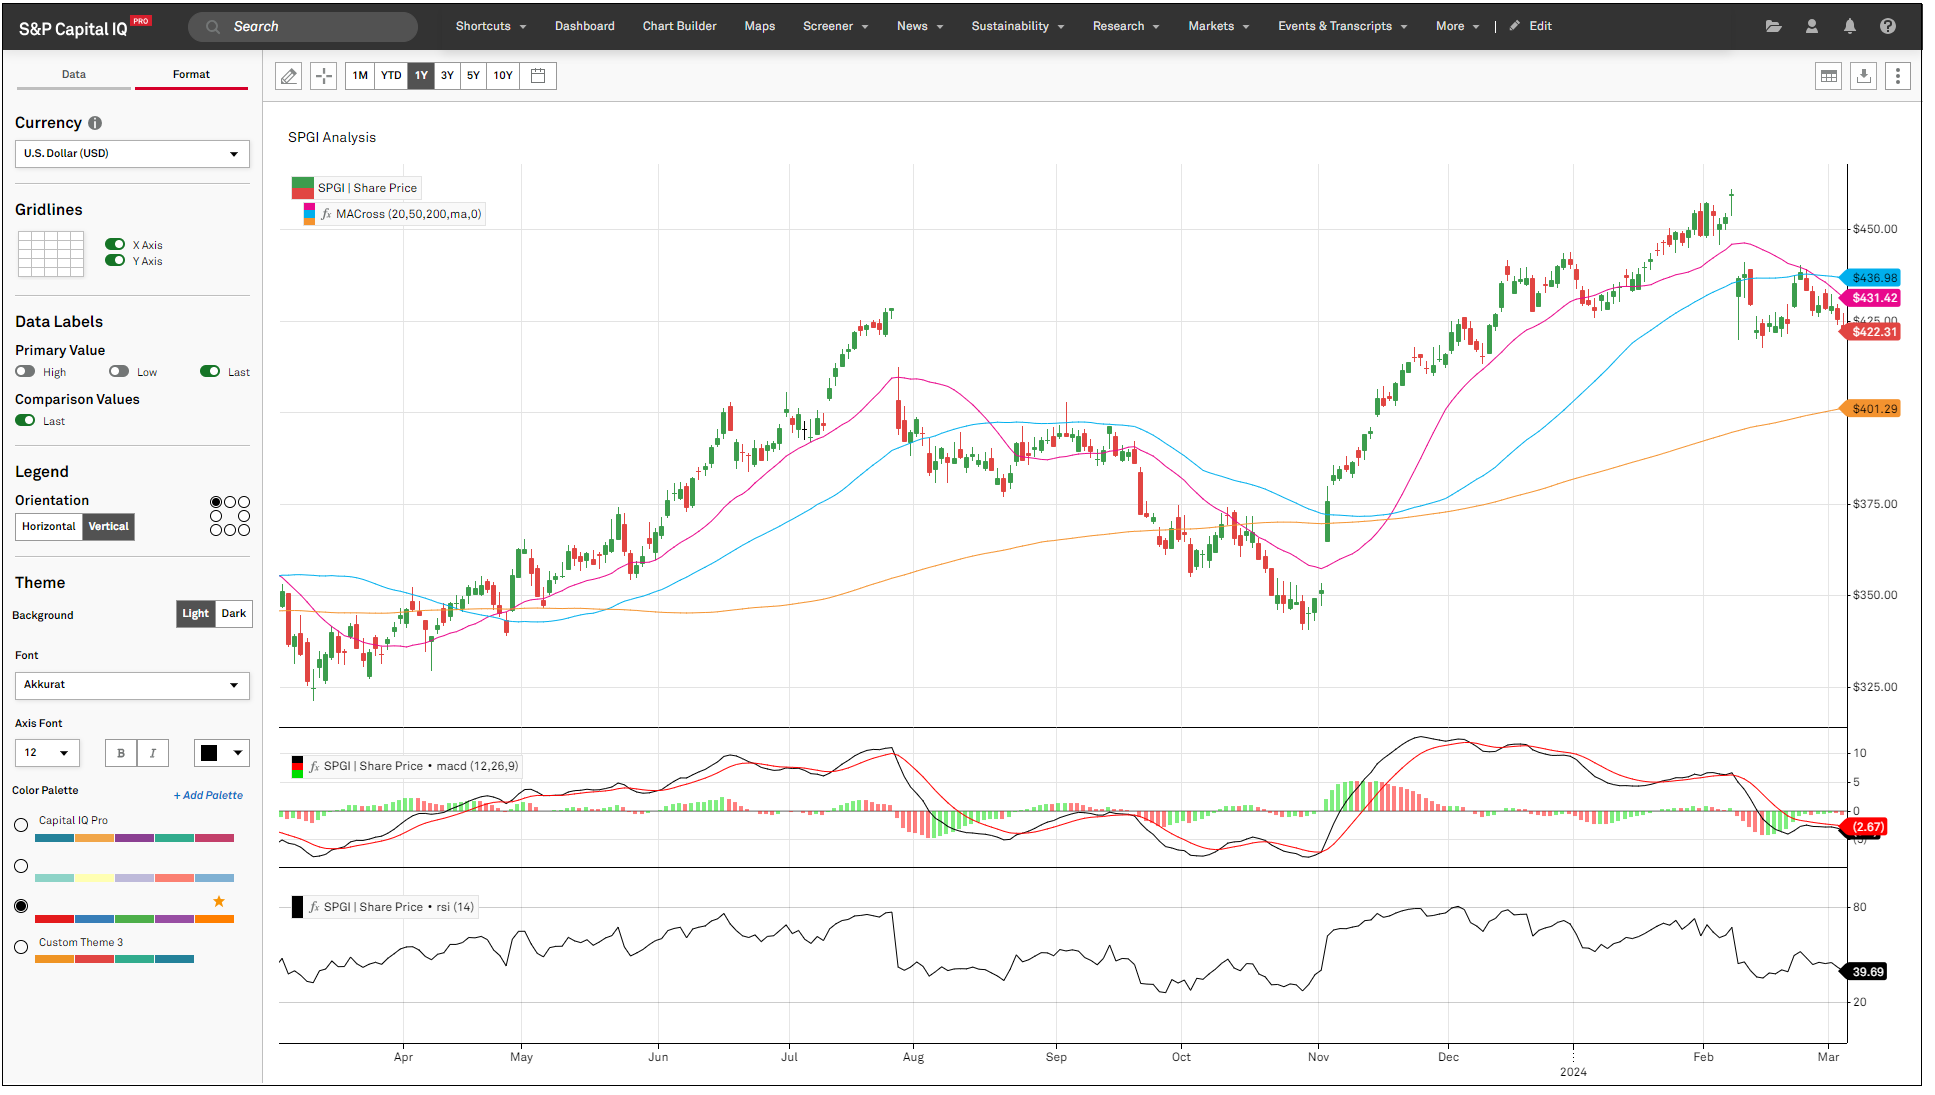
In this release, we invite you to use a new and reimagined Chart Builder with improved presentation creation, analytical capability, and application performance.
With the introduction of Chart Builder (Beta), users can get started quickly, using chart templates functionality and edit a chart easily using technical indicators, series styling customization, and drawing tools. Users can also create custom aggregates within the application to chart a weighted index of companies on a single series.
Find it in the platform:
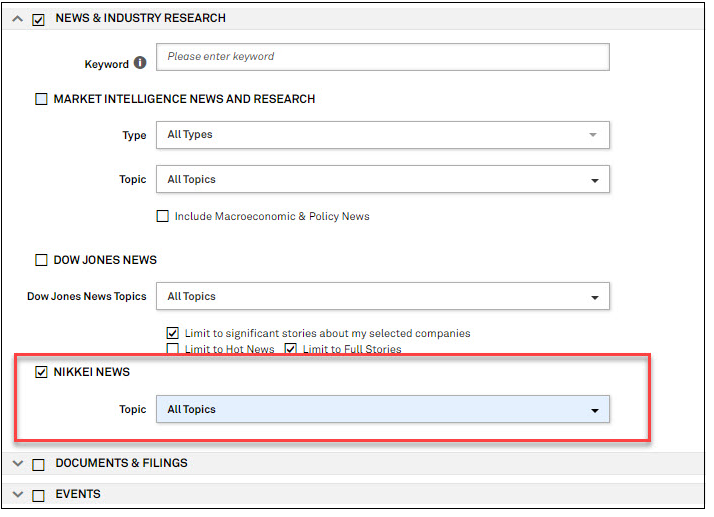
With this release, users can set alerts for Nikkei News, a comprehensive source for business activity coverage of Asia-Pacific and global financial markets.
Users can set up alerts for Nikkei News, Japan’s largest business news source, which provides news and analysis on regional and global business trends.
Find it in the platform:
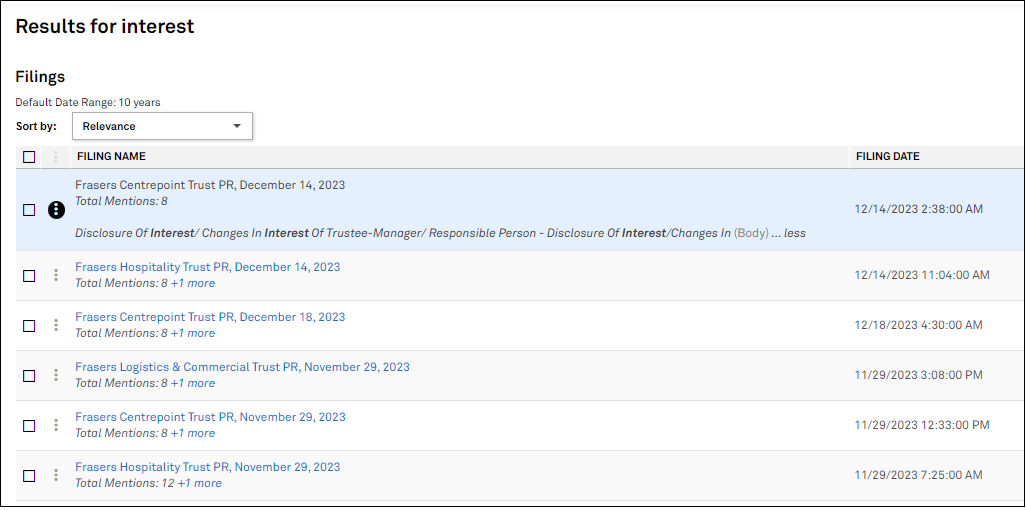
In this release, we added a new metric, the total number of keyword mentions within the Filings filter, on the search results page. This provides the ability to view the number of keyword matches within a selected group of Filings to help users determine which document is of higher relevance for their research. Additional enhancements to search include pricing data availability in the search bar dropdown, improved relevancy, ability to search across data fields, along with topic tags search in company screener queries, and local language search in Chinese (PRC), Japanese and Korean languages.
Users can see the total number of keyword matches for Filings in search results page to help them determine if a document is relevant to their research.
Find it in the platform:
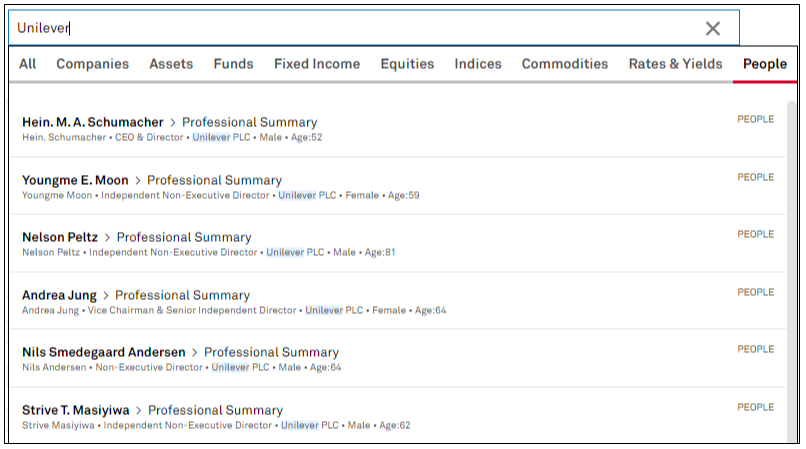
We improved relevancy on our top search for fixed income, equities and people datasets. The new search considers usage statistics, company size measured by market capitalization, and prioritizes Stock Exchange listings for relevancy.
Find it in the platform:
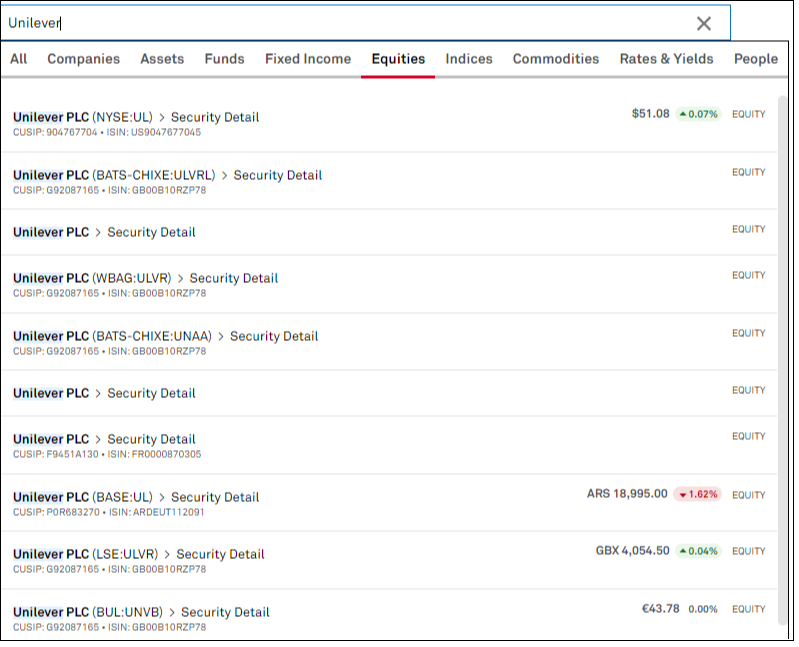
Users can find pricing data directly in the top search including last price and % price change for all publicly traded companies, equities, and funds.
Find it in the platform:
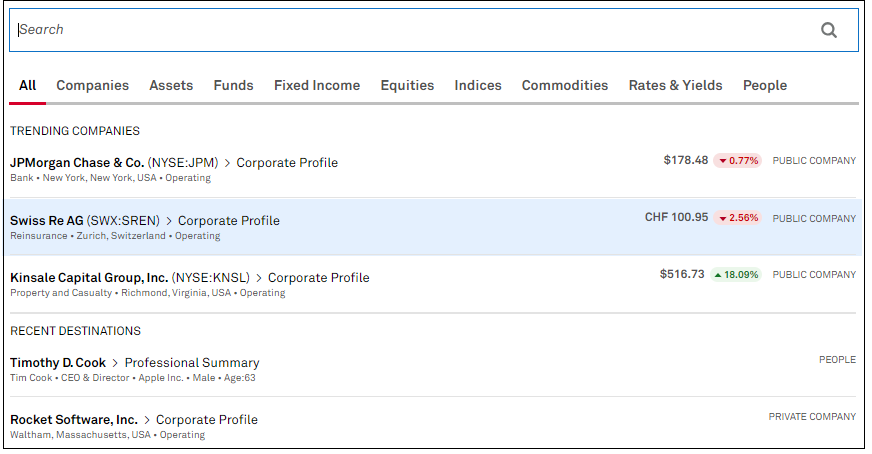
Users can discover search results that are relevant across multiple fields to improve discoverability. For example, Search for an officer, director or person’s name + company or a company + person’s role.
Find it in the platform:

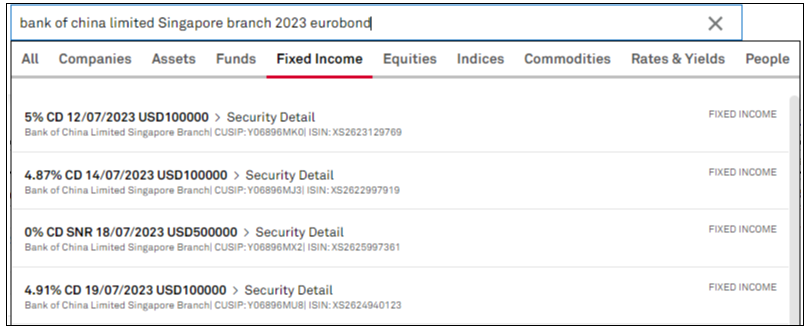
Users can search for companies in Chinese (PRC), Japanese, and Korean languages in the new search experience.
Find it in the platform:

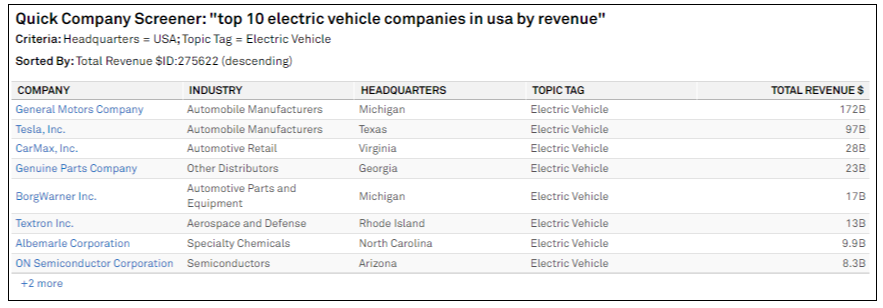
Users can search for companies and their fundamental data with the addition of Topic Tags as criteria for their quick company screening search.
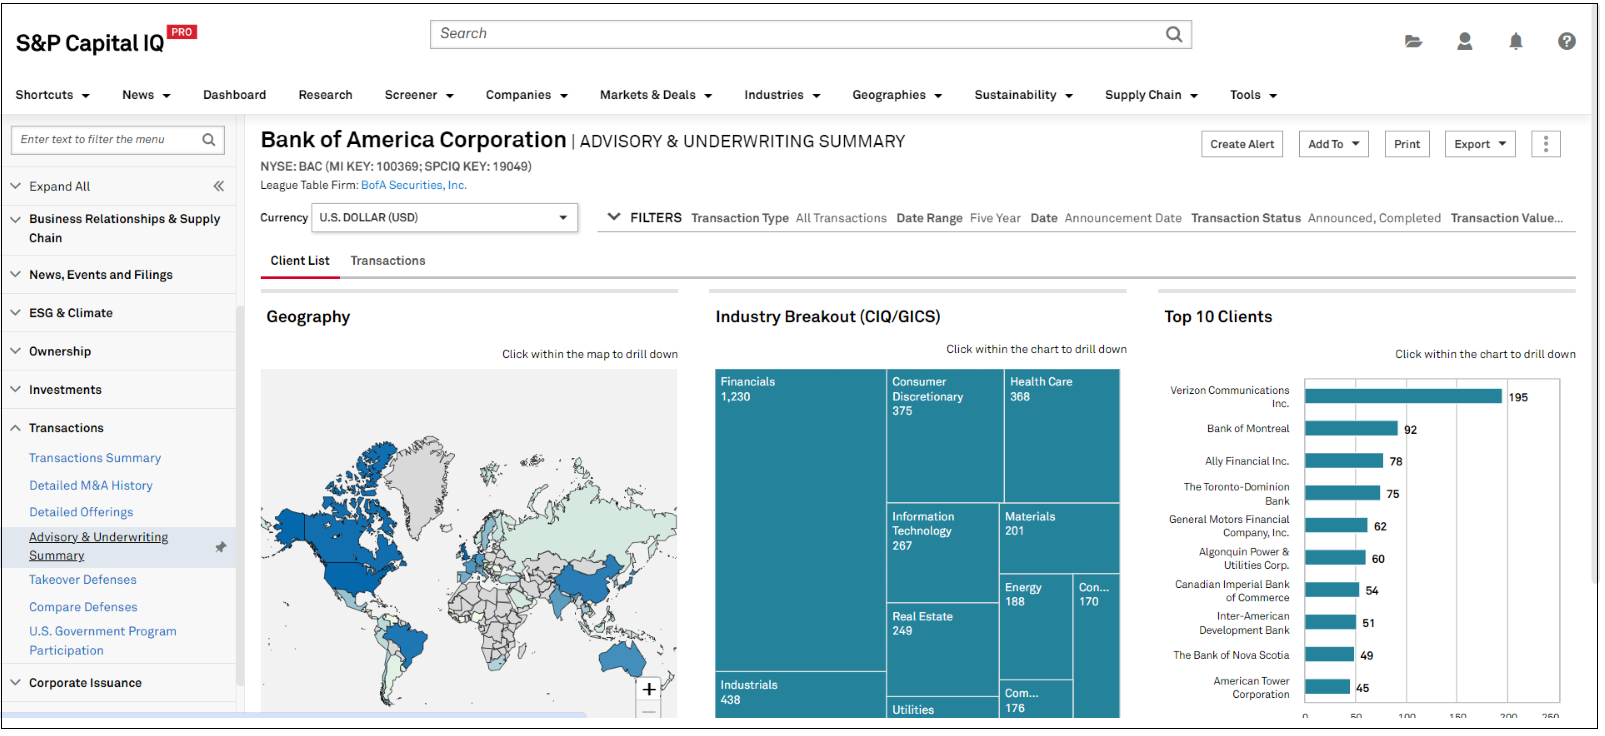
In this release, we added a new Advisory & Underwriting Summary page for users to see the clients of financial and legal advisers in M&A and capital raising deals. Additionally, we added new options to group transactions screener results based on CIQ/GICS Industry, Geography, and Sector (MI).
The new summary page will enable users to see the top clients of financial institutions and law firms in M&A and capital raising deals. Users can drill into geographic and industry breakdowns as well as the advised transactions of the financial and legal advisers. Additionally, users can filter the data by buy-side or sell-side advisory, industry, geography, client size, transaction value, etc. and click-through from charts to raw data.
Find it in the platform:
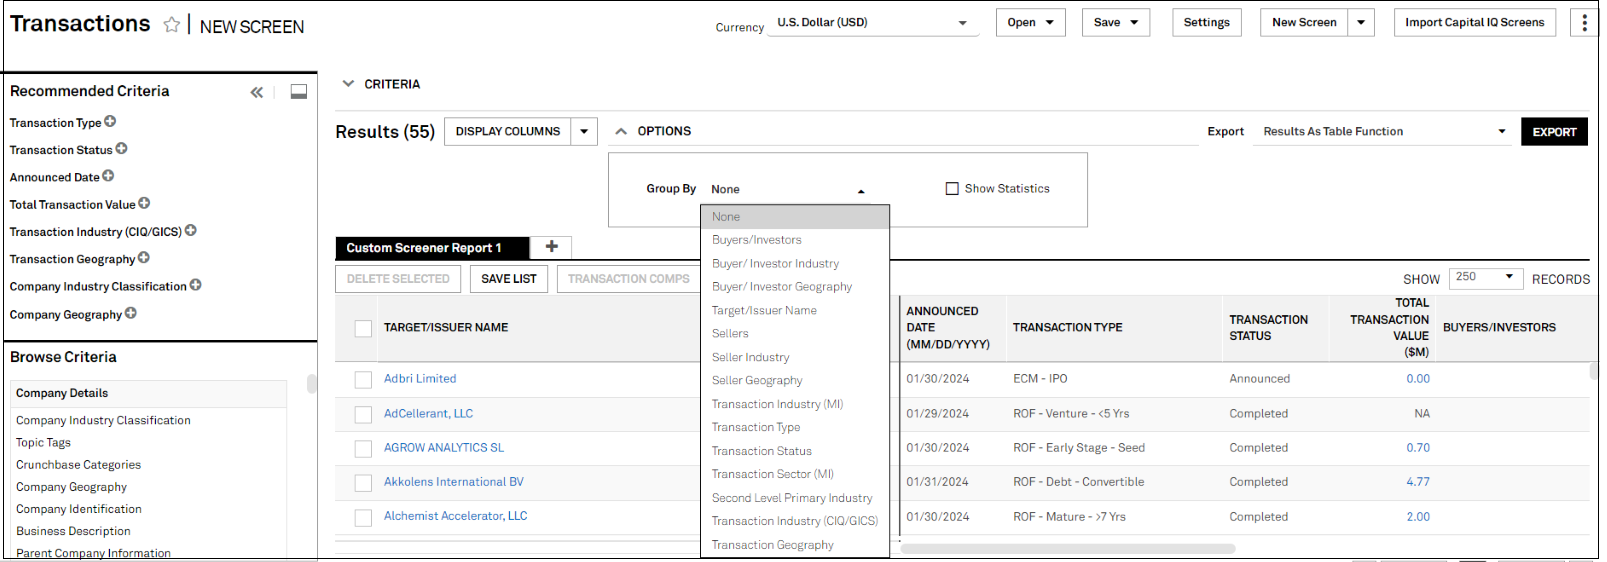
Users can group transactions from their screening results using industry and various geographical metrics.
Find it in the platform:
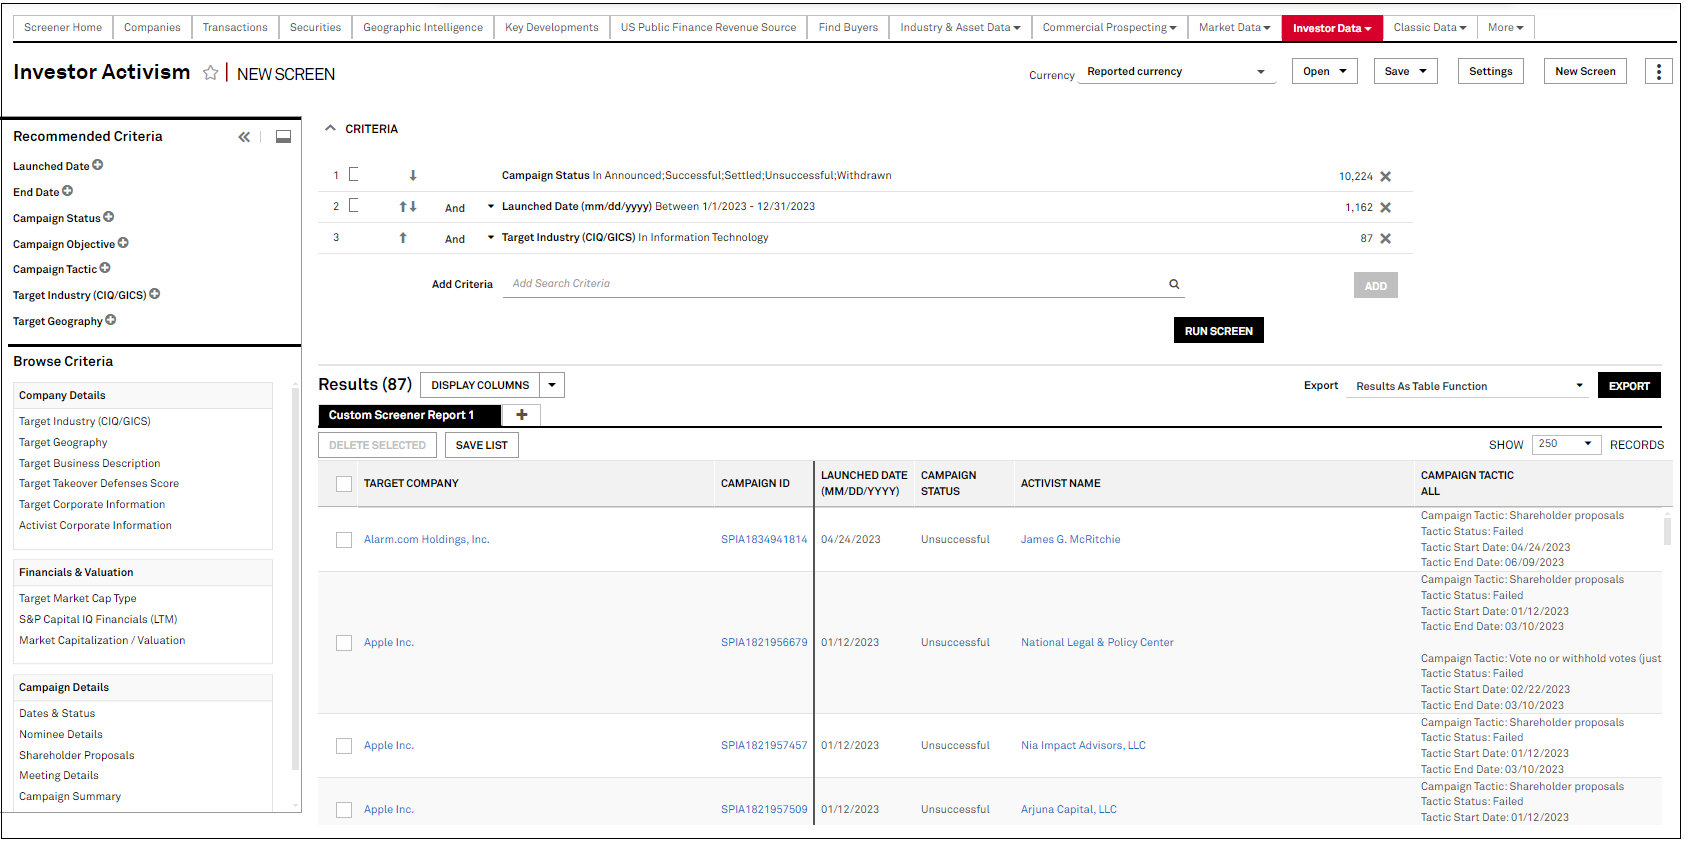
In this release, we added Investor Activism data in Screener and introduced a new market-level Activist Investor Ownership page on the S&P Capital IQ Pro platform.
Users can now screen across activist campaigns using key data points like campaign status, target industry, geography, tactics deployed by activists, objectives of the campaign, nominees and shareholder proposals.
Find it in the platform:
Users can quickly view and analyze companies that may be susceptible to an activist campaign using Early Warning/Potential Targets, New Positions, and Increased Positions by activist investors. The click-to-filter capability enables users to filter the results on the page by clicking the charts.
Find it in the platform:
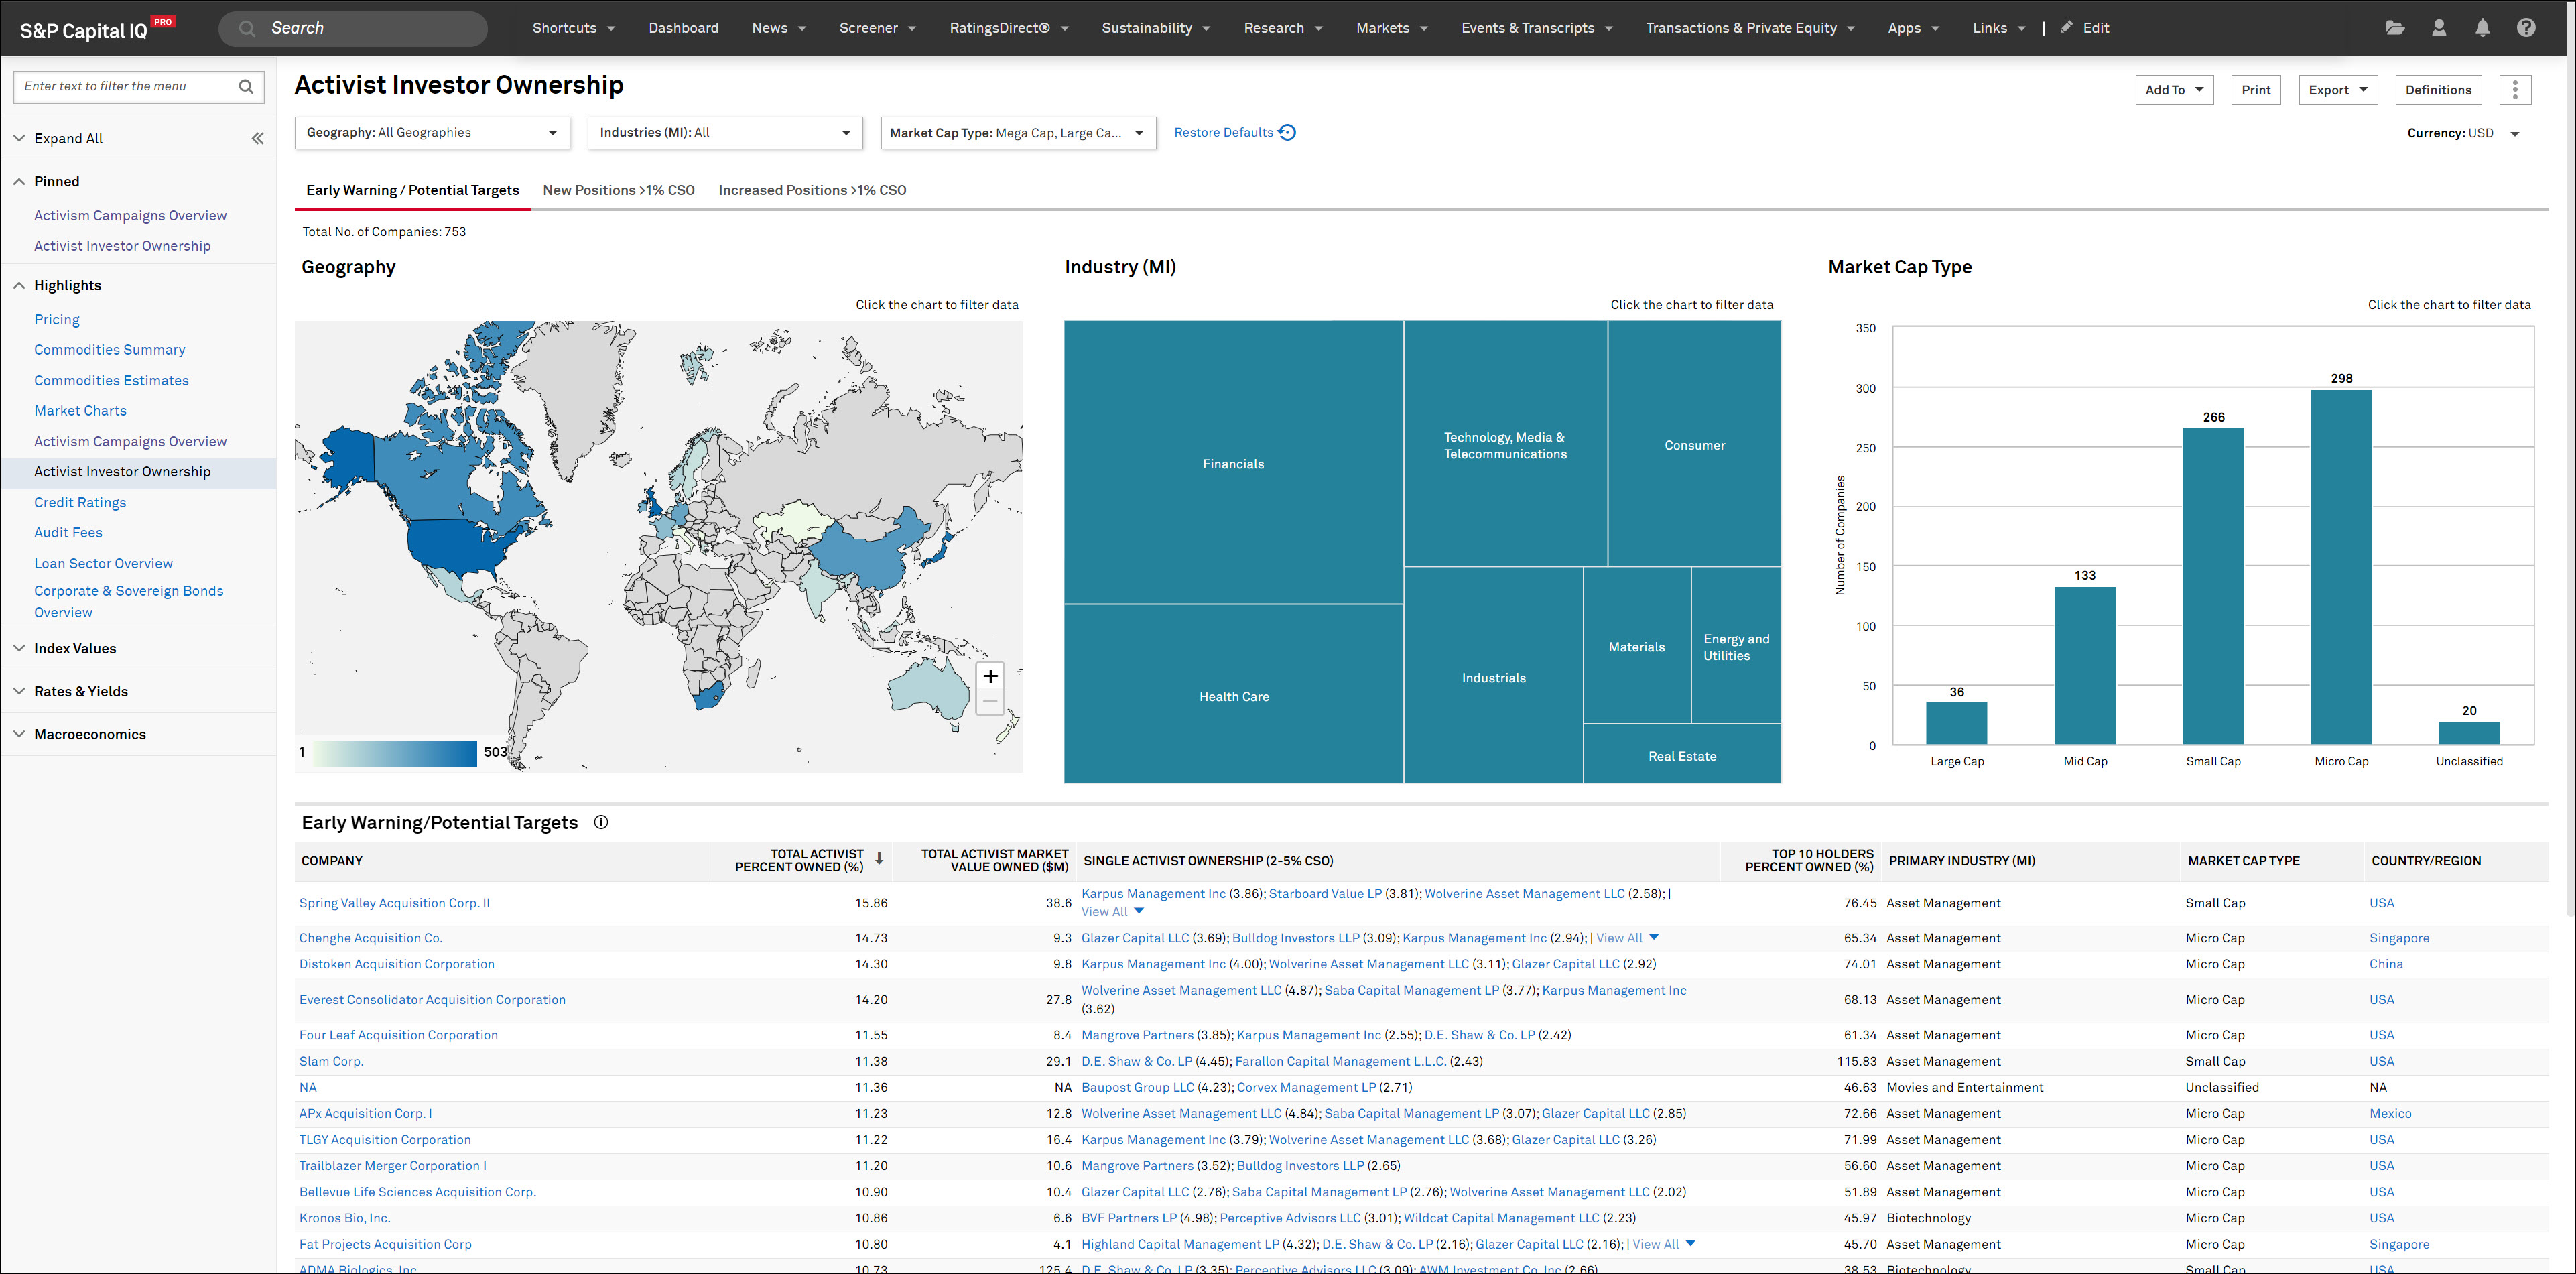
In this release, we expanded coverage to include key macroeconomic indicators for smaller economies offering insights into economic trends and business conditions.
We enhanced our coverage of key macroeconomic indicators for Bangladesh, Brunei, Burundi, Cameroon, Fiji, Guam, Guatemala, Kenya, Macau, Micronesia, Mozambique, Myanmar, Nicaragua, Nigeria, Palestine, Papua New Guinea, Paraguay, Qatar, Senegal, Solomon Islands, Tonga, Tuvalu and Vanuatu.
The economic indicators for these economies include Producer Price Inflation, Producer Price Index, Public Debt/GDP, Public Debt (LCU), Budget Revenue (LCU), Budget Expenditure/GDP, Budget Balance/GDP, Industrial Production Growth, Labor Productivity Growth, Labor force, Unemployment rate, Interest Payments and Debt Interest Payment/GDP.
Find it in the platform:
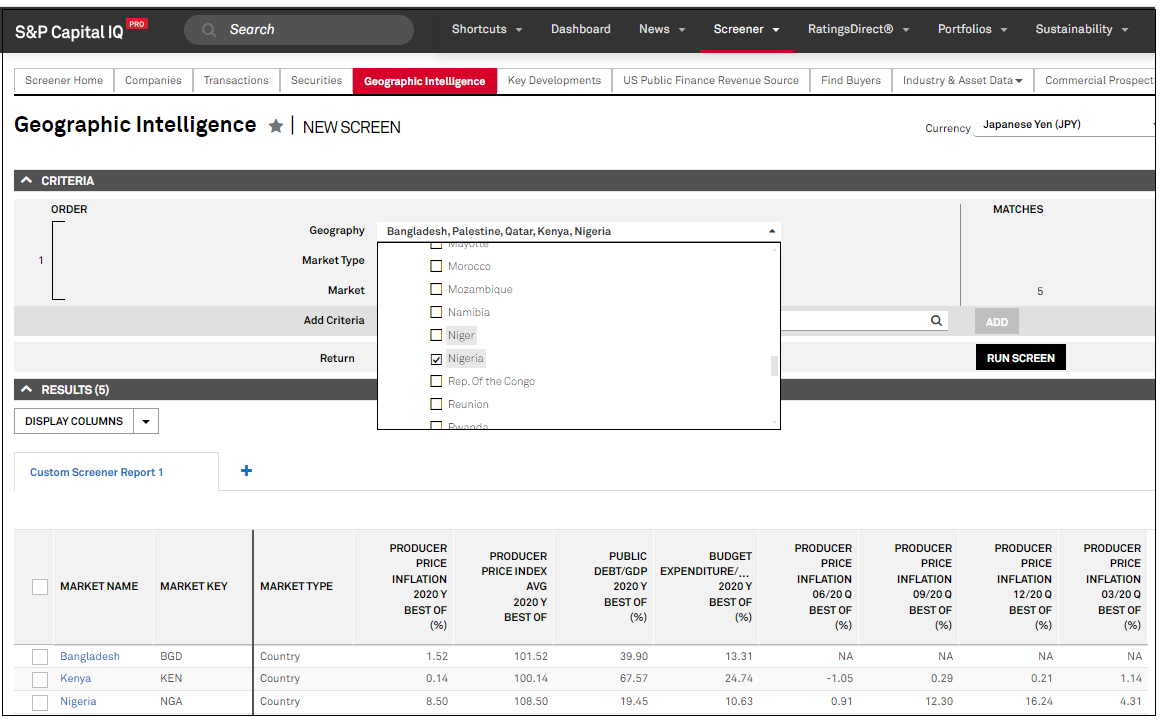
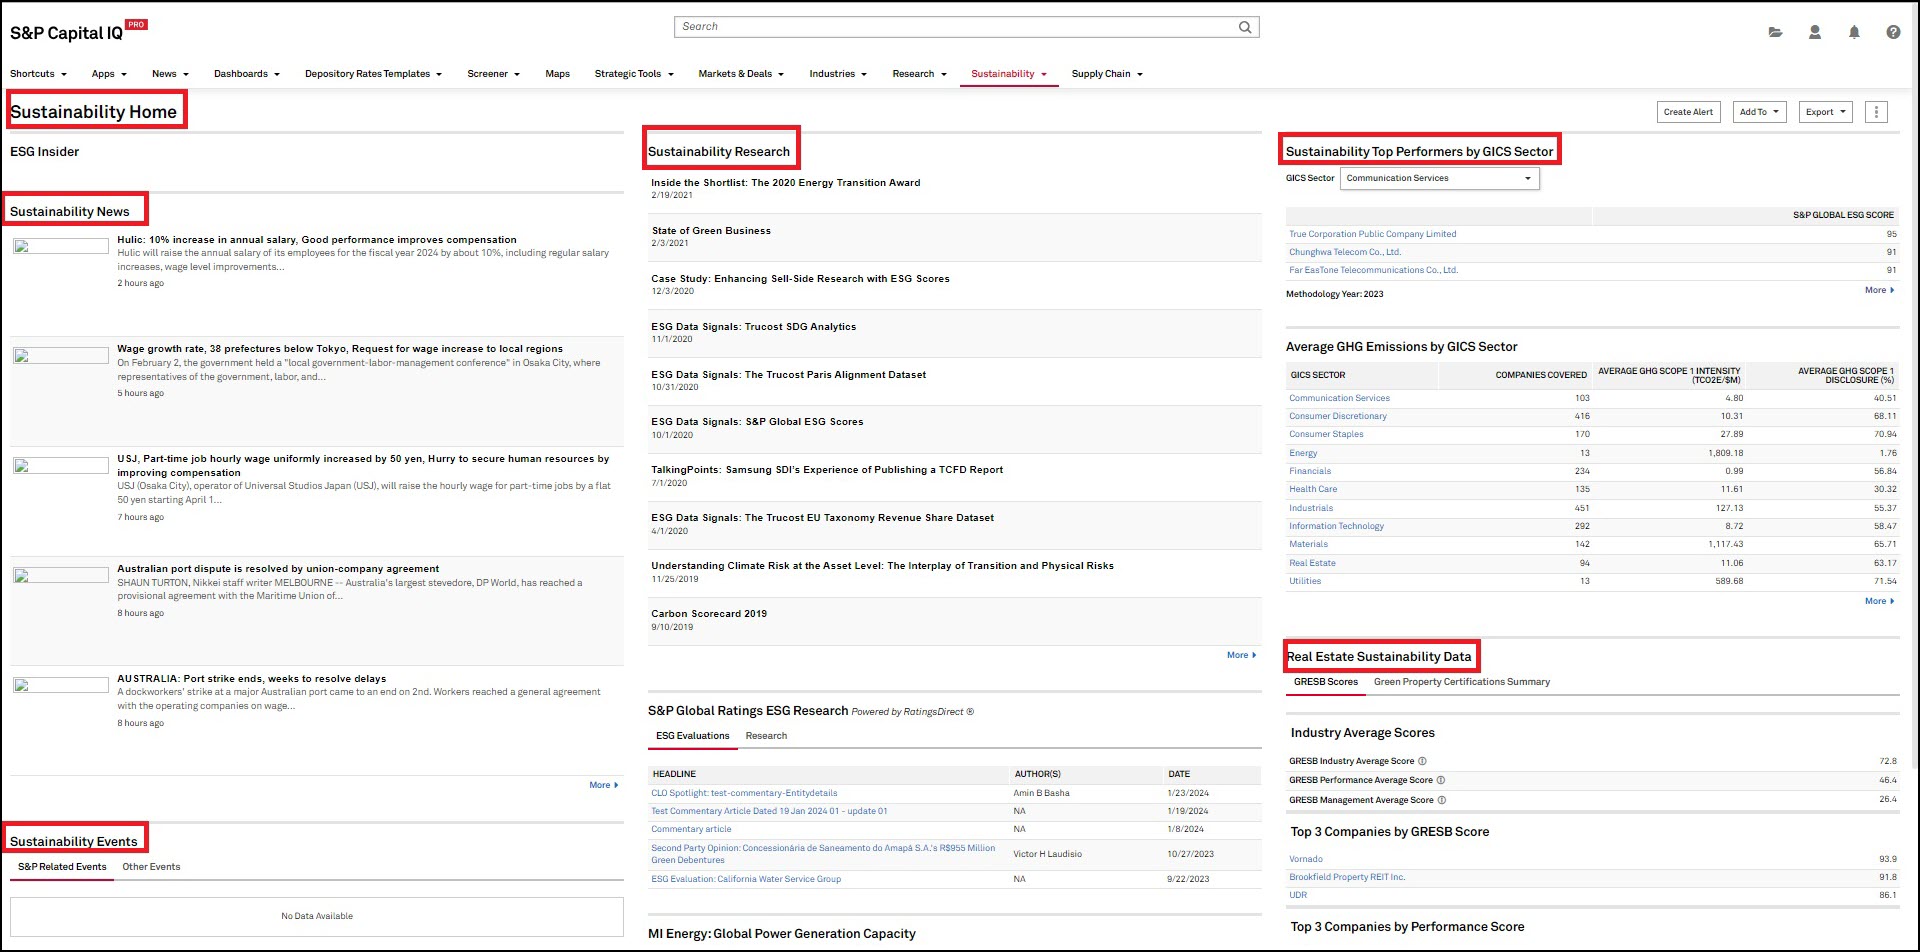
In this release, we updated the top tile ribbon of company Environmental Profiles for improved usability and added an indicator to let users know of metrics that are expected to be calculated in tables and charts. Additionally, we added Research Type flags and As-Reported Environmental data in workflow Apps and replaced ESG term with Sustainability to align with S&P Global's sustainability messaging. Finally, we introduced a dataset solution for Sustainable Finance Disclosure Regulation (SFDR) in Portfolio Analytics where users can evaluate their portfolios and understand the impact of their investment decisions on sustainability factors, as outlined by the SFDR.
Users can access an enhanced version of the top tile ribbon in company environmental profiles offering improved usability. As-Reported and S&P-generated values can be clearly differentiated, and the adjusted chart alignment enhances the user experience when reviewing and comparing Environmental data. Additionally, users can view ‘To Be Calculated’ displayed for metrics and portlets that have As-Reported data but not S&P-generated data to provide context on why the data is not available when company-disclosed data is available.
Find it in the platform:

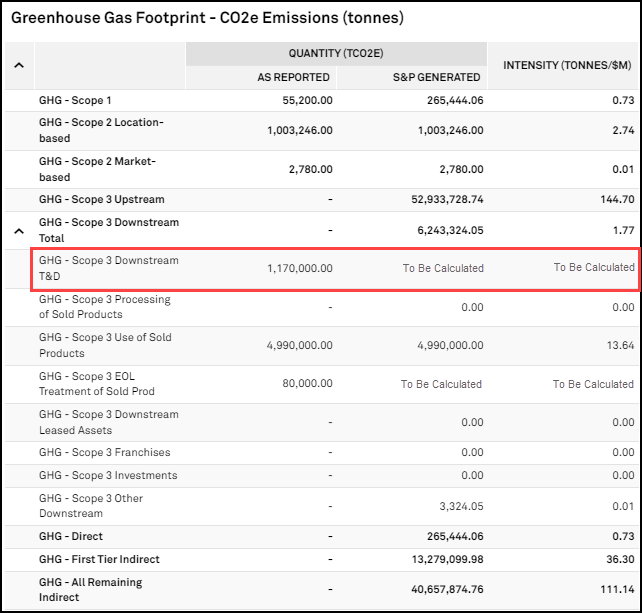
Users can access Physical Risk Scores reflecting exposure to Pluvial Flood hazards across various scenarios and time periods for companies and their assets. These new data points continue to expand an already robust Physical Risk hazards coverage by displaying exposure to pluvial flood conditions, which is quantified as the annual frequency of a 100-year flood depth, based on the annual frequency of the historical baseline of 100-year daily precipitation rate.
Find it in the platform:

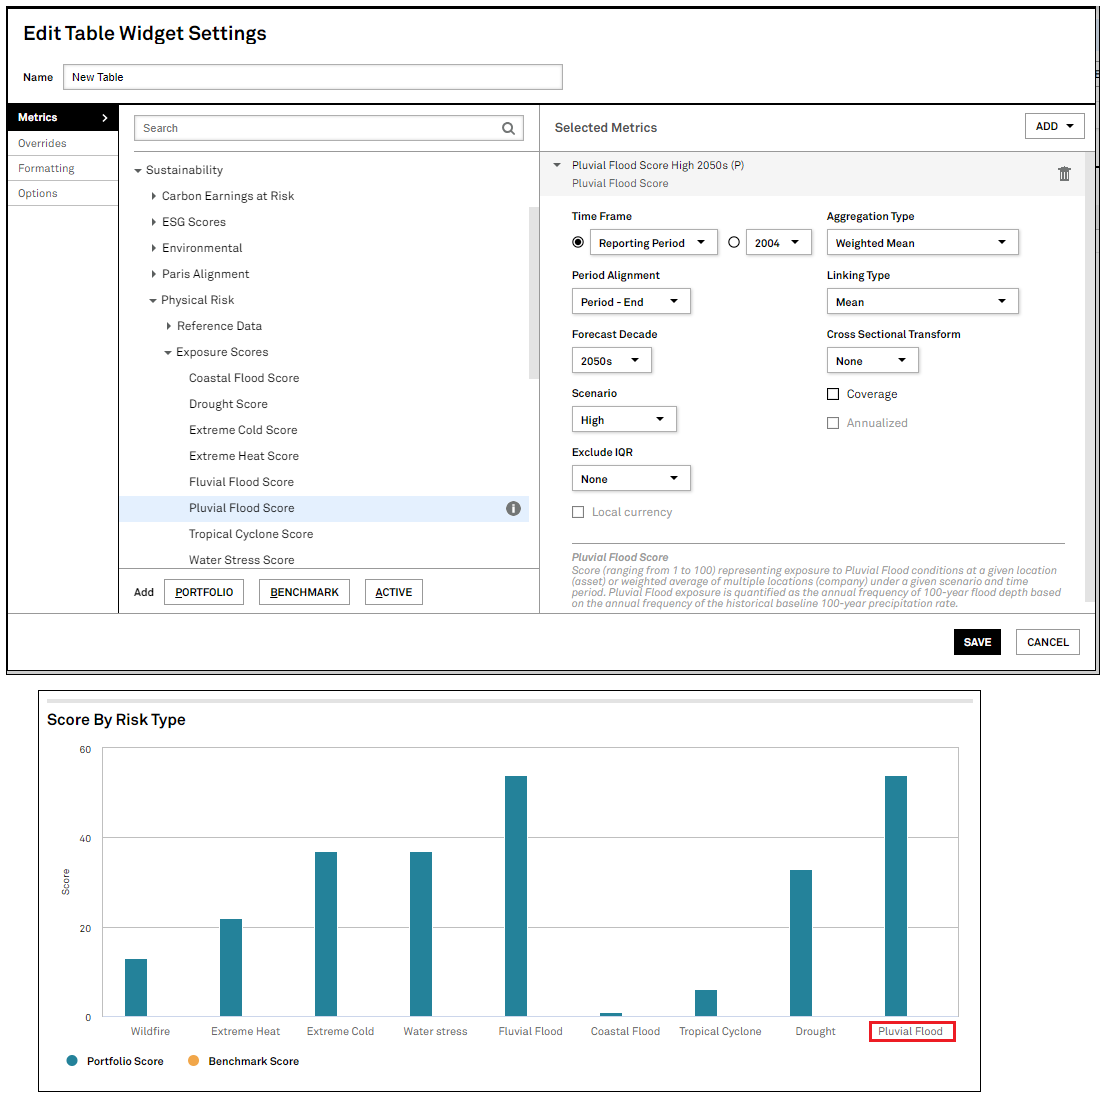
We updated page headers and navigation labels, featuring the term Sustainability on the Capital IQ Pro platform to align product & service taxonomy to S&P Global's sustainability messaging.
Find it in the platform:
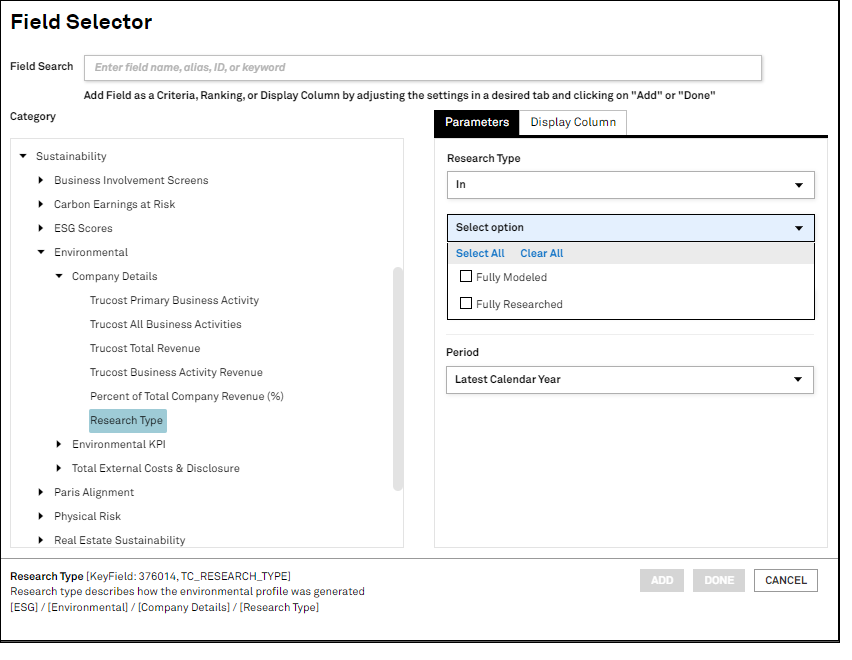
Users can now screen for companies based on the environmental research type, which describes how the environmental profile was generated. A company’s environmental data can either be part of the Trucost fully researched universe or modeled, and the new research type field is available in Screener, S&P Capital IQ Pro Plug-in and Dashboard.
Find it in the platform:
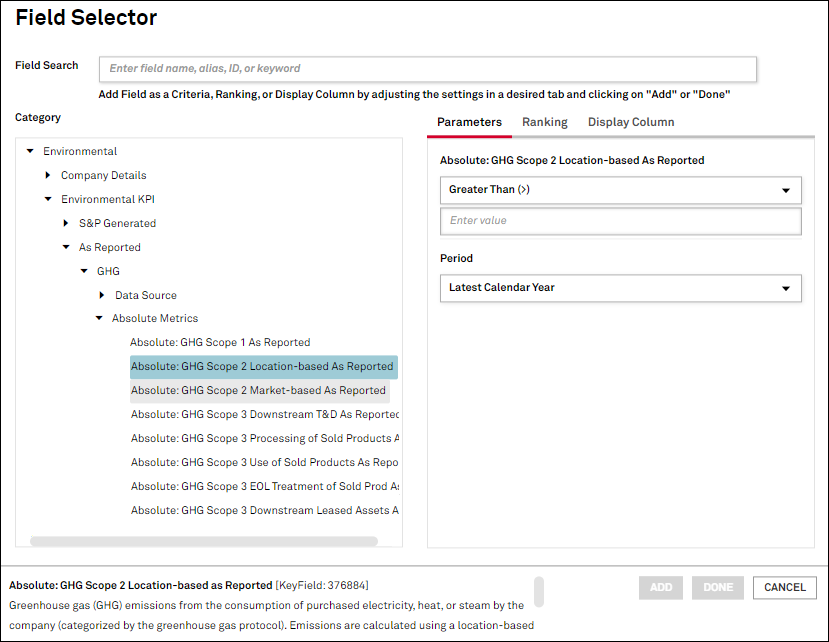
Users can now screen for companies and access as-reported environmental data as published by the company within Screener, S&P Capital IQ Pro plug-in and Dashboard. This will highlight what was or was-not included in a company’s sustainability reporting, further enhancing the transparency in S&P Global’s modeling process that normalizes and standardizes the data.
Find it in the platform:
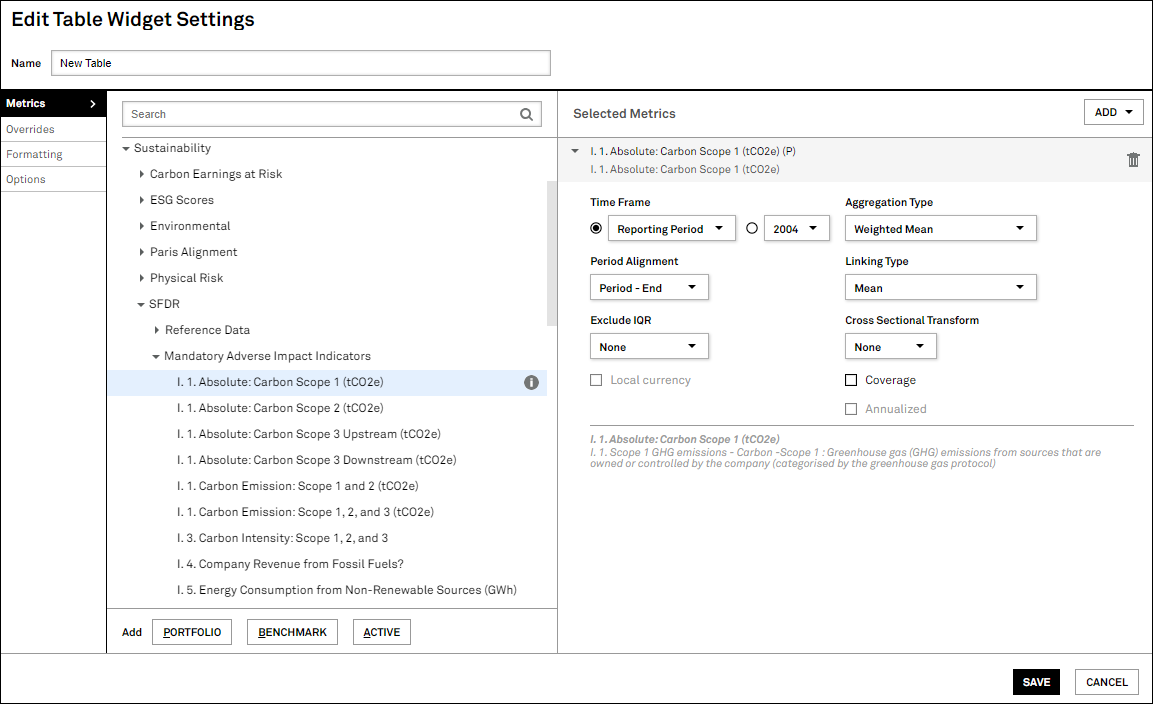
In this release, we expanded Portfolio Analysis coverage by integrating Sustainable Finance Disclosure Regulation (SFDR) metrics and enhancing support for private companies, enabling users to upload these companies directly, group them as an asset type and exclude private company holdings from analysis, as required. We have further enhanced report publishing capabilities by providing a mechanism for converting numeric values to their textual equivalents, which supports tagging and enhances reporting clarity.
Users can now evaluate their portfolios and understand the impact of their investment decisions on sustainability factors as outlined by the Sustainable Finance Disclosure Regulation. The SFDR dataset solution is now available in Portfolio Analytics. This enhancement enables users to conduct portfolio level assessment and initiate the disclosure process across a comprehensive set of corporate level indicators that align very closely with Principal Adverse Indicators (PAIs) in the areas of climate and environmental-related impacts, as well as social and employable matters, like respect for human rights, anti-corruption, and anti-bribery matters.
Find it in the platform:
Users can now upload portfolios with private company holdings via Portfolio Dashboard. Portfolios with private holdings can be uploaded by copying and pasting the holdings list or uploading a file containing portfolio constituents, including private companies.
Find it in the platform:
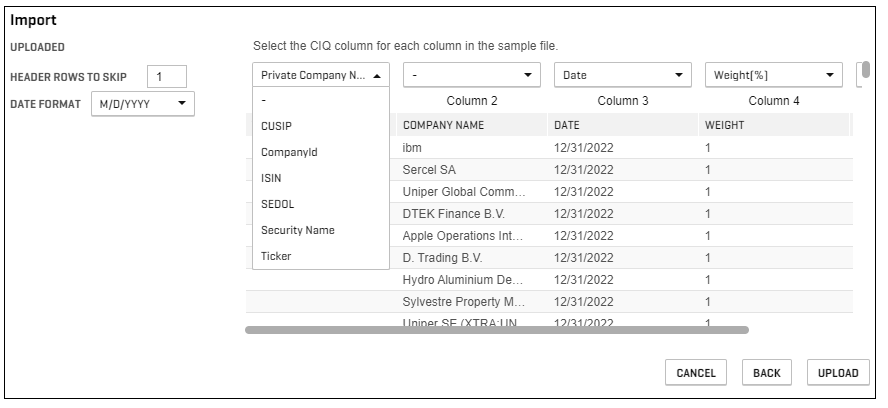
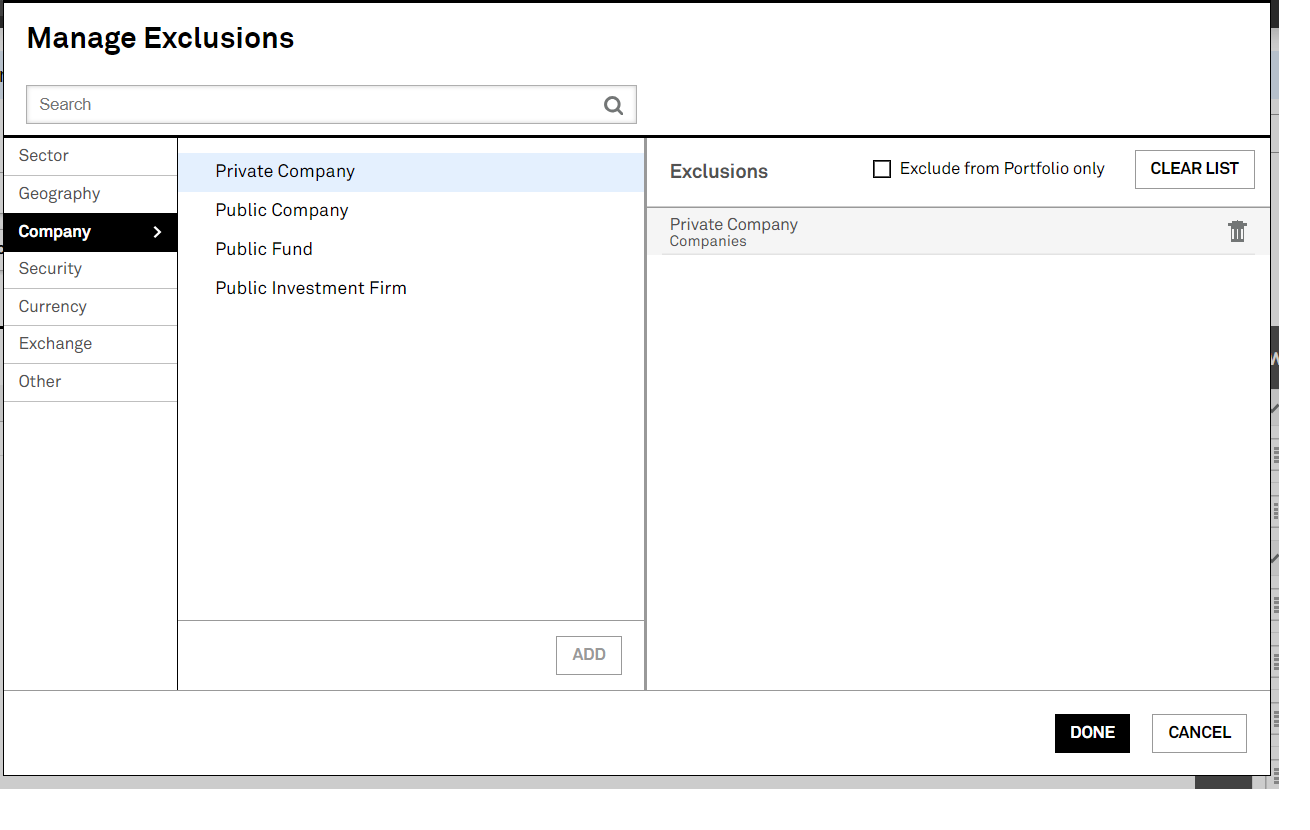
Users can group private companies as a specific asset class within portfolios containing such holdings. They can segment their private company holdings as a group and exclude all or specific private companies from analysis as required.
Find it in the platform:
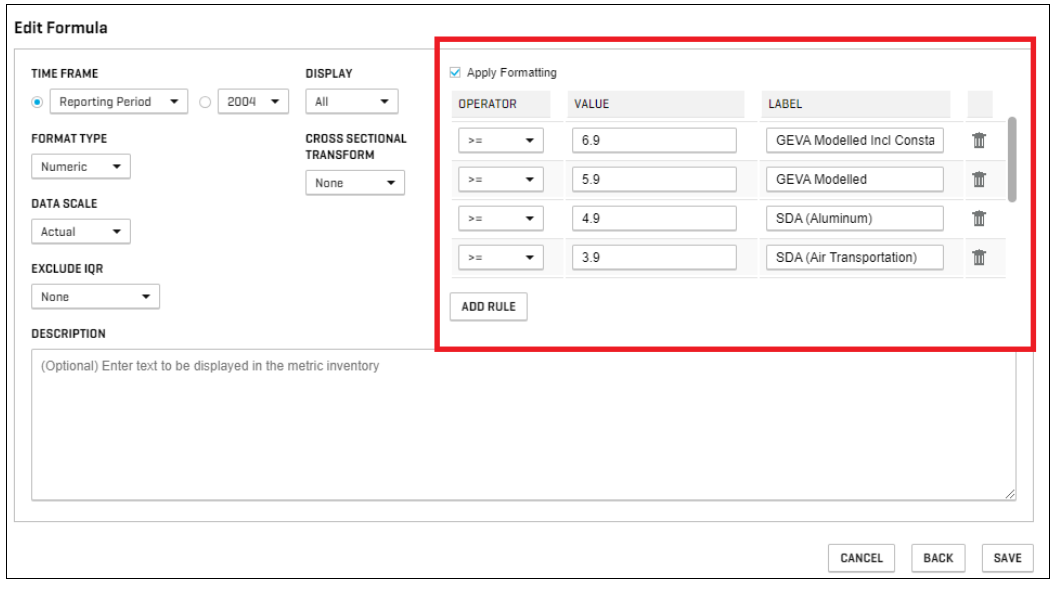
Users can apply formatting to convert numerical data into textual strings within reports, enabling metric tagging with textual labels or displaying numeric values as text when applicable. This approach is recommended when textual representation provides more clarity to the content of analysis and the most common use applies to custom formulas.
Find it in the platform:
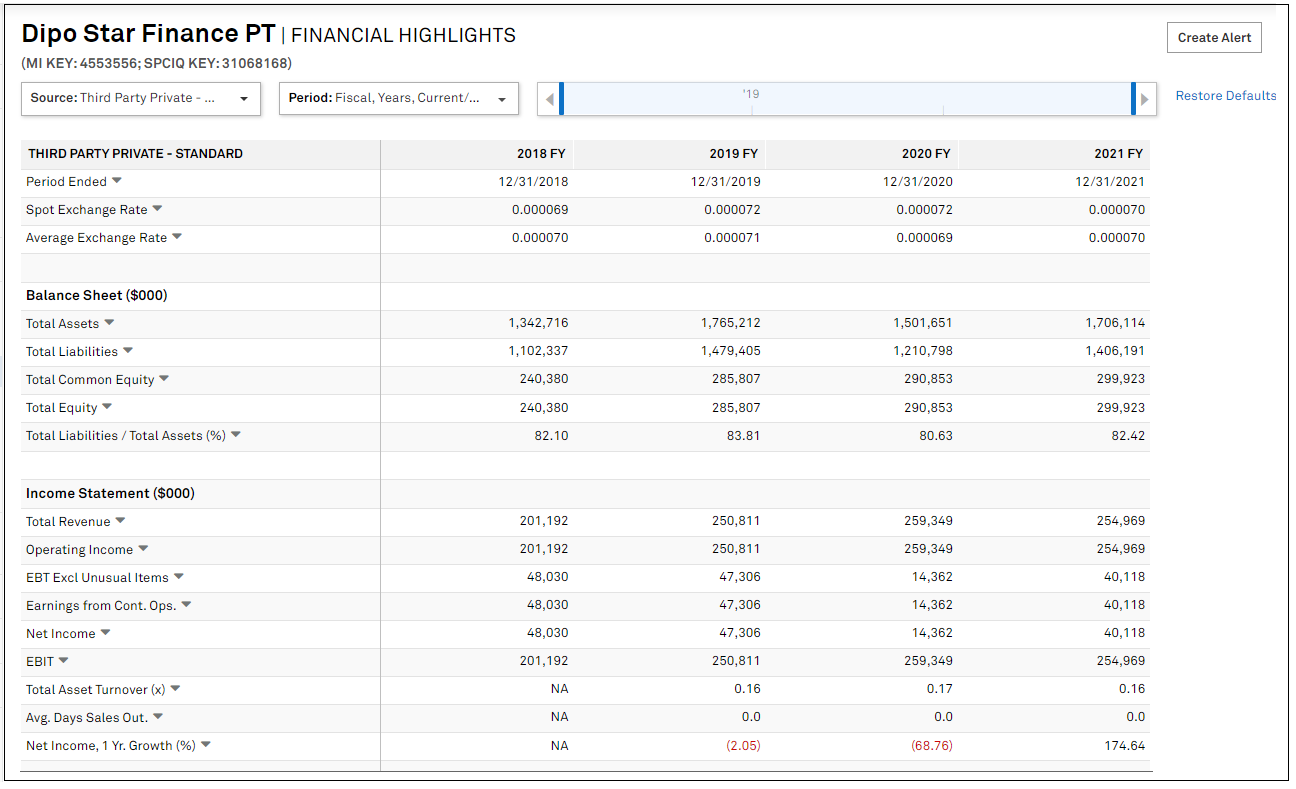
In this release, we further enhanced coverage with the addition of APAC private companies, including 3rd party vendor-sourced firmographics, financials, and officers & directors' data for small and medium enterprises based in Indonesia, Philippines and Vietnam.
Users can access additional financials & firmographics data for small and medium enterprises in Indonesia, Philippines & Vietnam, significantly enhancing coverage for this geography.
Find it in the platform:
Coverage stats:
Users can access additional officers & directors' data for small and medium enterprises in Philippines, significantly enhancing coverage for this market.
Find it in the platform:
Coverage stats:
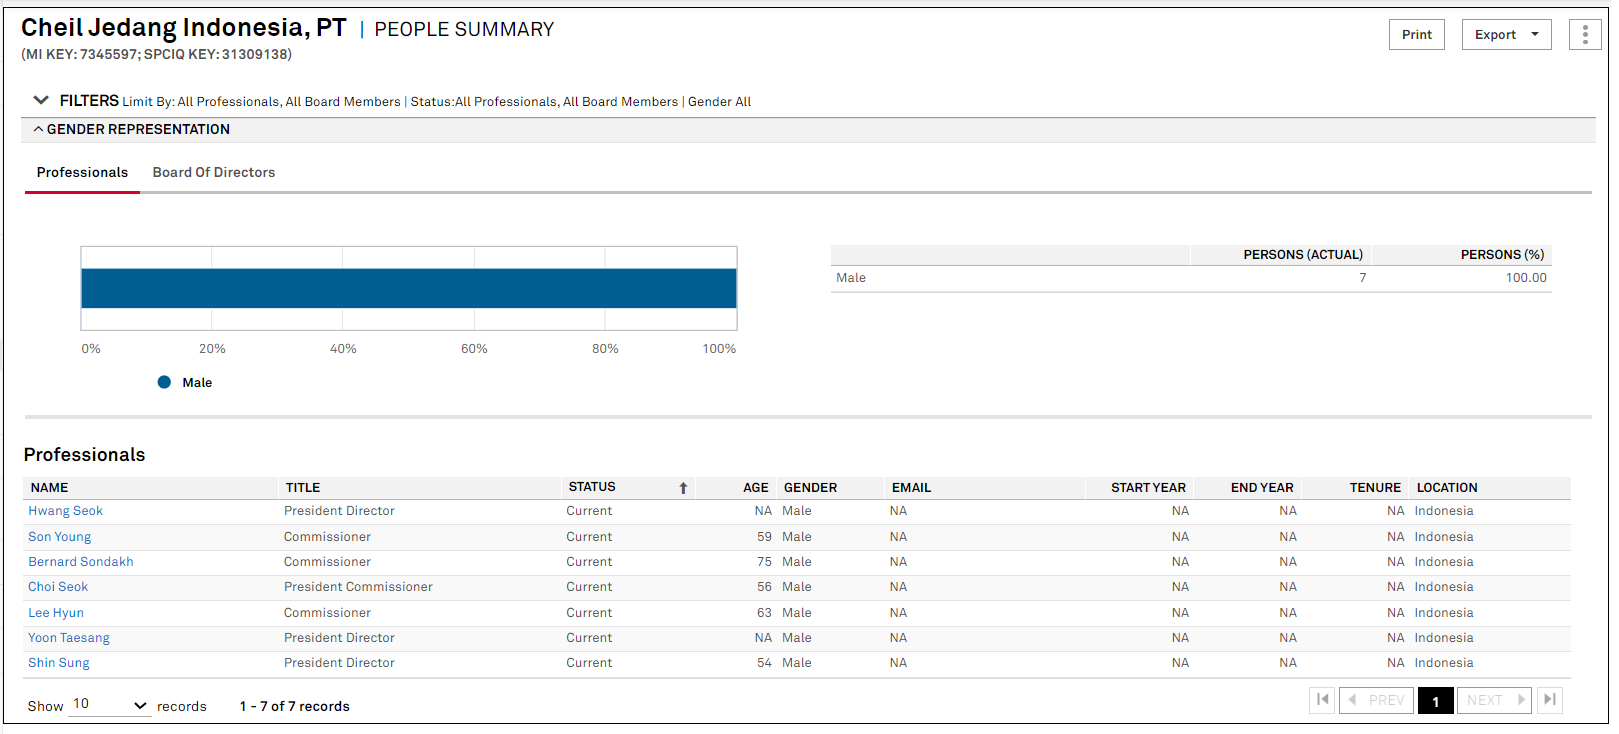
In this release, we enhanced user workflows across sectors. Analysts focused on sovereign credit now have access to unique peers’ comparison views for countries based on Banking Industry & Country Risk Assessments (BICRA). Structured Finance users will benefit from the new CLO Market Overview and CLO Insights, providing detailed analysis of Collateralized Loan Obligations (CLO). Additionally, all RatingsDirect users will have improved usability in platform with Quick Alerts and Subsidiary Alerts for real-time rating actions. Furthermore, we introduced Outlook, Upside & Downside Scenario selections in Screener and S&P Capital IQ Pro plug-in.
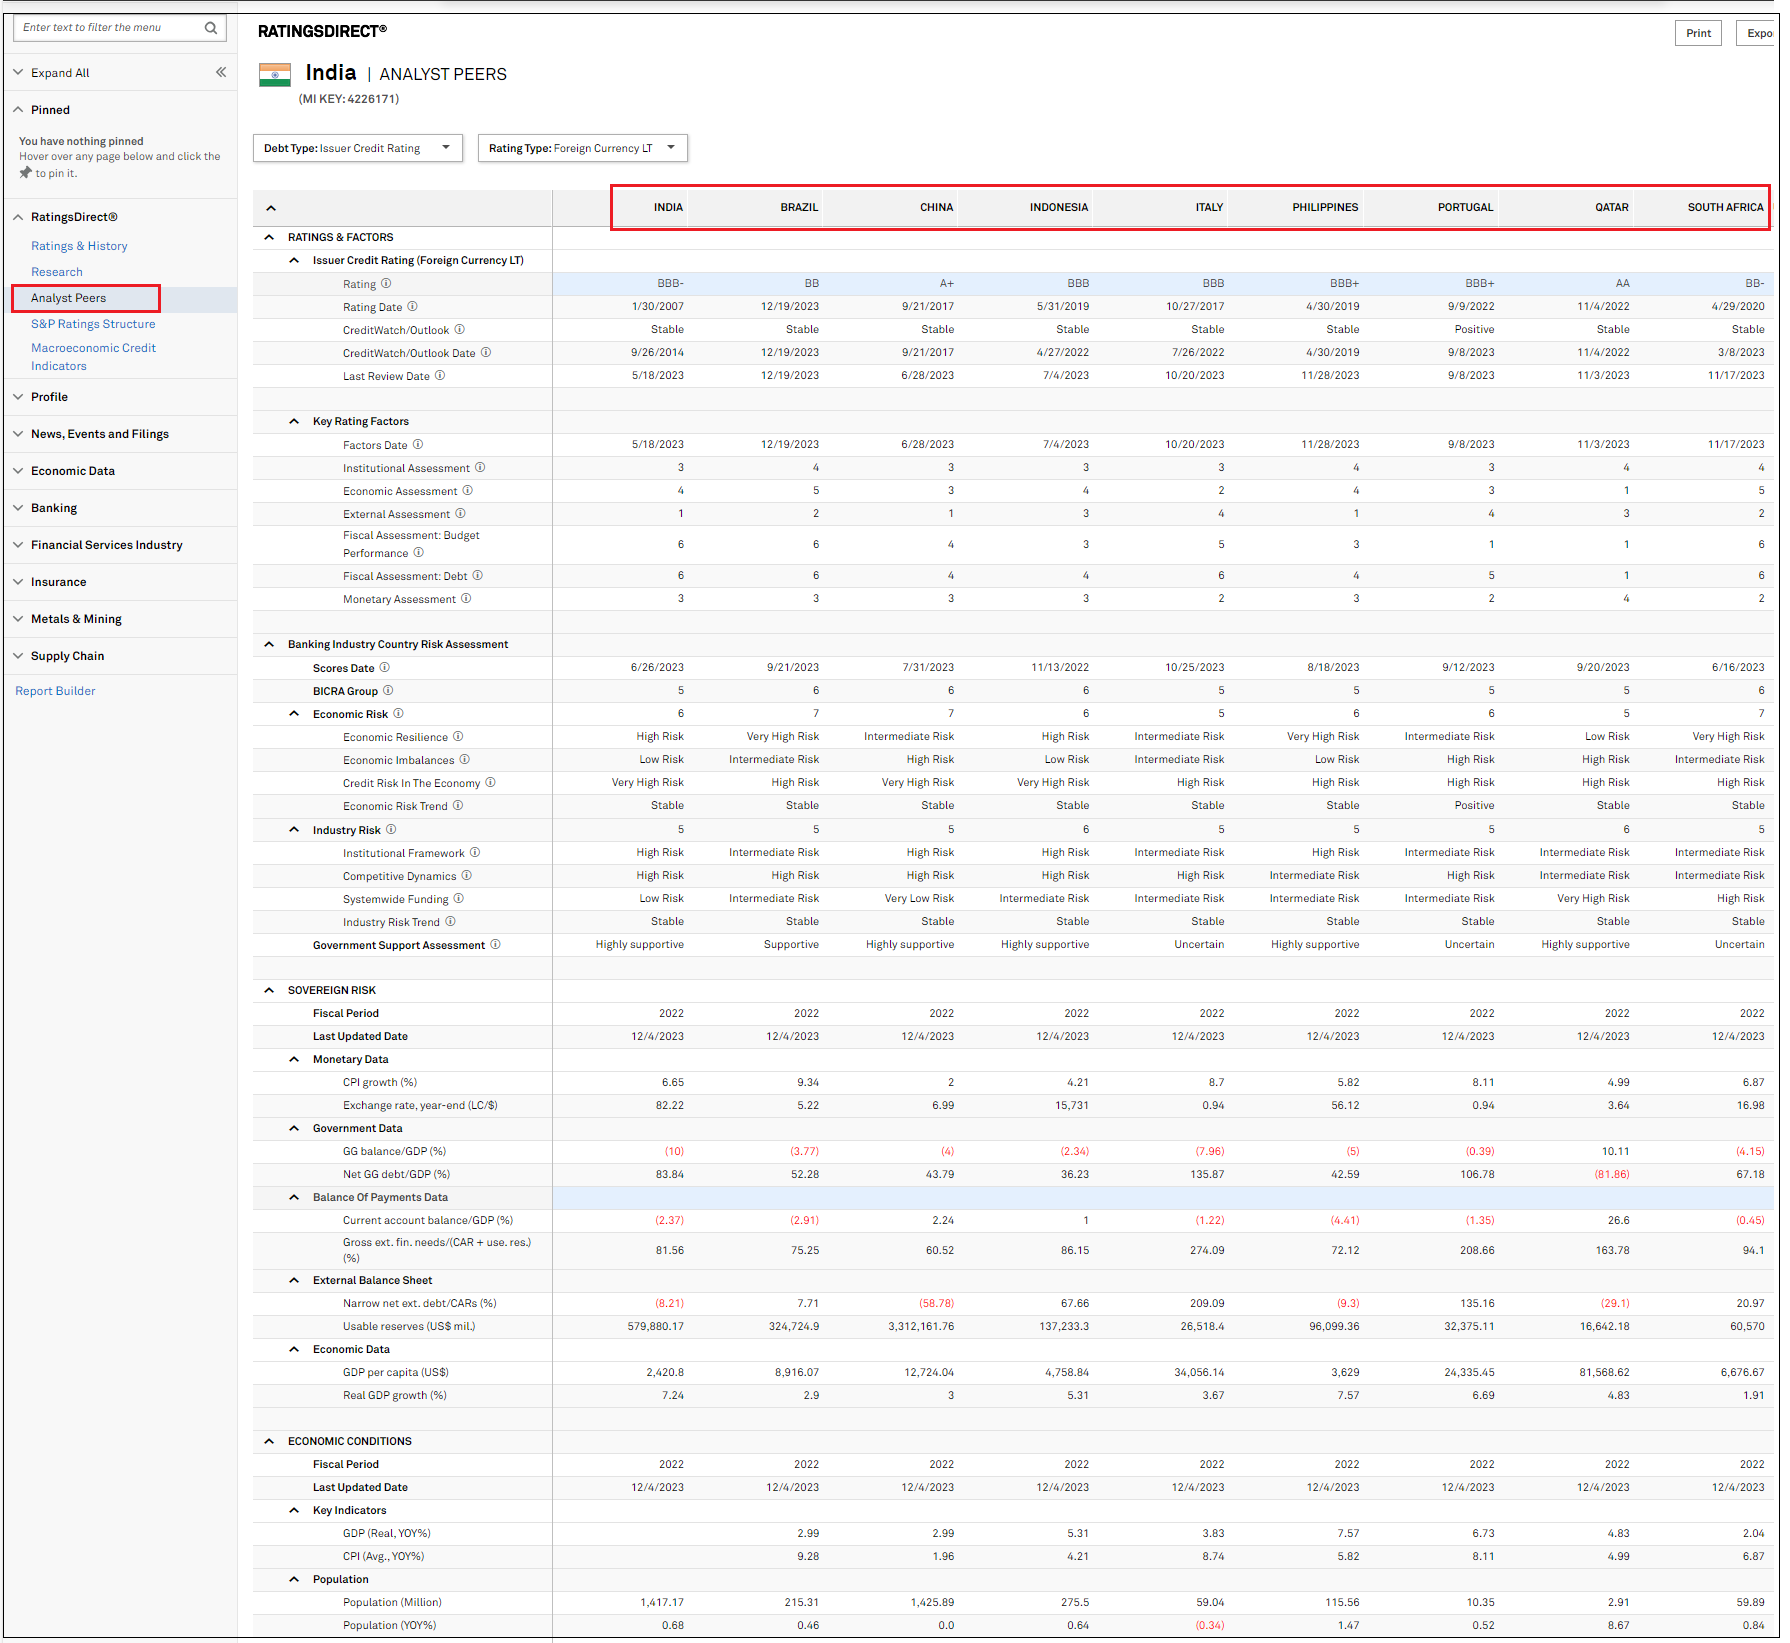
RatingsDirect® users interested in sovereign data can now access S&P Global Ratings’ analyst-defined peers, determined based on Banking Industry & Country Risk Assessments (BICRA), via the Analyst Peers. This feature enables users to compare a comprehensive list of key metrics across similar sovereigns, including credit ratings, sovereign factors, BICRA assessments, risk metrics, and economic conditions.
Find it in the platform:
Coverage stats:
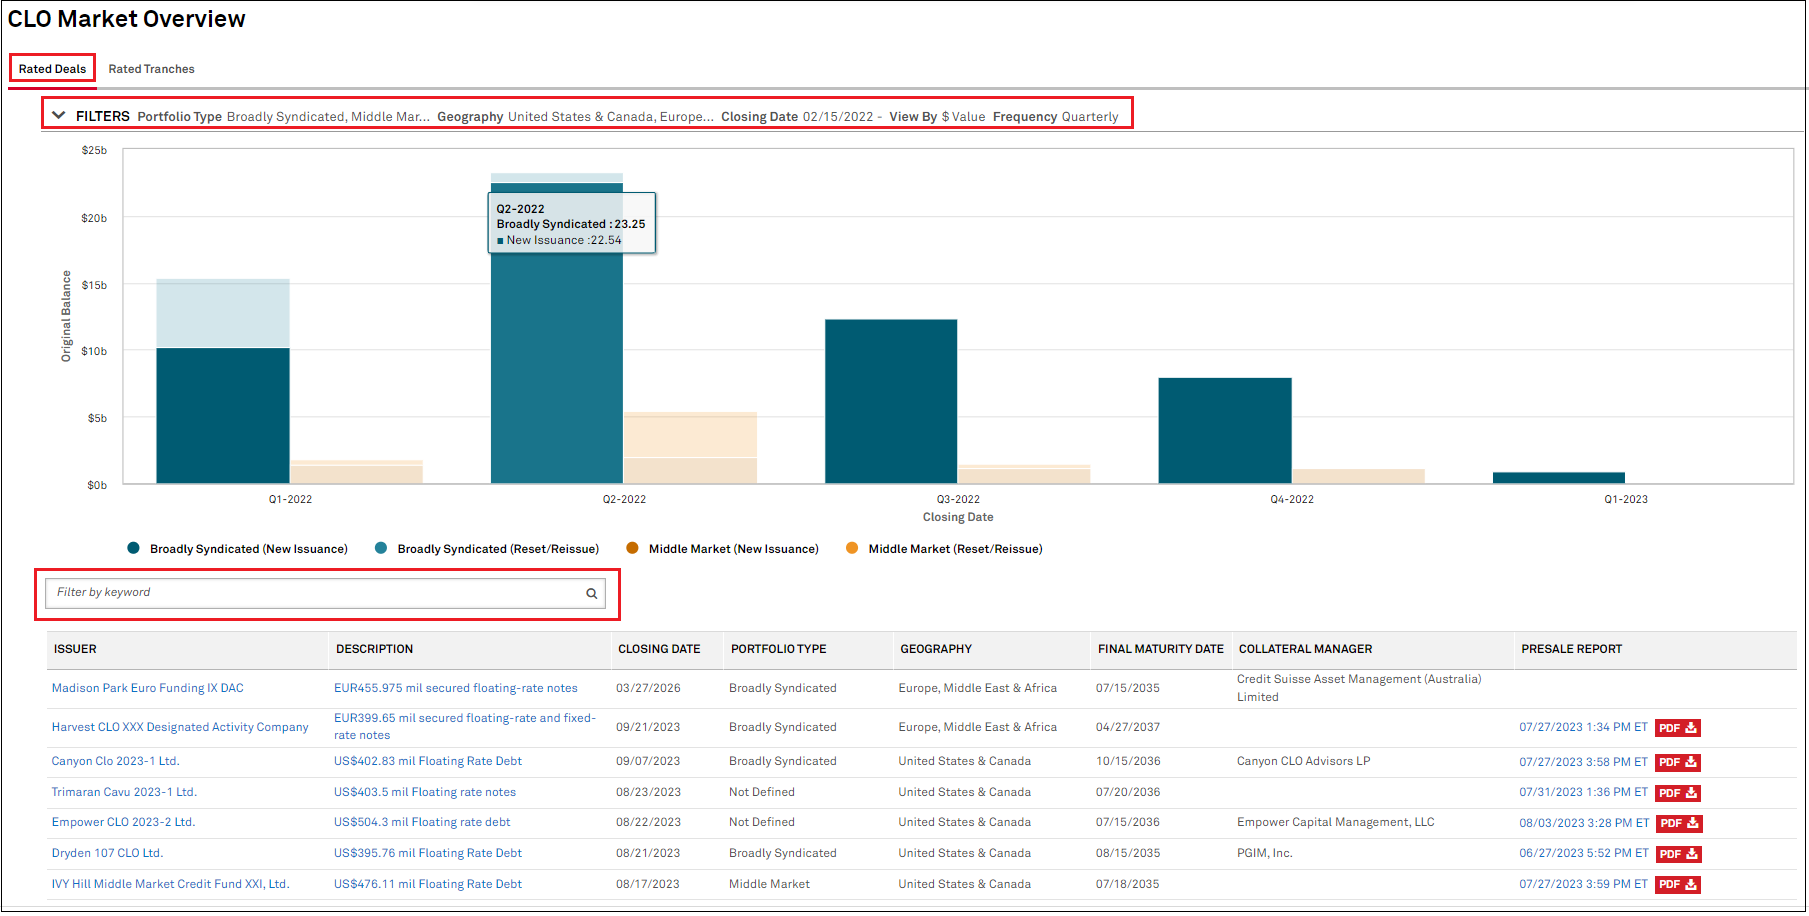
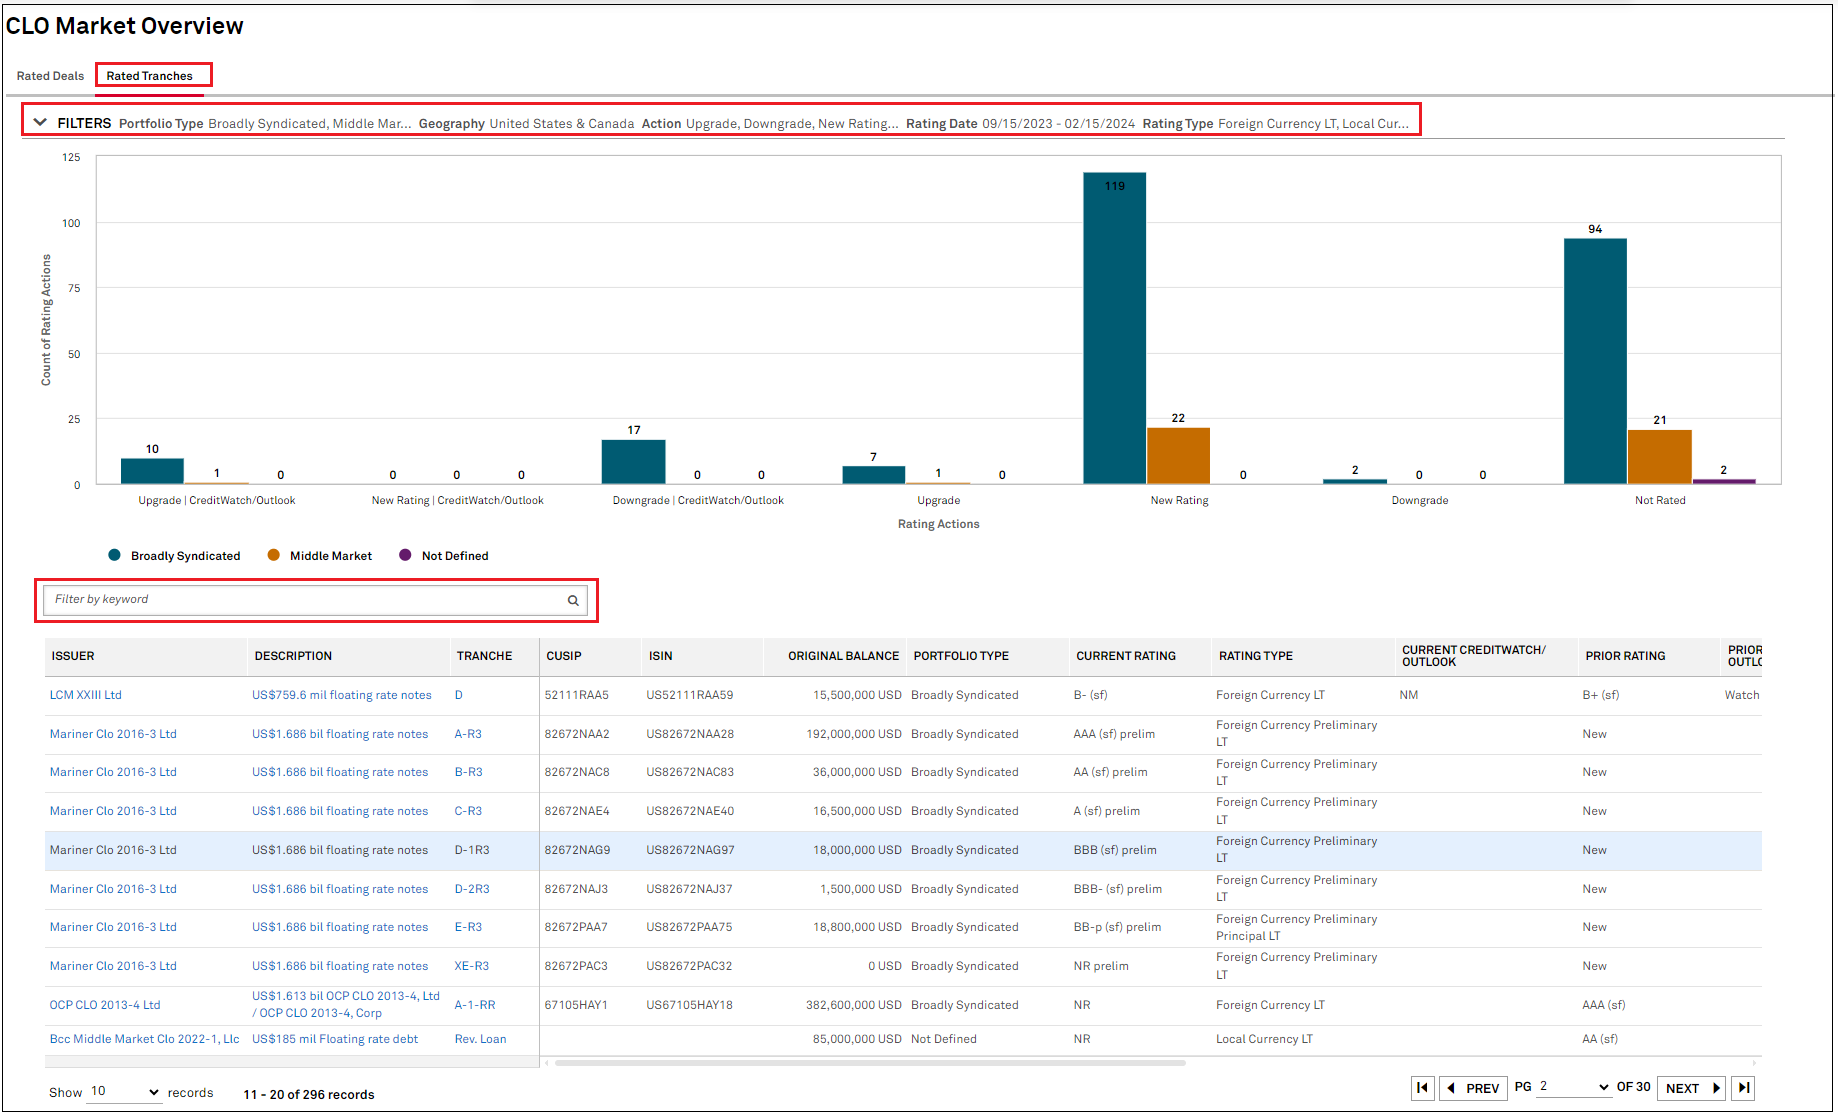
RatingsDirect® users with Structured Finance capabilities will gain access to the CLO Market Overview page, providing a customizable view into the volume of new Collateralized Loan Obligation (CLO) issuances rated by S&P Ratings. Users can visualize the breakdown of issuances by portfolio type and geography, gaining insights into market dynamics. Additionally, users can analyze rated deals and tranches, with flexibility to use various parameters to visually demonstrate the value and count of rated deals across different timeframes. At the tranche level, users can track CLO credit rating actions over time, displaying an aggregate chart of CLO rating actions.
Find it in the platform:
Coverage stats:
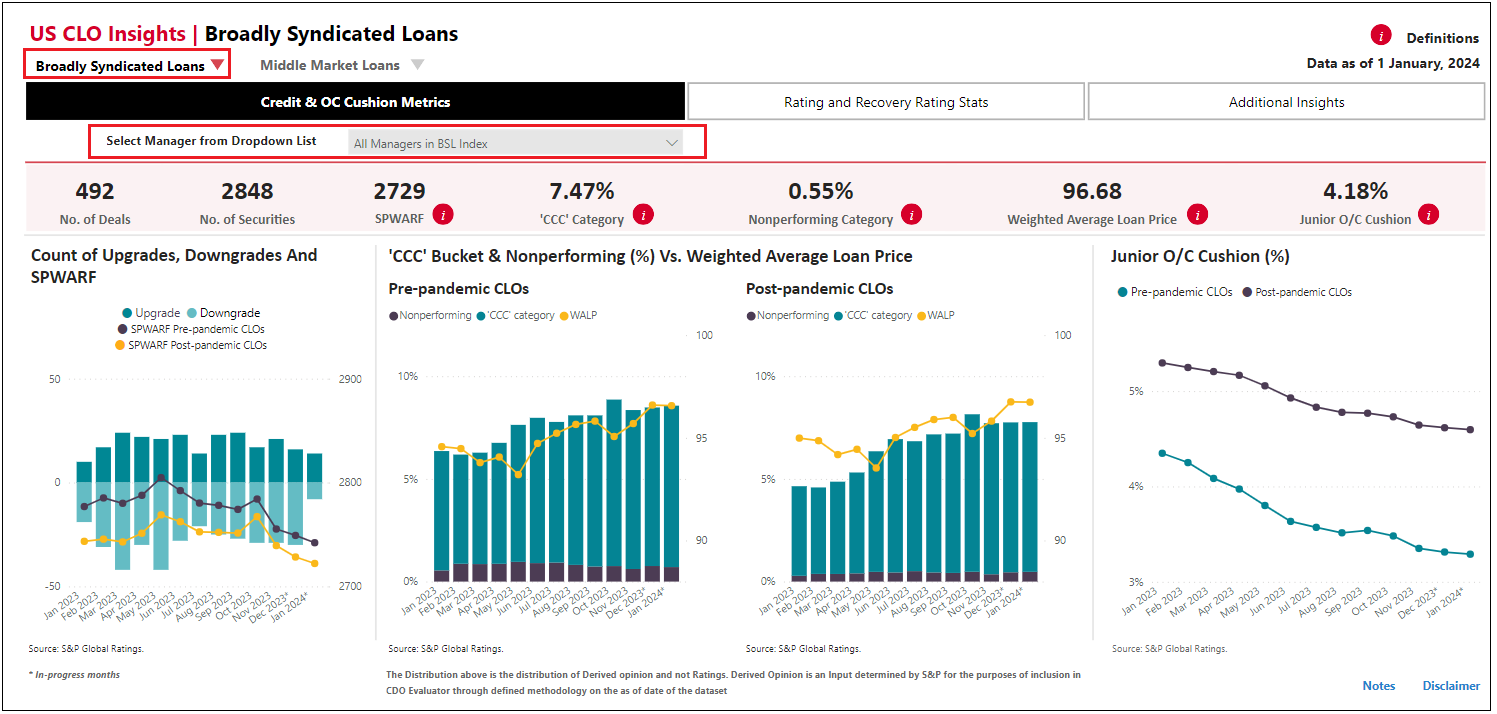
Users interested specifically in U.S. Collateralized Loan Obligations (CLO) deals can access a new page with an interactive focus on Credit & OC Cushion metrics for Broadly Syndicated and Middle Market category of deals. The page enables users to conduct on-the-fly analysis by comparing specific managers against the entire manager universe. The dynamic widgets and charts allow users to delve deep into the characteristics of specific CLO managers and the aggregate market.
Find it in the platform:
Coverage stats:
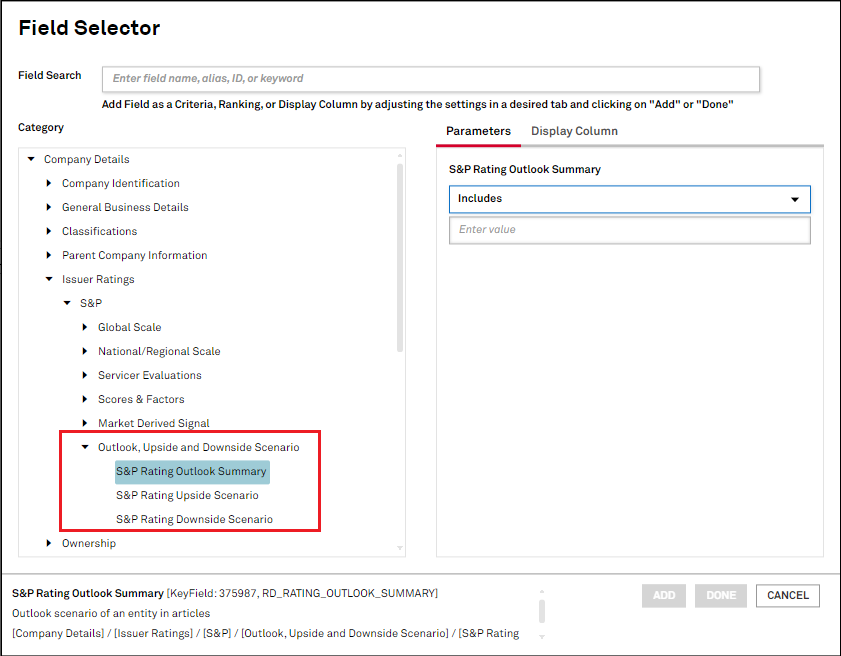
Users can filter entities based on keywords found in Outlook, Downside Scenario, and Upside Scenario text. They can also access the latest values through S&P Capital IQ Pro plug-in, streamlining their workflow.
Find it in the platform:
Coverage stats:
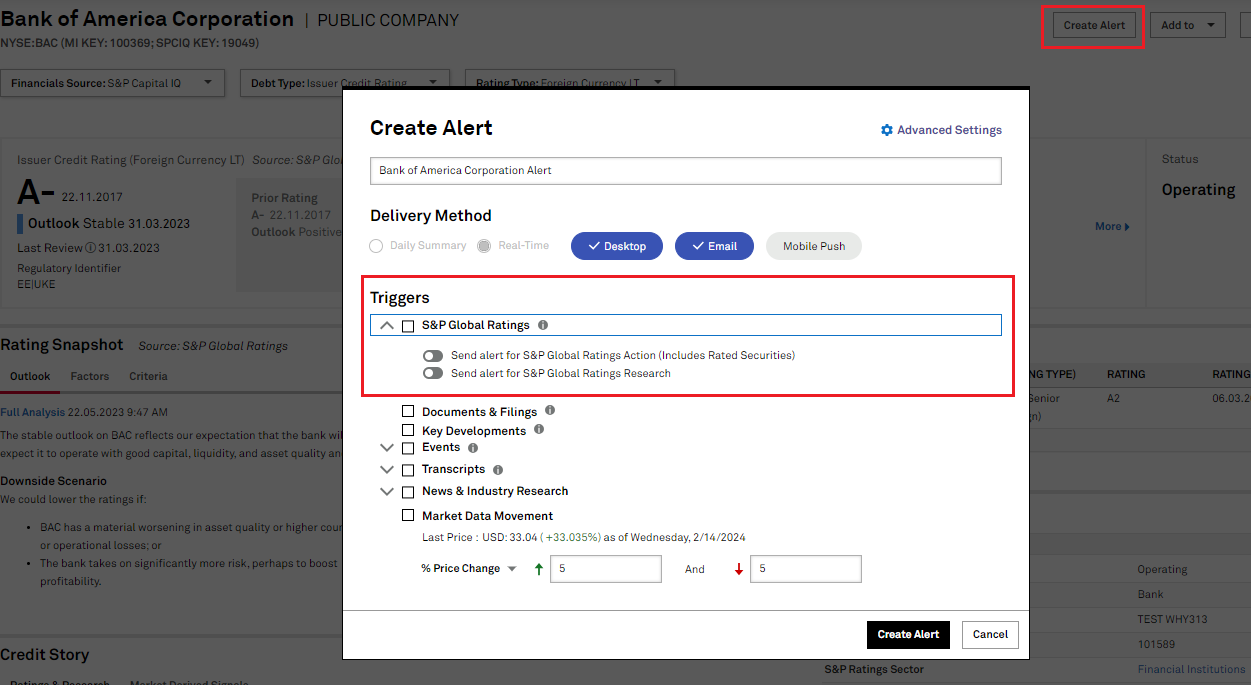
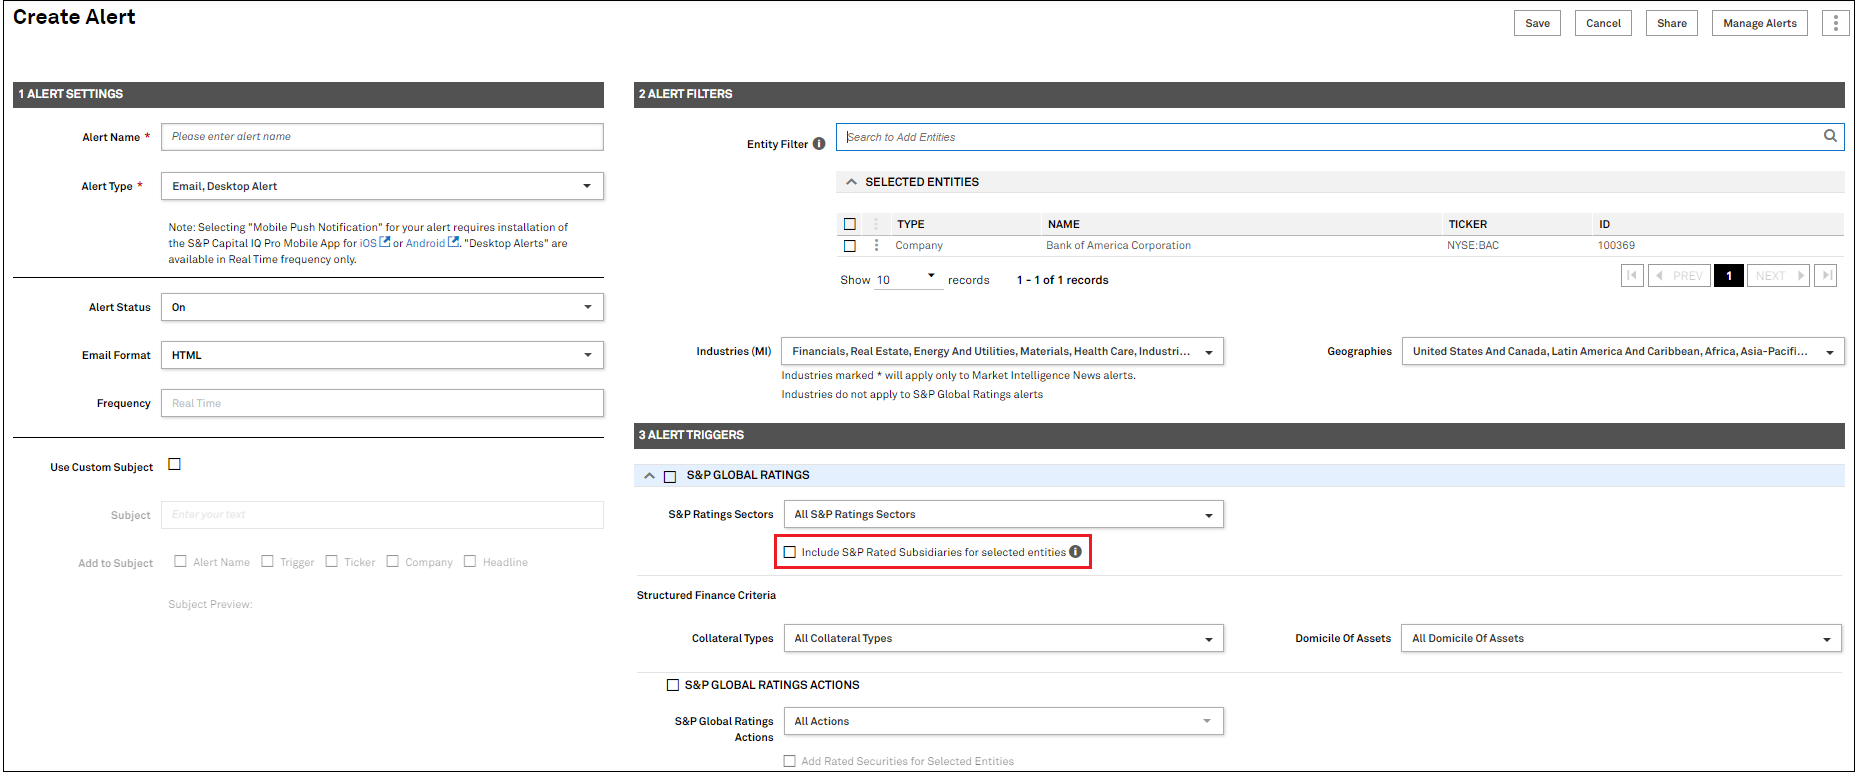
Users can quickly create S&P Global Ratings rating action and credit research alerts directly from the Corporate Profile and Country/Region Profile using the Quick Alerts feature. This eliminates the need for users to navigate away from the profile page, resulting in a smoother and faster alert setup experience. Users can also create and receive S&P Global Ratings rating action alerts on subsidiaries of an entity or list of entities. This is beneficial for users interested in receiving rating action alerts for all entities within the corporate structure of a parent entity.
Find it in the platform:
Coverage stats:
In this release, we added new maturity fields related to bank deposits and debt details for US GAAP and Global banks. In addition, we added section 5 from Schedule D of the Investment Advisory Details report in accordance with the new additions of the SEC's Form ADV. We also enhanced Peer reports tailored for Credit Unions and updated Credit Union Regulatory Financial Summary pages with latest line-items sourced from 5300 call reports. Furthermore, we introduced new Adjusted Tangible Common Equity fields helping users analyze liquidity crunch and other derived bank regulatory fields.
Users can access new maturity fields related to bank deposits and debt details for US GAAP and Global banks on the platform including Screener.
Find it in the platform:
Coverage stats:
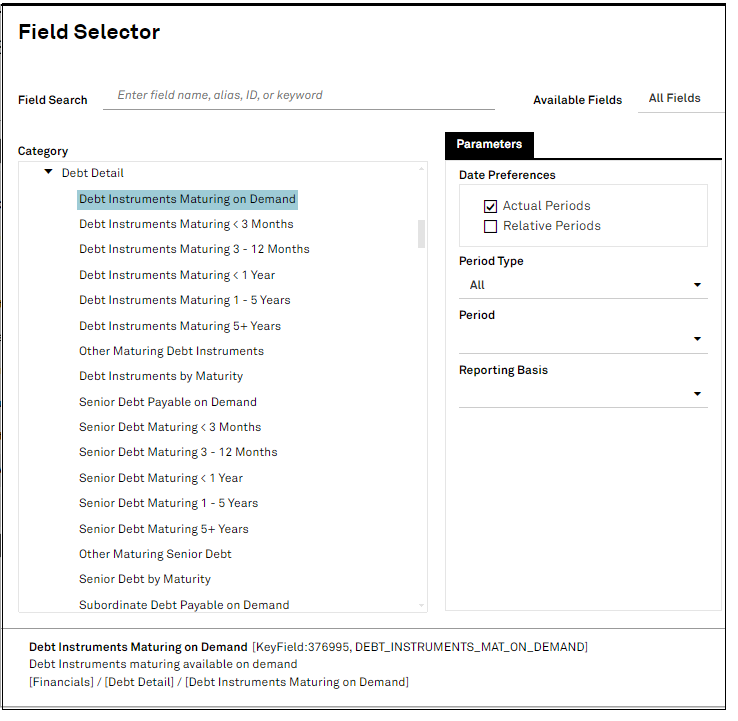
Users can now access additional disclosure details of Separately Managed Accounts (SMAs) custodians by referring to the newly added Section 5.K.3 Custodians of Separately Managed Accounts and Section 1.F Other Offices from Form ADV in Screener. SMAs are a portfolio of assets managed by a professional investment firm of which vast majority of firms are RIA - Registered Investment Advisors who are required to disclose various details on their SMAs and their custodians to the SEC.
Find it in the platform:
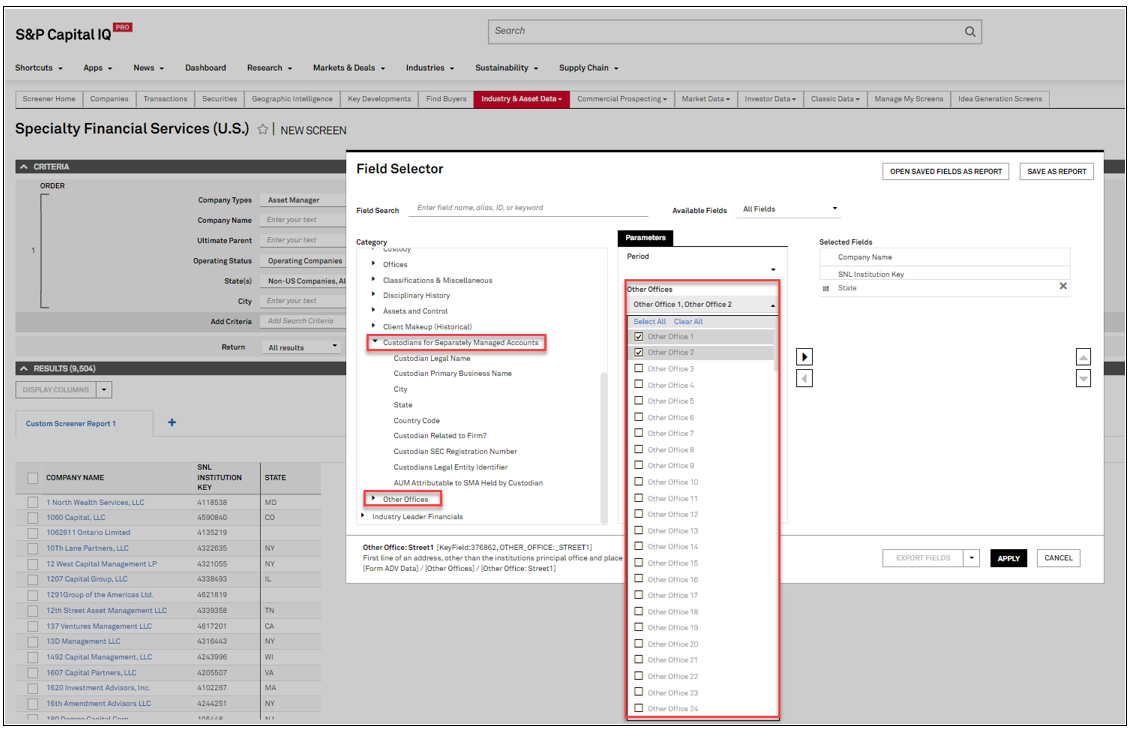
Users can now access enhanced peer reports from Peer Analysis specifically tailored for Credit Unions and can add or remove relevant line-items from these reports.
Find it in the platform:
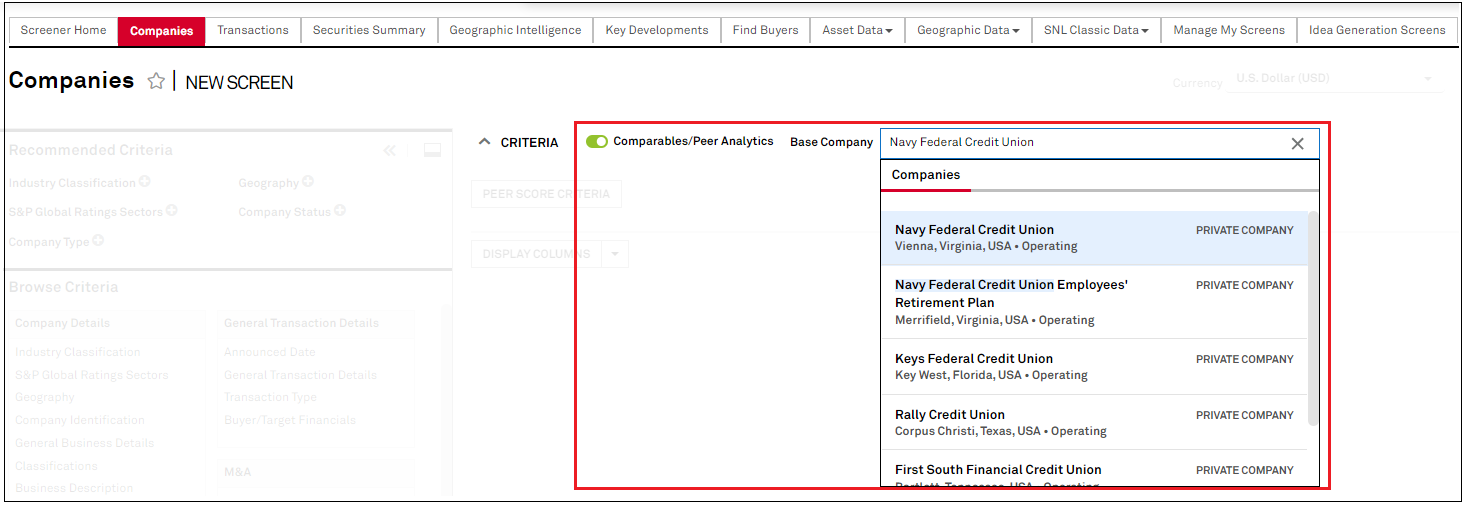
Users can access updated Credit Union Regulatory Summary Financial pages on the S&P Capital IQ Pro platform with the latest 5300 Call Report fields across Financial Highlights, Balance Sheet, Income Statement and Asset Quality pages.
Find it in the platform:
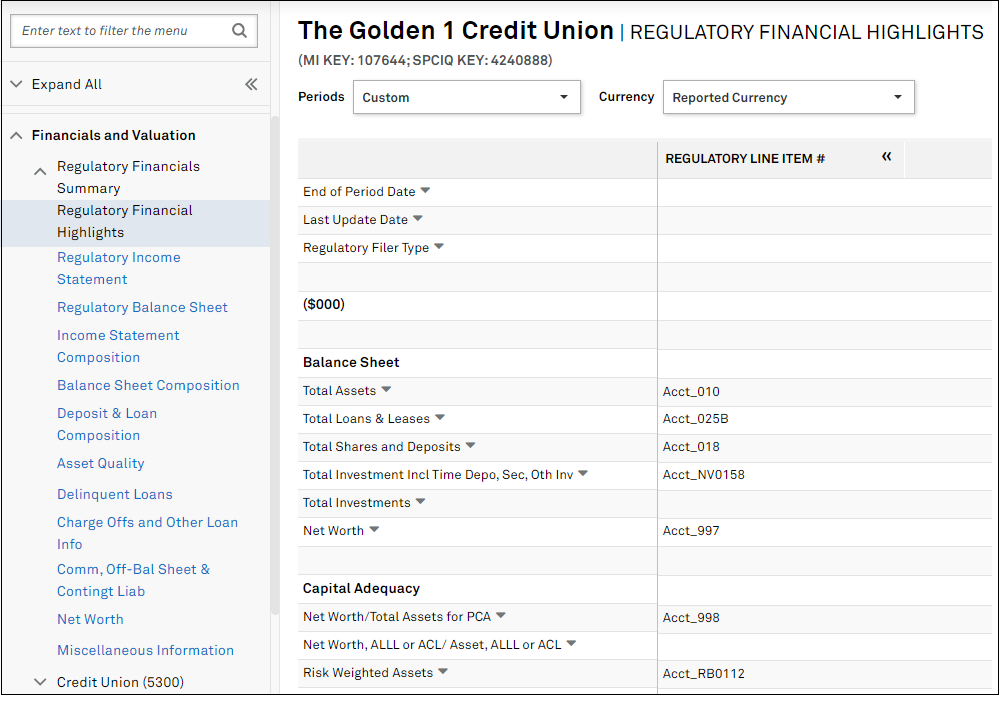
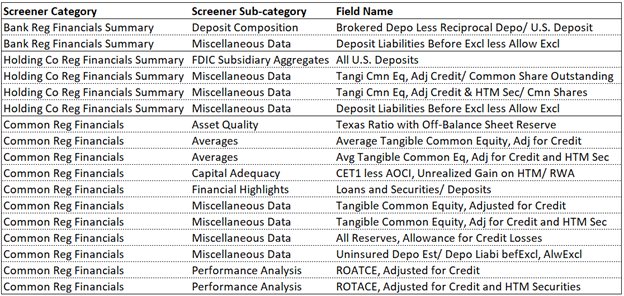
Users can now access the newly created field for Tangible Common Equity adjusted for credit and new derived ratios for Banks and Bank Holding Companies.
Find it in the platform:
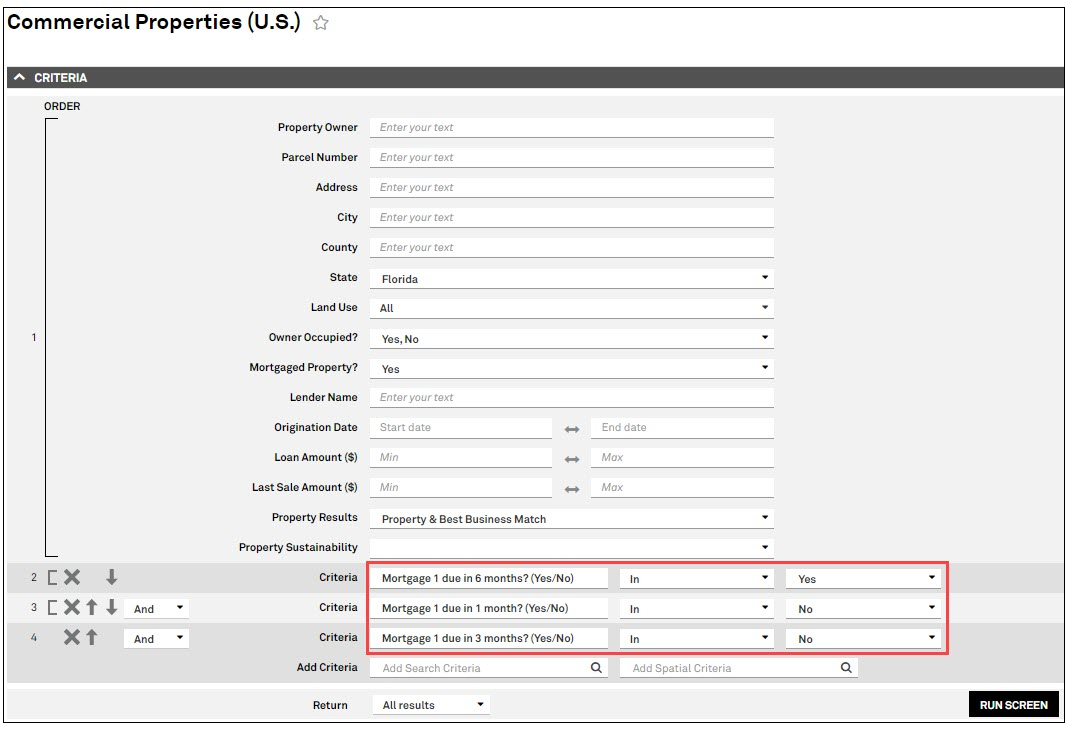
In this release, we added new metrics for Commercial Properties in Screener to improve reporting granularity and prospecting lists.
Users can now use relative maturity date fields in Commercial Properties data within Screener to pull mortgages maturing in the next 30 days, 90 days, 180 days, and 1 year, making it easier to generate and monitor prospecting lists.
Find it in the platform:
Users can now pull Sale Deed ID in the Commercial Properties data within Screener, helping them identify multiple properties under the same sale deed.
Find it in the platform:

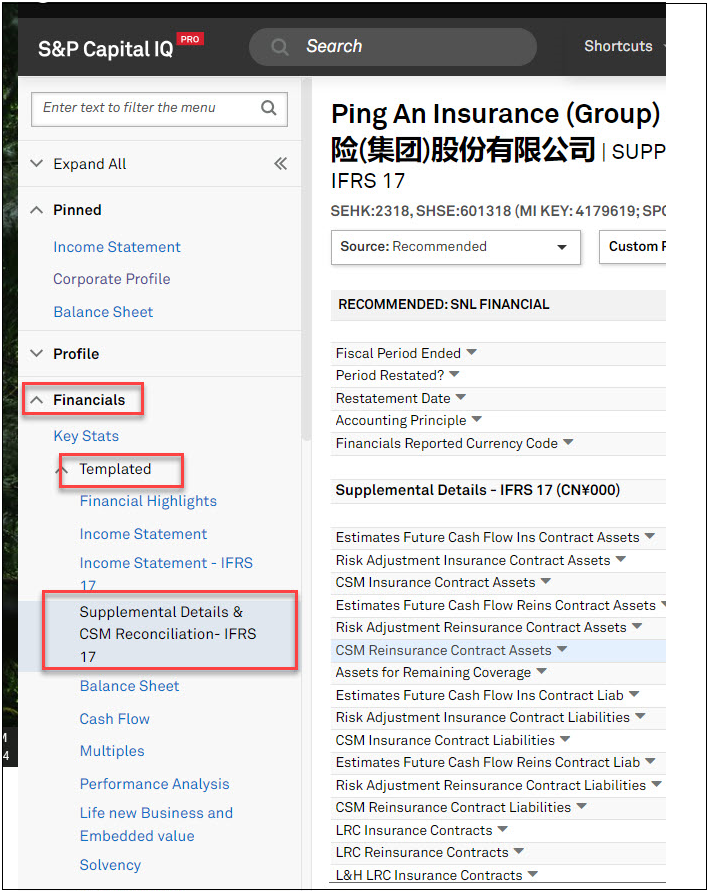
In this release, we introduced over 40 new data items pertaining to IFRS 17, the largest change in accounting standards for global insurers in over 20 years. IFRS 17 requires insurers to present the current value of their insurance contracts (vs. historic value) and recognize profit over the lifetime of the contracts (vs. immediate term). Additionally, we enhanced U.S. Insurance Statutory selection menu in Screener and the S&P Capital IQ Pro Plug-in with the addition of new folders, and updated Lines of Business (LOB) sourced from 2023 annual NAIC data. We also updated the Lines of Business (LOB) drop down in the Market Share application for Life & Fraternal industries.
Users can access over 40 new data points integrated in the platform which were previously added in the Screener. These new data points will provide key information on CSM, Risk Adjustments, and underwriting ratios for companies that adhere to IFRS 17 regulations to help users better understand the impact of insurance contracts on an insurance company’s profitability.
Find it in the platform:
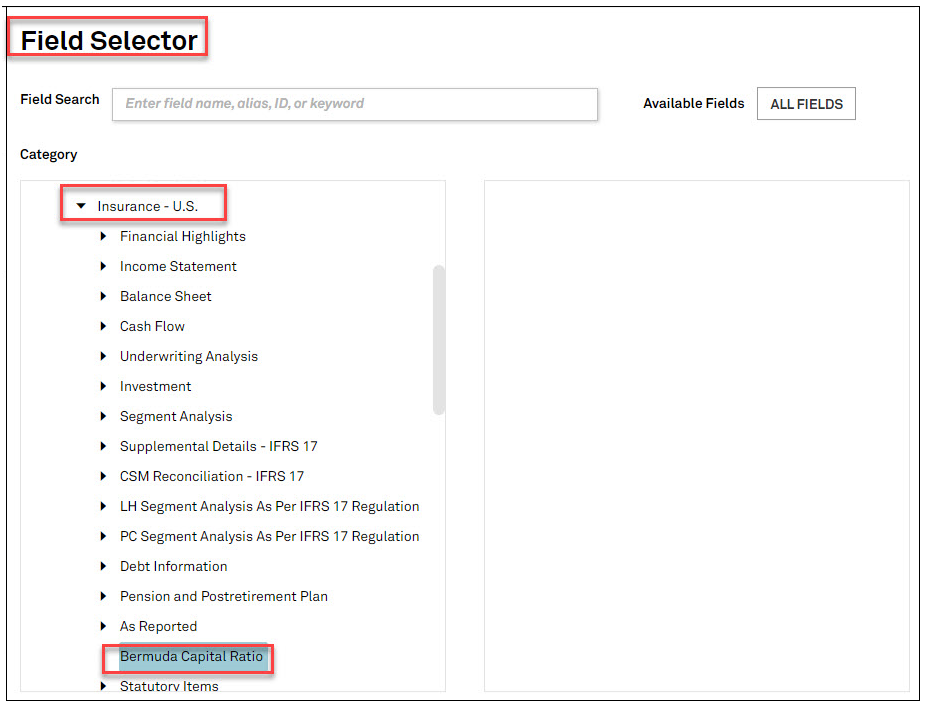
Users can access new Bermuda capital ratios for all our Bermuda insurance-covered companies in Screener.
Find it in the platform:
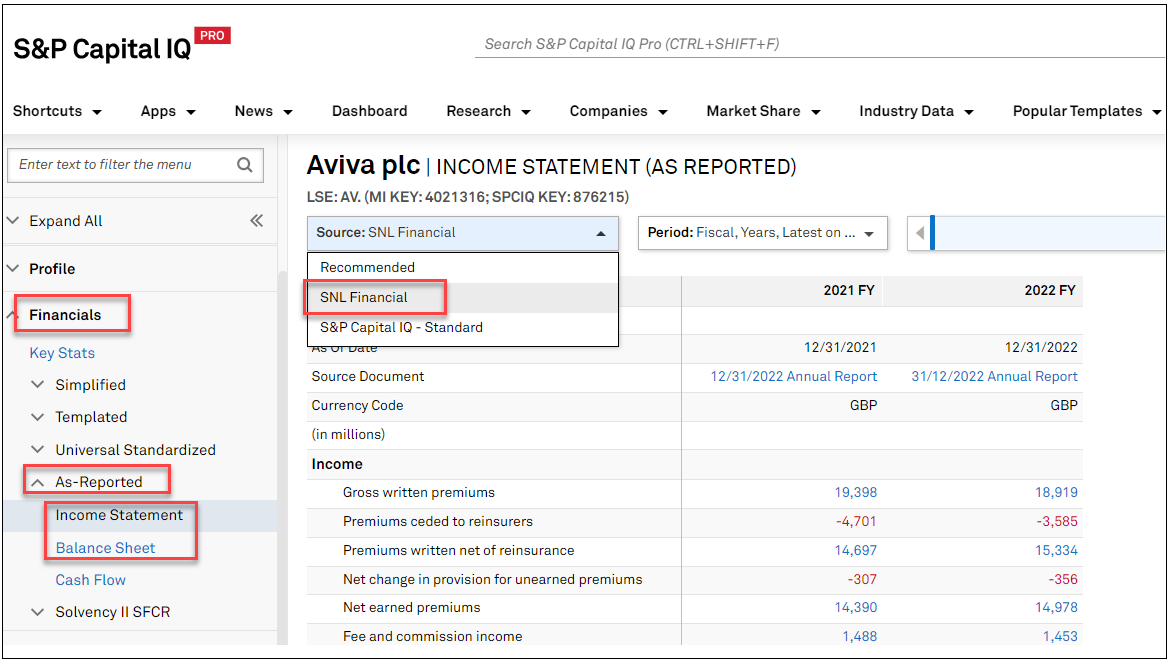
In this release, we expanded our financial data coverage for Insurance companies in EMEA by introducing two new as-reported pages Balance Sheet and Income Statement, sourced from SNL Financial. This complements our existing as-reported data sourced from Capital IQ, allowing users to gain a more comprehensive understanding of how companies report their financial statements in their filings.
Find it in the platform:
Coverage stats:
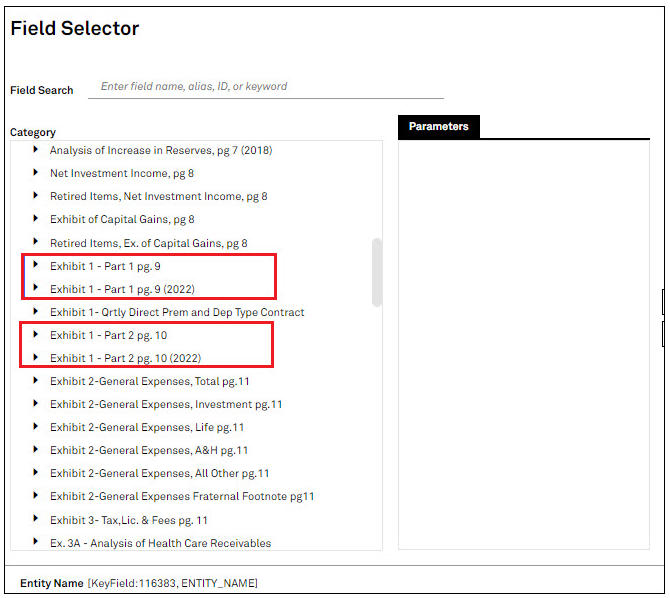
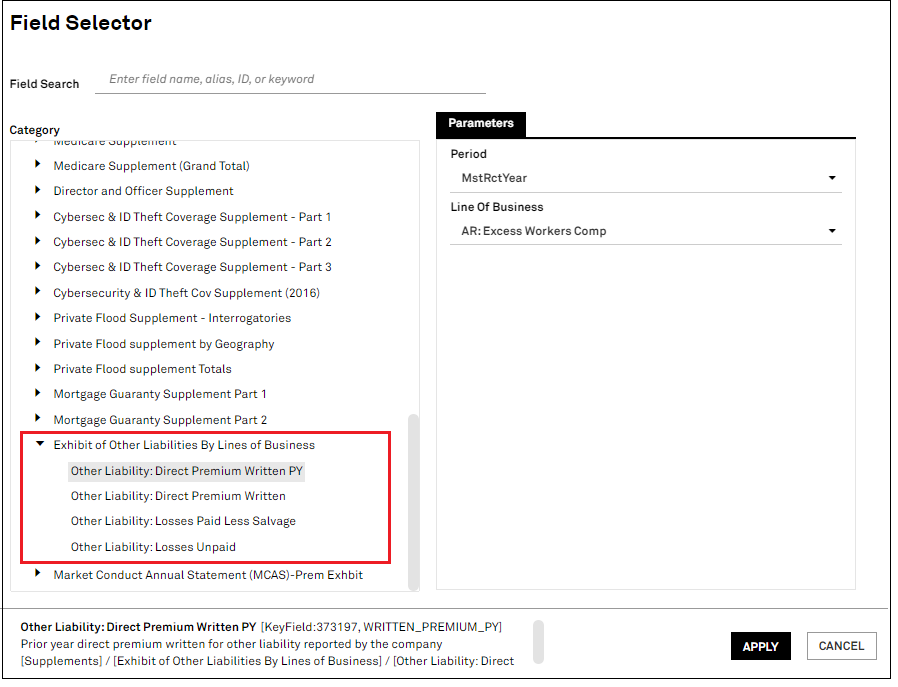
Screener is enhanced to enable users to easily access and compare information from multiple exhibits across different Life & Fraternal filings, ensuring consistent Lines of Business are used throughout. A brand-new subcategory is created and Lines of Business dropdown is updated to represent the changes made in all the exhibits as below. In addition, the Insurance Statutory Market Share application is updated with all the new Lines of Business for the Life & Fraternal industry.
Insurance Statutory Financials (US) dataset:
Find it in the platform:
Exhibit 8 Part 1 Claims Liability LAH Pg. 16, Exhibit 8 - Part 2 Claims Incurred LAH pg 17
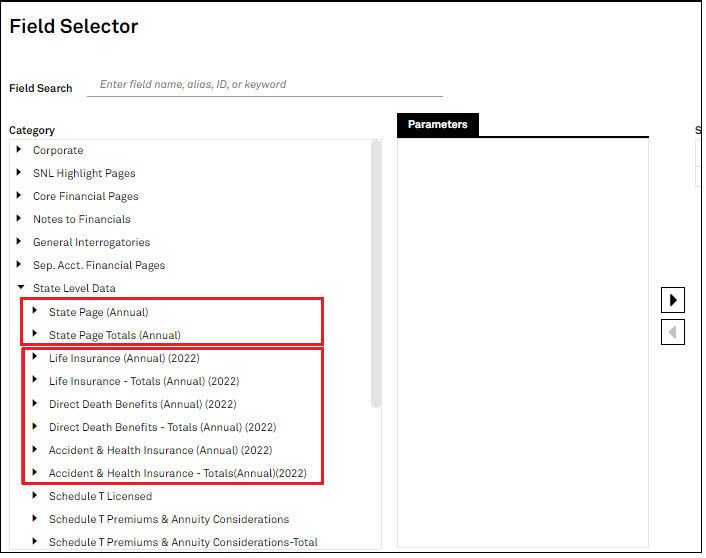
Users can view new exhibits, introduced by the NAIC, in Screener for the respective insurance filer.
Find it in the platform:
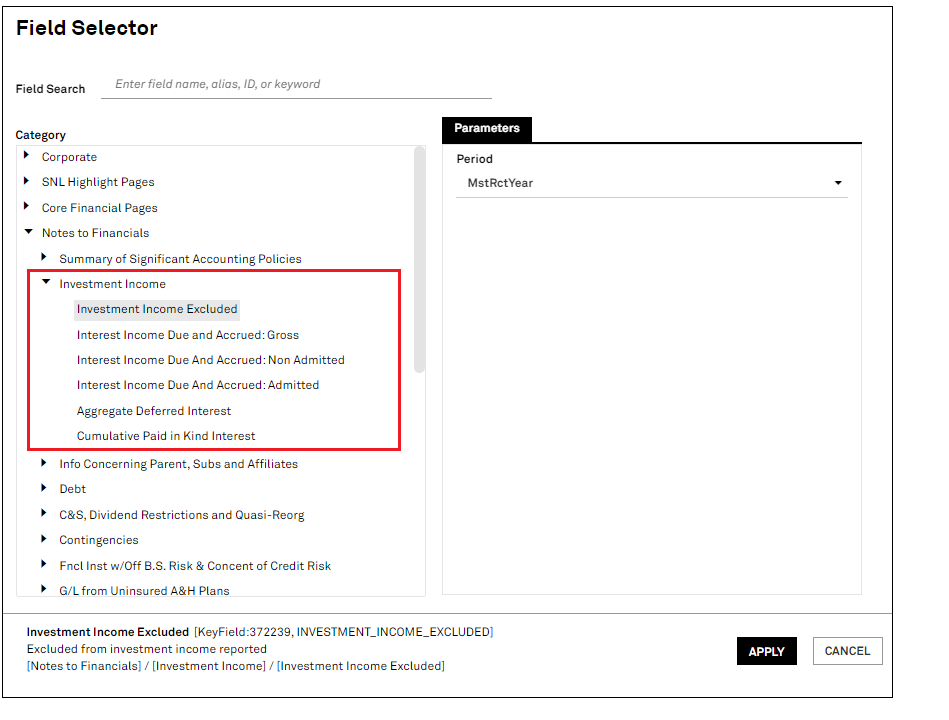
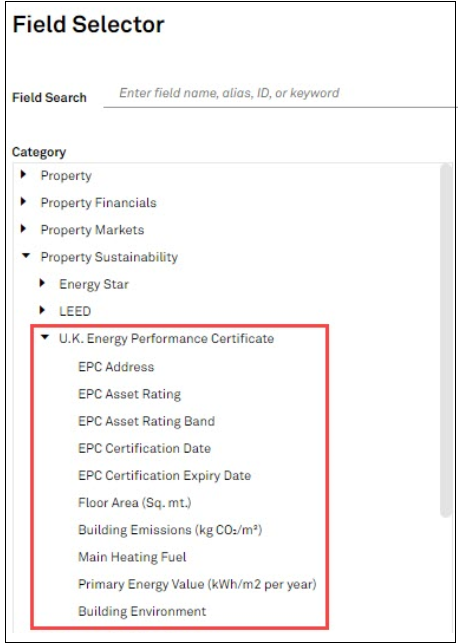
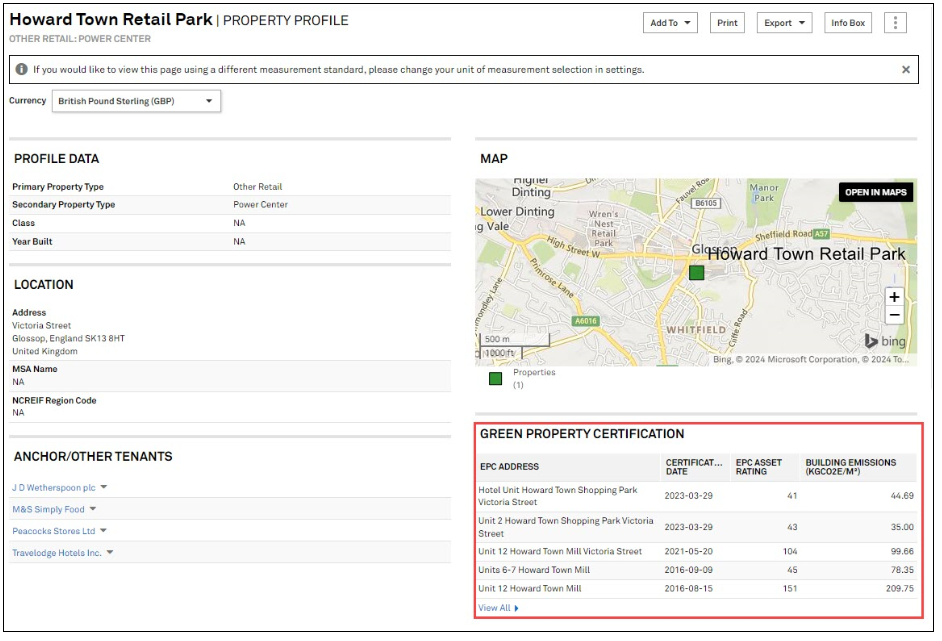
In this release, we added UK Energy Performance Certificate (EPC) data for UK-based Real Estate properties in Property Profile as well as Real Estate Properties data set in Screener.
Users can now access UK Energy Performance Certificate (EPC) data on multiple pages of the Capital IQ Pro platform, namely in Screener, Property Profile page, and Green Property Certification pages.
Find it in the platform:
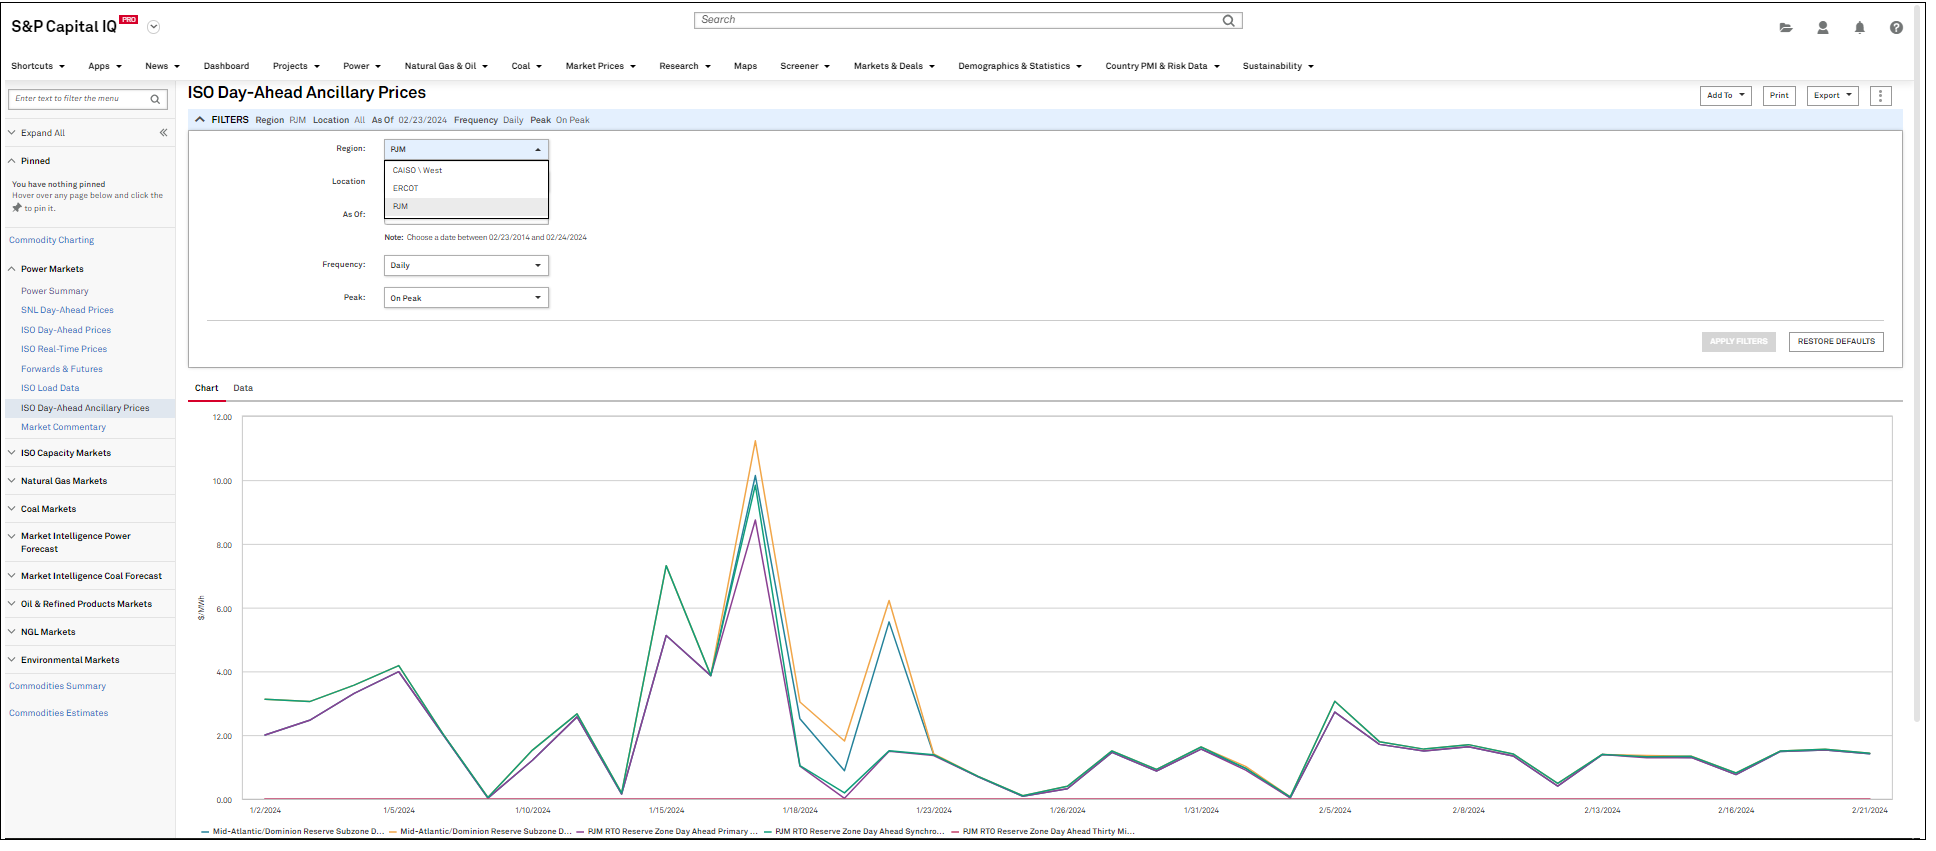
In this release, we expanded our Ancillary Pricing data coverage to include two new regions, including PJM (Pennsylvania-New Jersey-Maryland Interconnection) and ERCOT (Electric Reliability Council of Texas), and enhanced our Global Power Markets Summary page with the addition of three new portlets. Additionally, we enhanced the overall usability of the Upstream Oil & Gas pages, with updates to the International Field Ownership page and the company-level pages.
Users can access Ancillary Pricing data for ISO regions throughout the United States, including the PJM and ERCOT regions.
Find it in the platform:
Coverage stats:
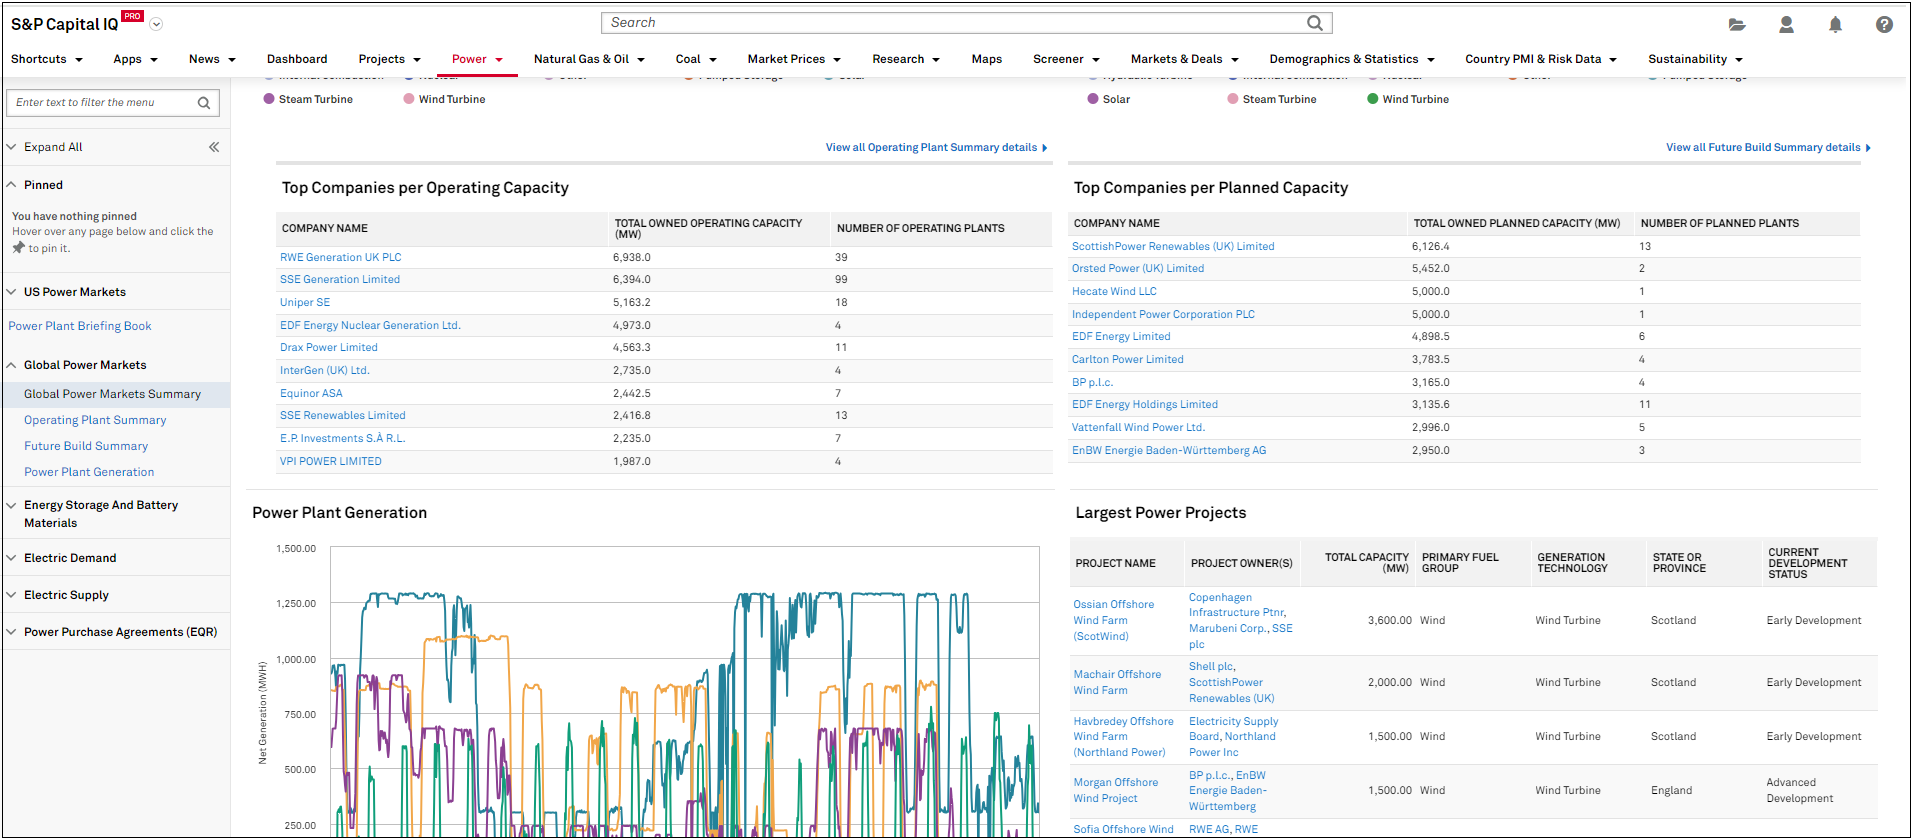
Users can view three new portlets added to the Global Power Market Summary page that will help improve the overall usability of the page. This includes portlets that highlight Largest Projects, Largest Companies per Operating Capacity, and Largest Companies per Planned Capacity, for the country selected.
Find it in the platform:
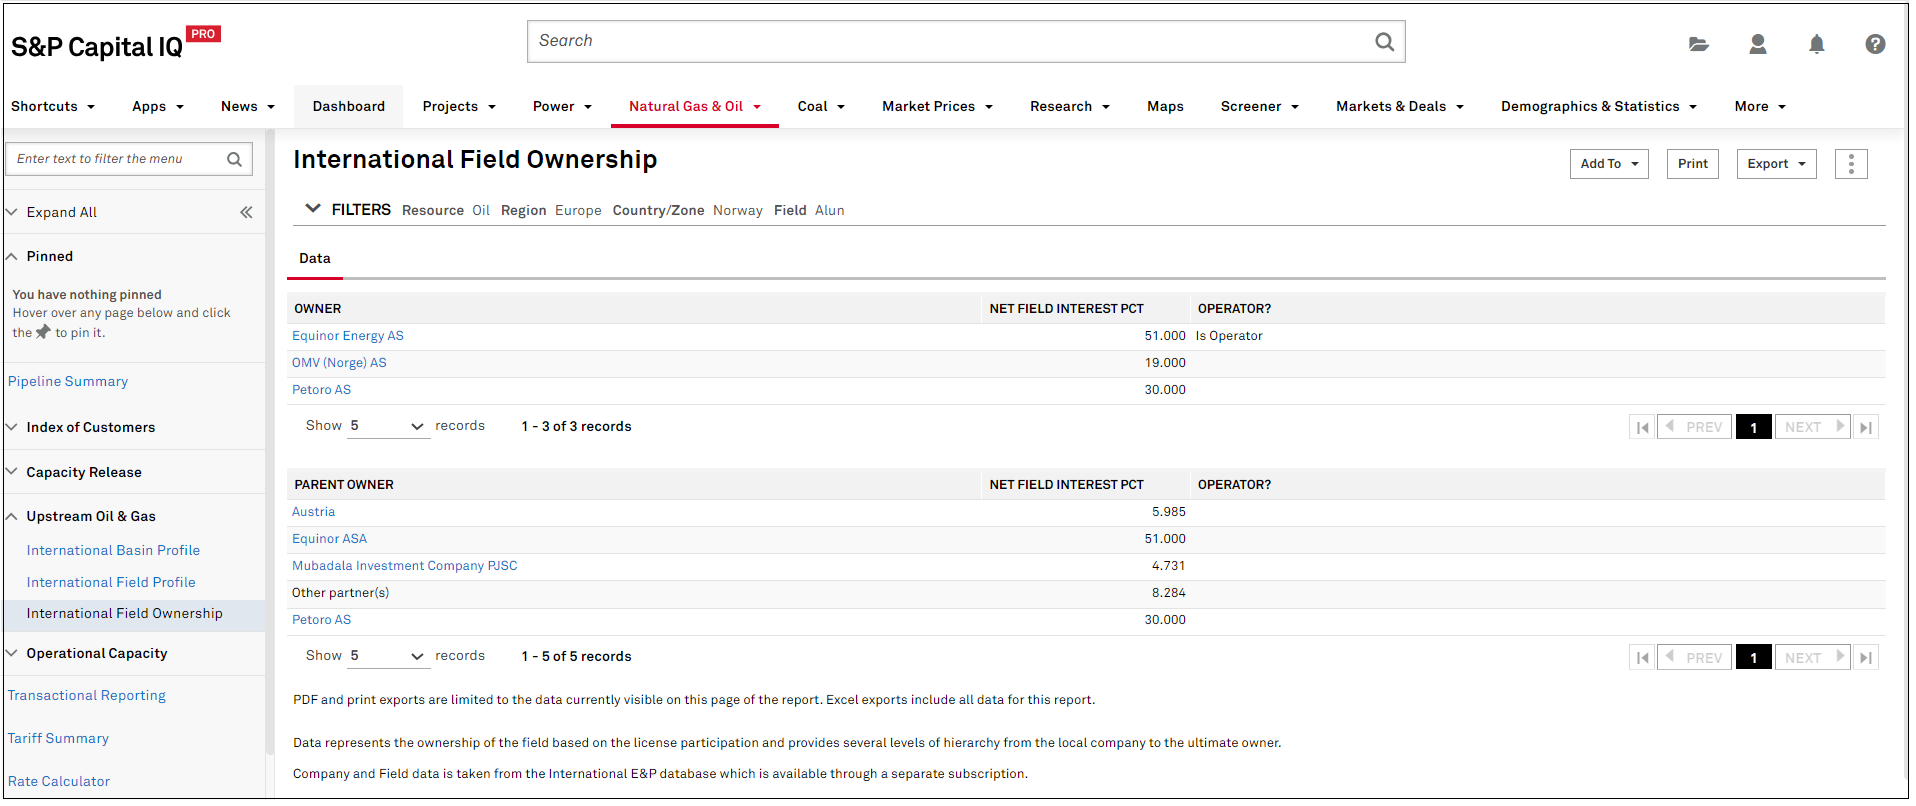
Users can access enhanced usability in Upstream International Oil & Gas pages, including the refined International Field Ownership page and enhanced company-level Production & Reserves page with a more intuitive ownership breakdown per owner and parent owner, along with additional Group By options for flexible data viewing.
Find it in the platform:
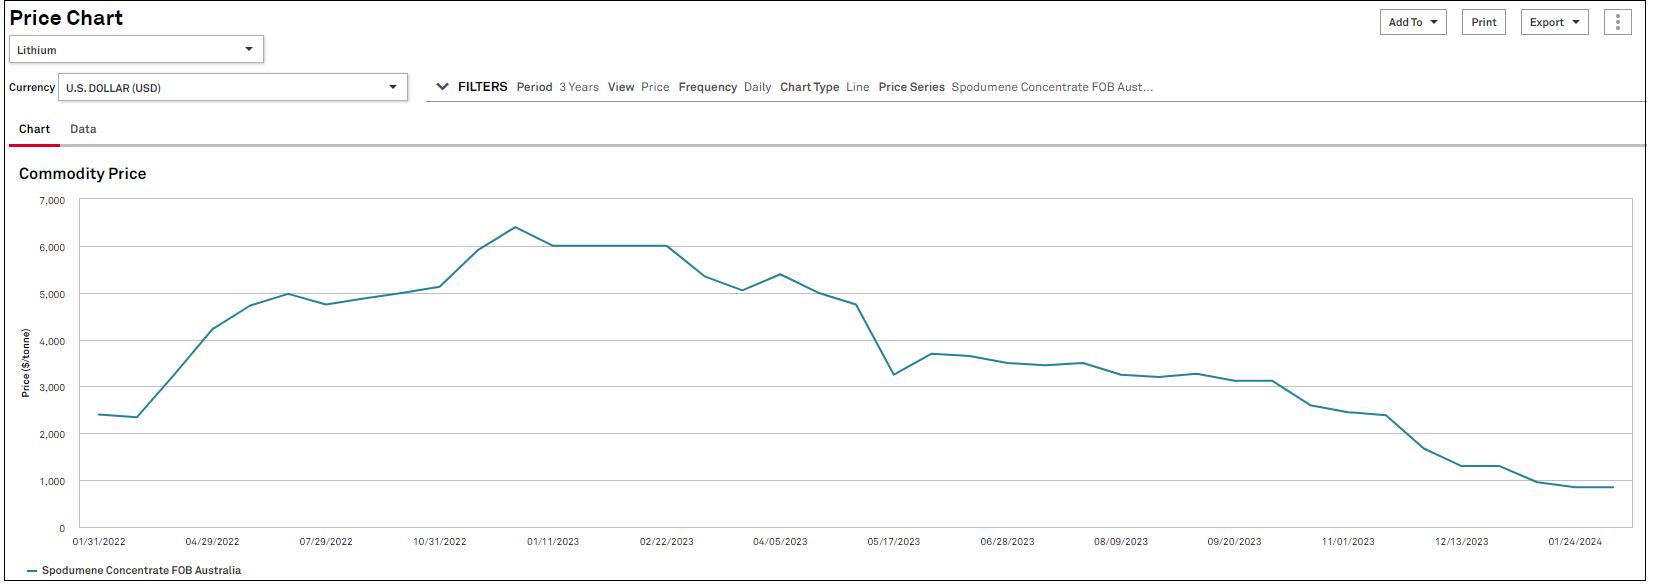
In this release, we added a new price series for Lithium in the commodity price chart. In addition, we added Appendix 5B Cash Flow and Reserves & Resources ratios in Companies Screener and S&P Capital IQ Pro plug-in, along with the newly launched Annual Mine Production Summary in Excel Template Library.
Users can access a new series for Lithium Spodumene Concentrate FOB Australia historical prices in commodity price chart. The prices are sourced from benchmark minerals dating back to January 2022 and available monthly with a mid-month and end-of-month price.
Find it in the platform:
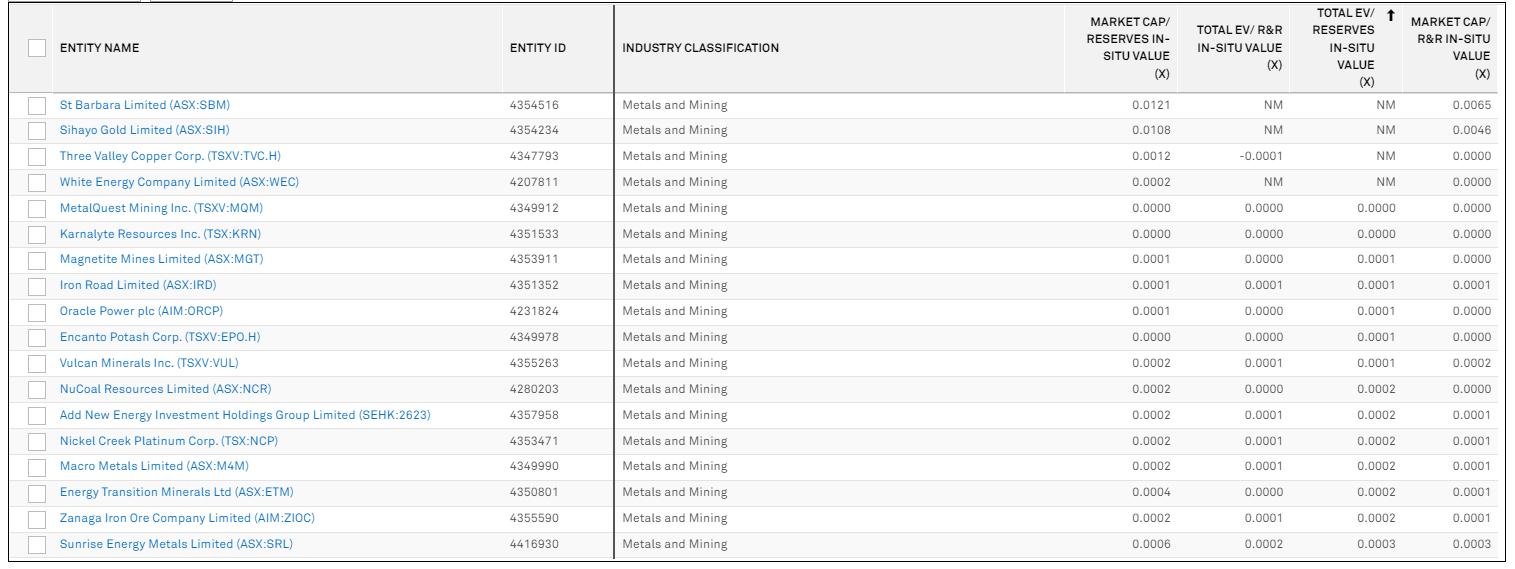
Users can access Appendix 5B Cash Flow financials and Reserves & Resources ratios of Mining companies in Companies Screener and S&P Capital IQ Pro Plug-in. The addition of these industry metrics will localize the user's workflow in a single dataset within Screener and help with the understanding of the granularity of mining companies’ financial performance.
Find it in the platform:

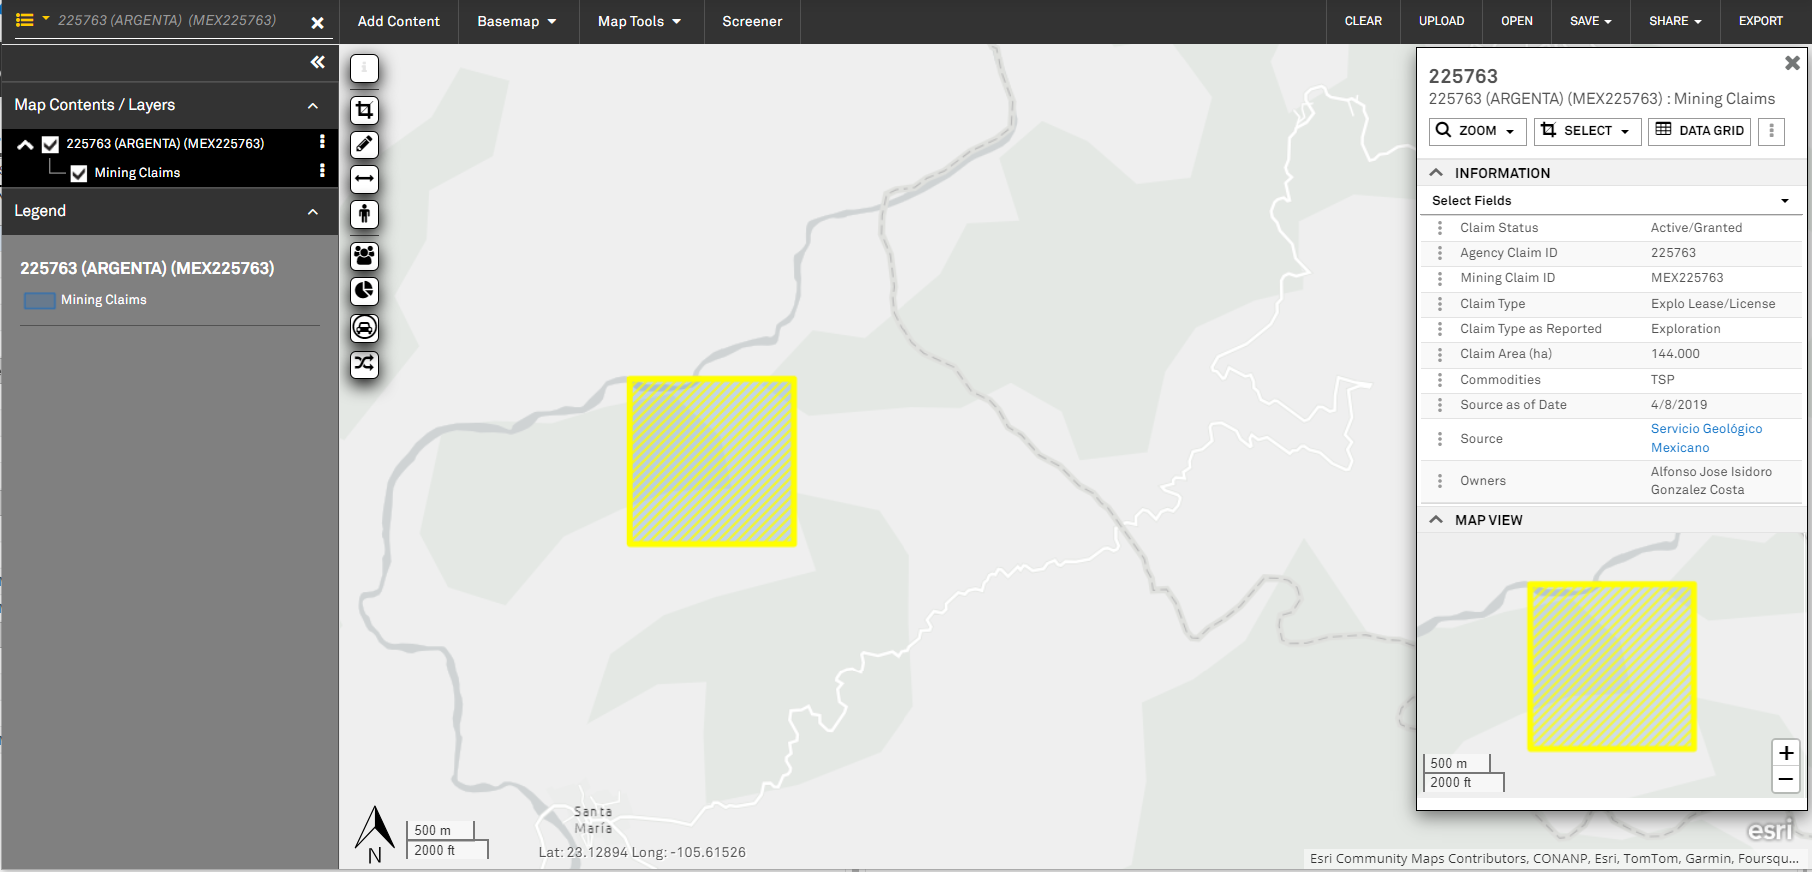
Users can view mining claims in maps by searching with Mining Claim or Agency Claim ID.
Find it in the platform:
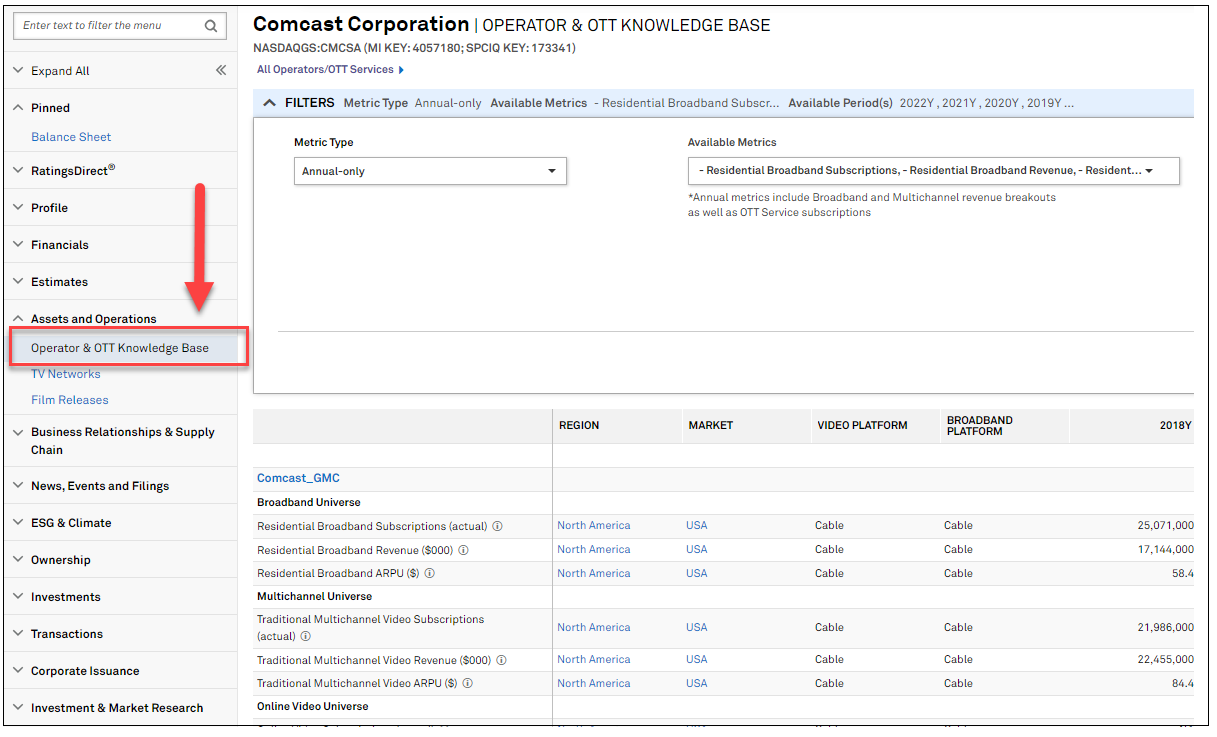
In this release, we added two new pages on the Corporate Profile page to provide a comprehensive and centralized view of a company's asset and operations portfolio. In addition, we enhanced the Broadband and Video dataset by integrating 28 distinct groups of demographic data.
Users can access S&P Global's proprietary MediaCensus dataset and operator level Broadband, Mobile, Traditional Video and Online Video datasets under the Assets and Operations section of a company's Corporate Profile page.
Find it in the platform:
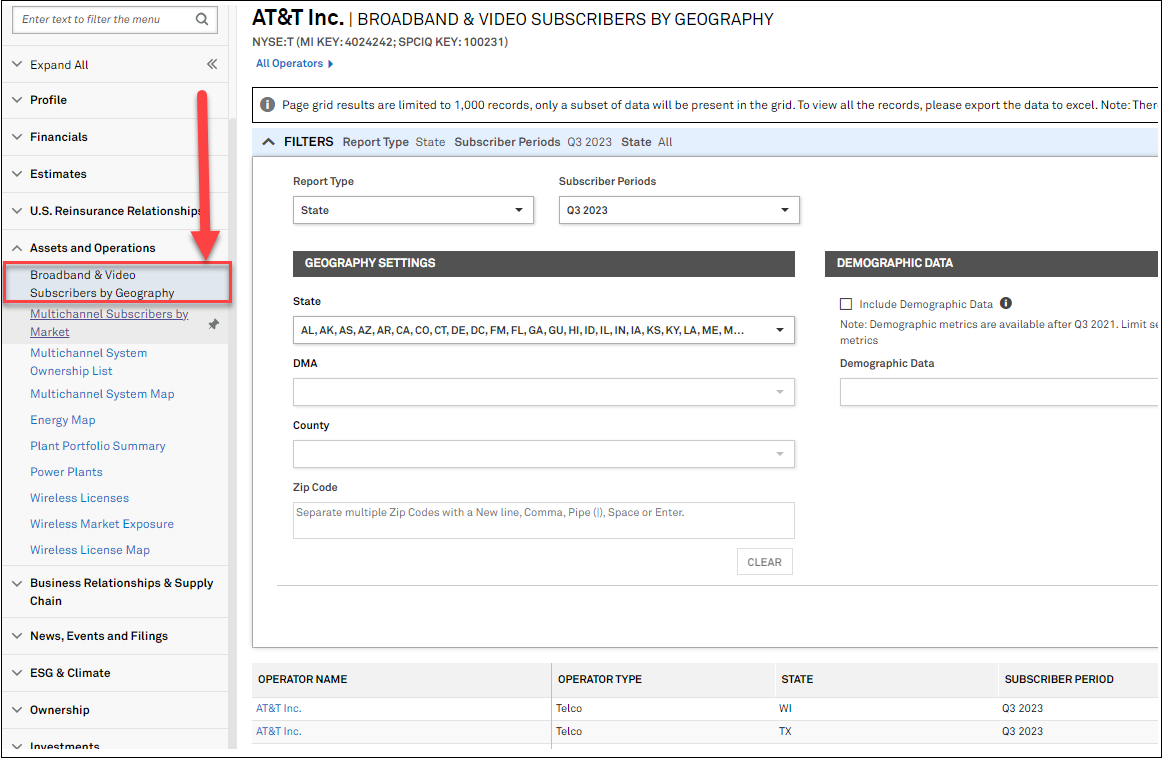
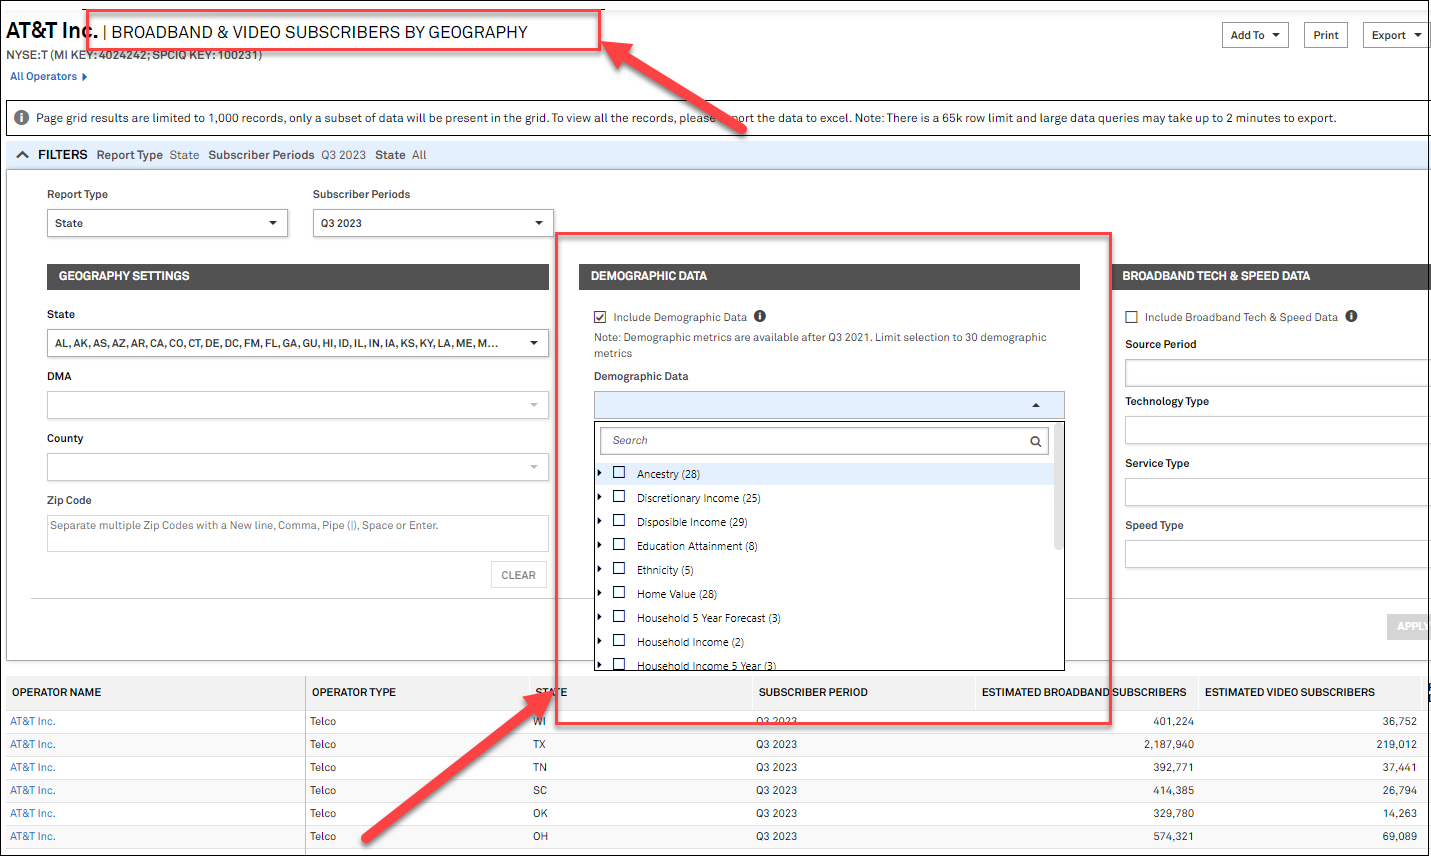
Users can now overlay 28 categories of demographic data onto S&P Global’s proprietary MediaCensus Broadband and Video subscriber dataset, for a comprehensive understanding of demographic trends and patterns. MediaCensus data is accessible across multiple geographic levels, including Zip code, County, and DMA, encompassing 41,000 geographies and 1,200 operators.
Find it in the platform:
In this release, we rebranded Dashboard charting widgets, enhanced few ChartIQ widget functionalities and made workflow changes on the Dashboard.
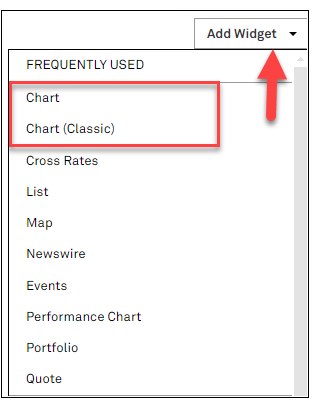
Users will now see refreshed names on the Dashboard charting widgets, ChartIQ widget is renamed as Chart accompanied by functional enhancements and the legacy Chart widget is renamed as Chart (Classic).
Find it in the platform:
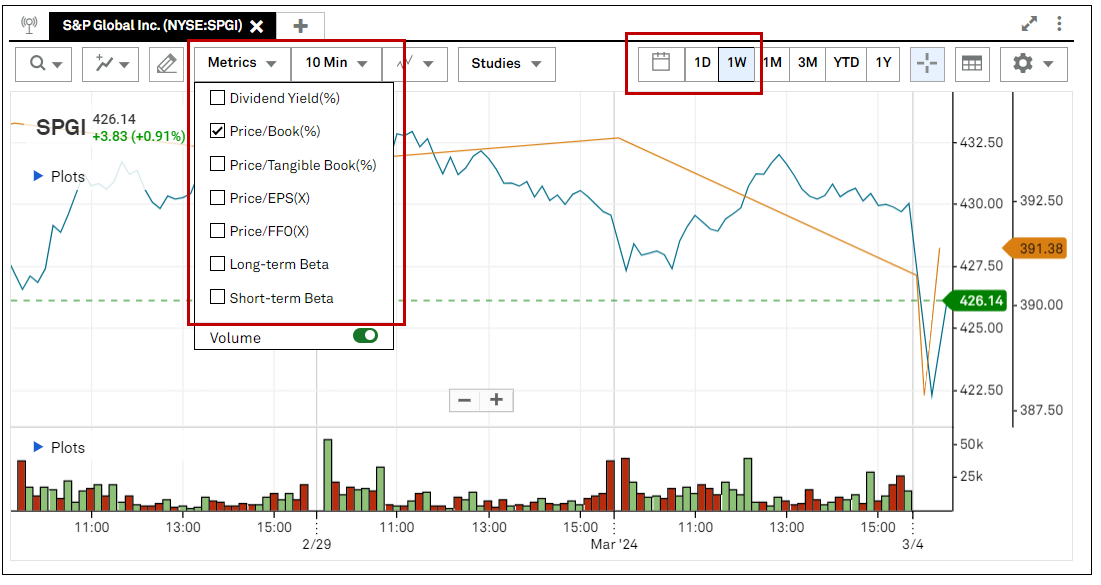
Users can pull data from the end-of-day service when the selected secondary metric on the Chart Widget (previously known as ChartIQ) does not have Intraday data for the selected timeframe from the recent 30 days.
Find it in the platform:
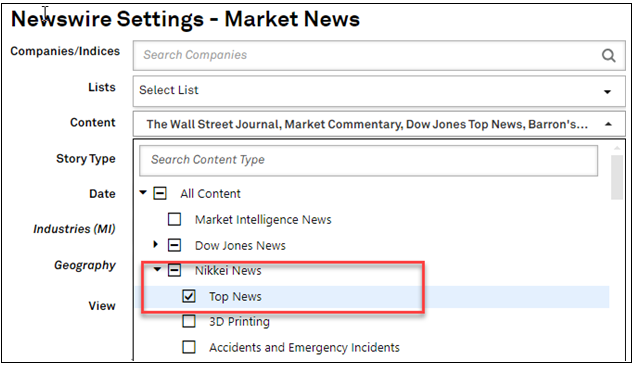
Users can now find an additional content sub-type named Top News in the Nikkei news content dropdown. Additionally, the default selection on the Newswire widget is updated with Nikkei News on a newly added widget on the Dashboard.
Find it in the platform:
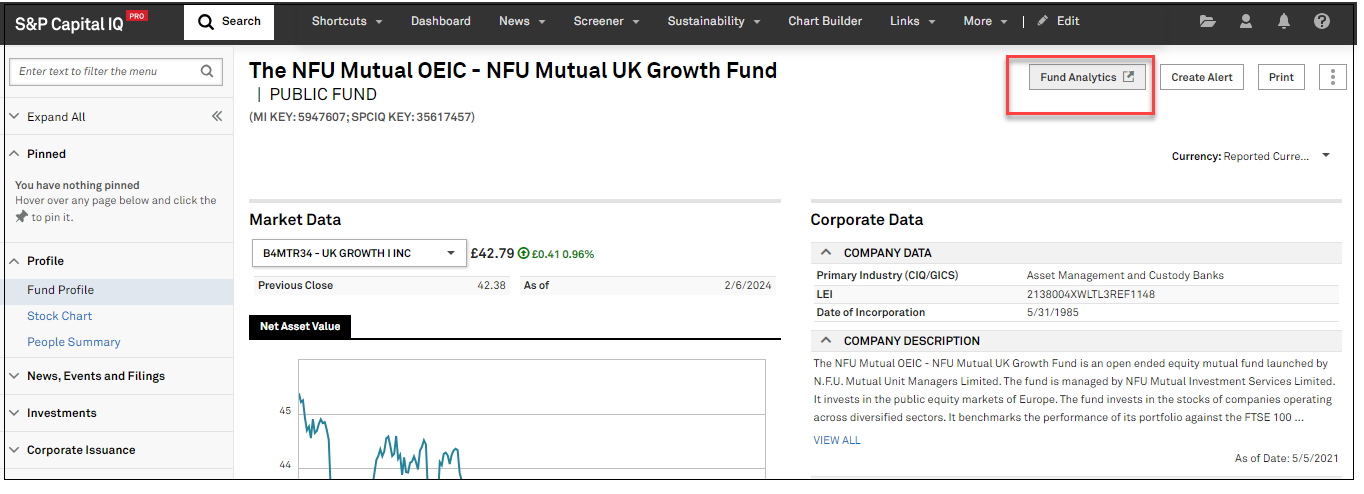
In this release, we added a link to Fund Analytics on the Fund profile page for easy access to public fund performance.
Users can now more easily navigate to Portfolio Analytics’ Fund Analytics report page with the new link from Fund profile page.
Find it in the platform:
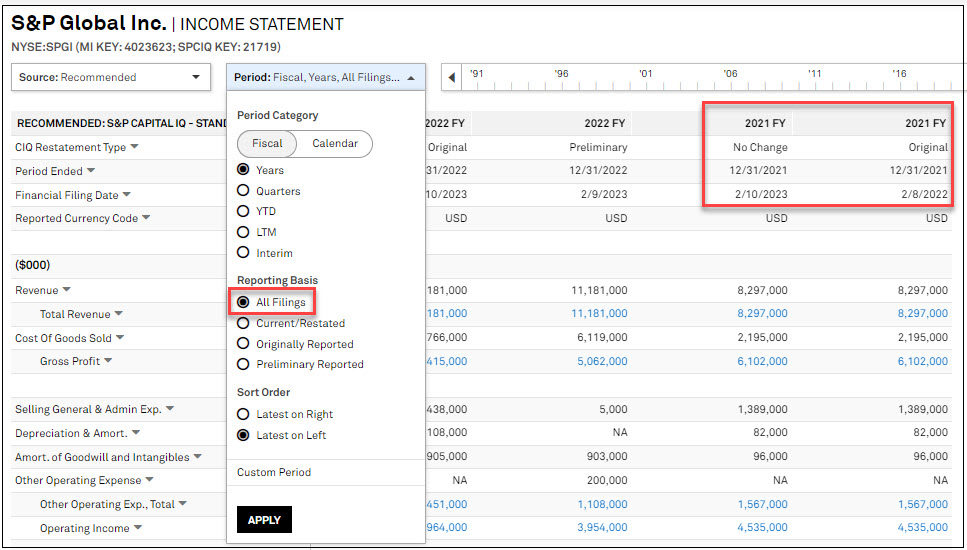
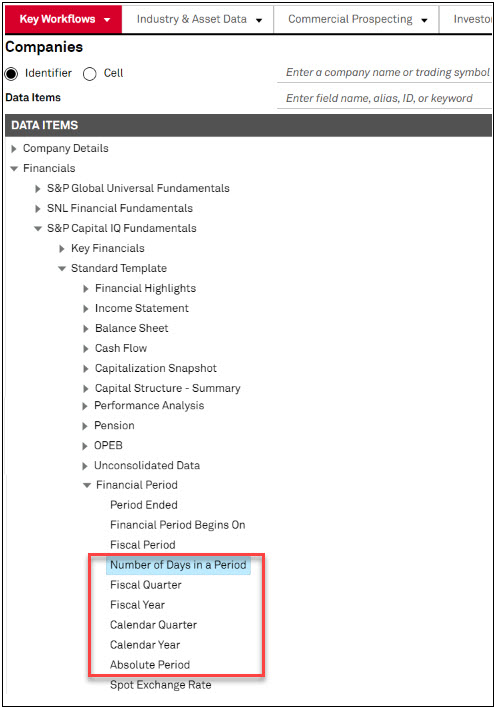
In this release, we added All Filings view option for reporting basis on the Templated Financials pages for ease of data comparison. We also inserted CIQ absolute date functions in the S&P Capital IQ Pro plug-in to aid in model building and placed a link to the S&P Capital IQ Financials Glossary in the Apps menu for ease of discoverability.
Users now can see all the reporting basis types for each period end on the Templated Financials pages for the S&P Capital IQ sourced financials.
Find it in the platform:
Users can now utilize the CIQ Absolute Date functions in the S&P Capital IQ Pro plug-in.
Find it in the platform:
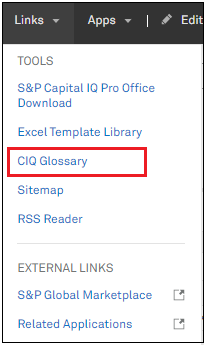
Users can access S&P Capital IQ financials glossary from an additional location in the Apps menu which provides extended definitions for Capital IQ sourced financial data items.
Find it in the platform:
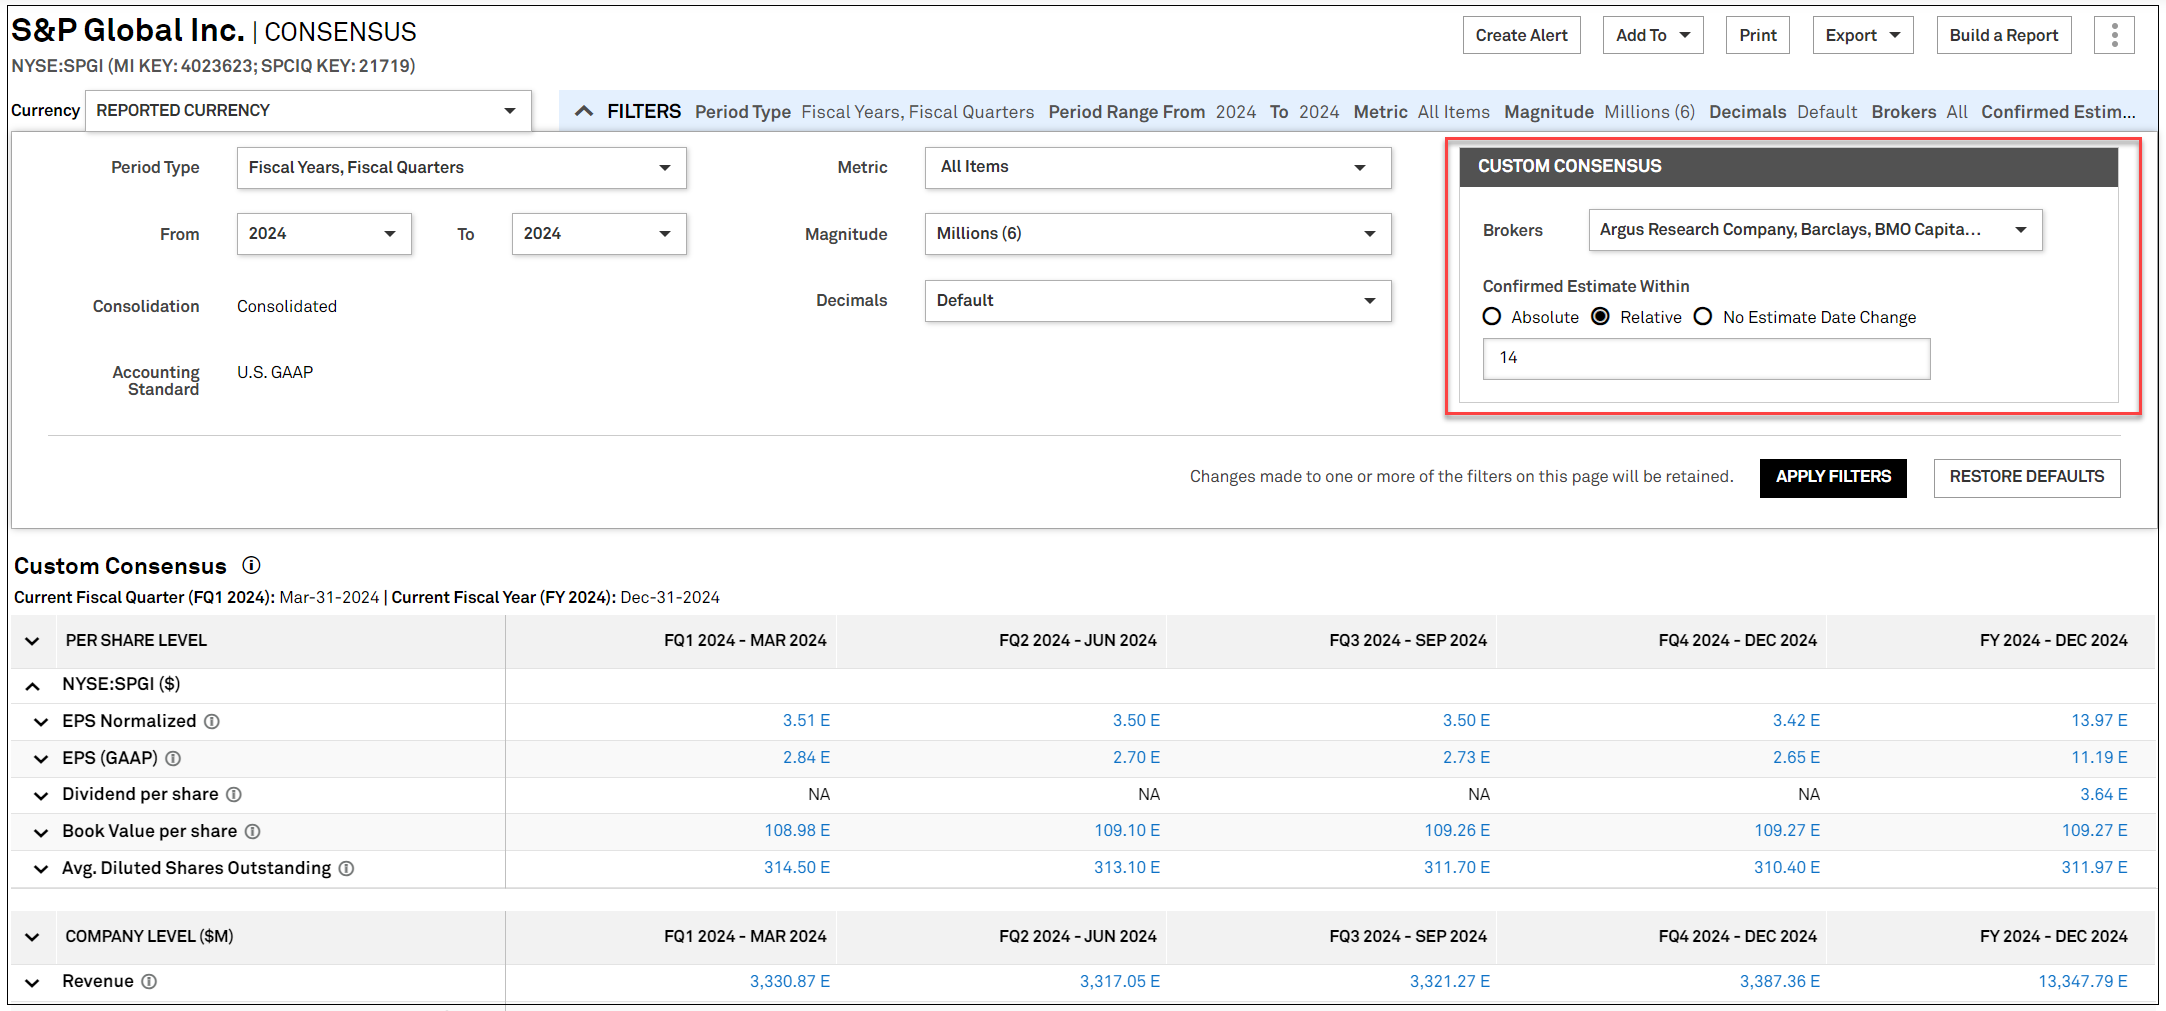
In this release, we added the ability to create a custom consensus, enhanced click-through for detailed estimates, and added detailed estimates for commodity price targets in S&P Capital IQ Pro plug-in.
Users can refine the consensus calculations on the Consensus page by applying a custom date window or by removing specific brokers. For example, users can view a custom consensus that excludes revisions older than a specific date or number of days.
Find it in the platform:
Users can now access investment research where the detailed estimates are sourced through a direct click-through capability from the metric to the underlying components in the research document.
Find it in the platform:
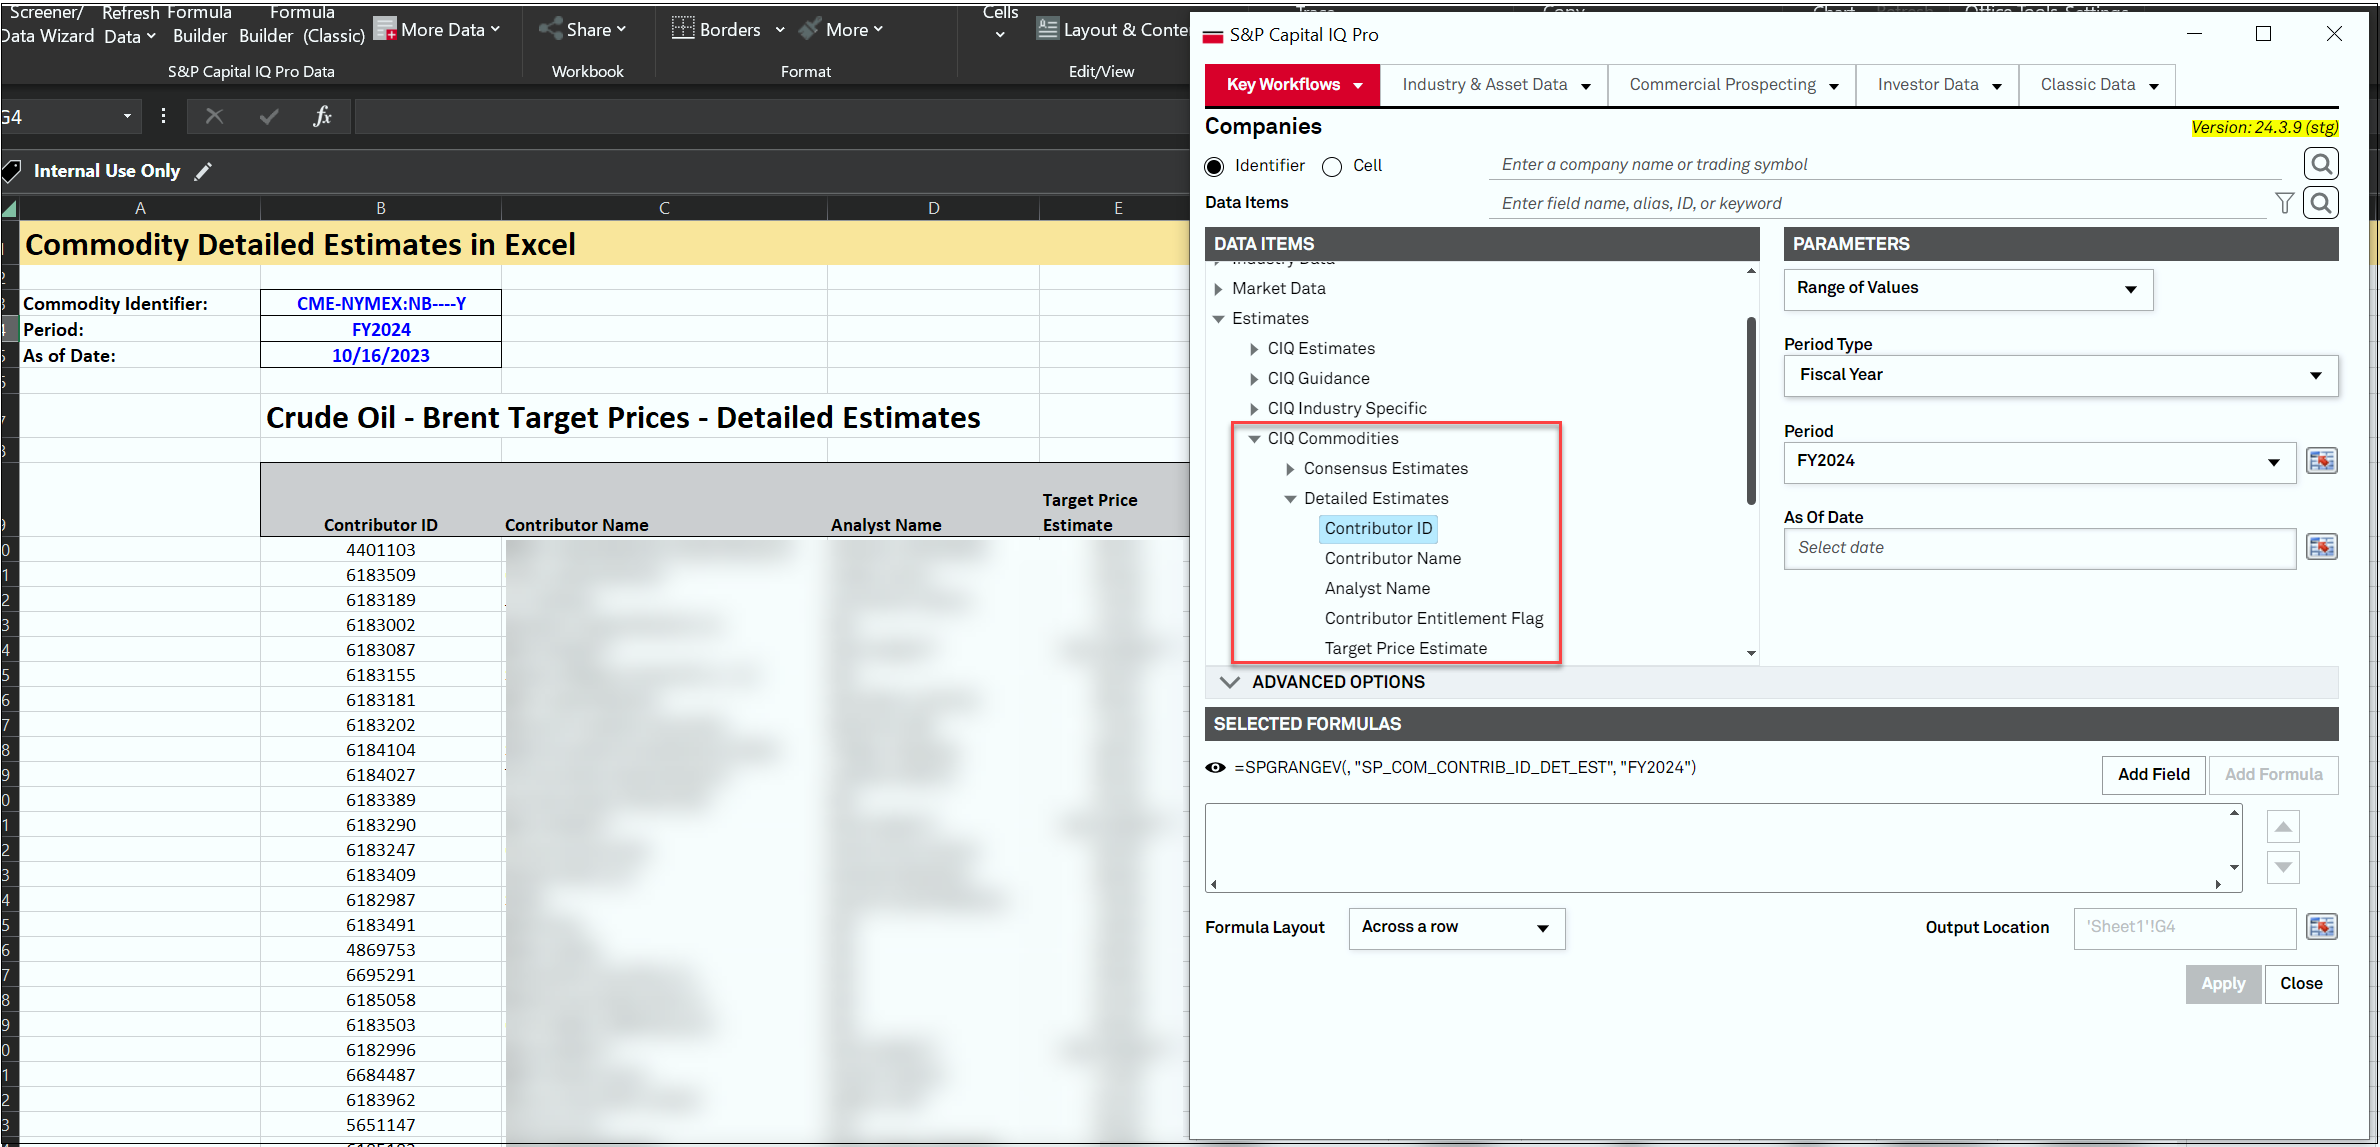
Users can pull the individual contributor price target estimates for commodities in S&P Capital IQ Pro plug-in, along with the broker and analyst names, to enhance their models with more granular data and to highlight specific contributor estimates.
Find it in the platform:
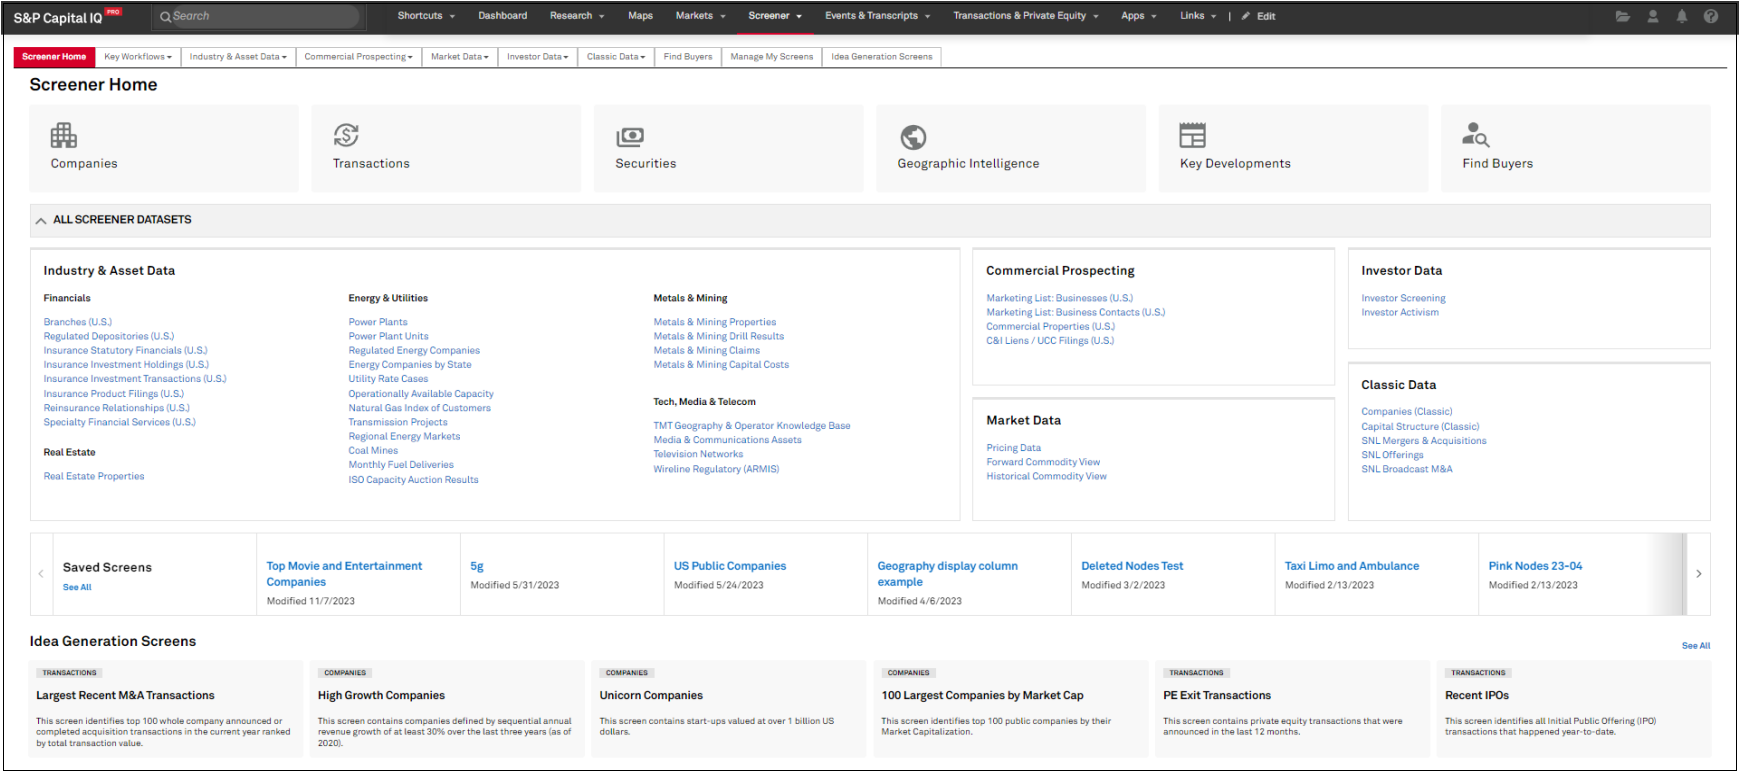
In this release, we enhanced the Screener experience with the introduction of a new Screener Home and Screener Menu. Screener Home, previously titled Screening & Analytics, is reorganized to promote key workflow datasets, while improving the discoverability of other unique Screener datasets. The new Screener menu presents users with the datasets that best align to their preferred industries.
In Screener Home, users can explore the complete list of Screener datasets, quickly reopen their recently saved or modified screens, and browse a selection of popular Idea Generation screens.
Find it in the platform:
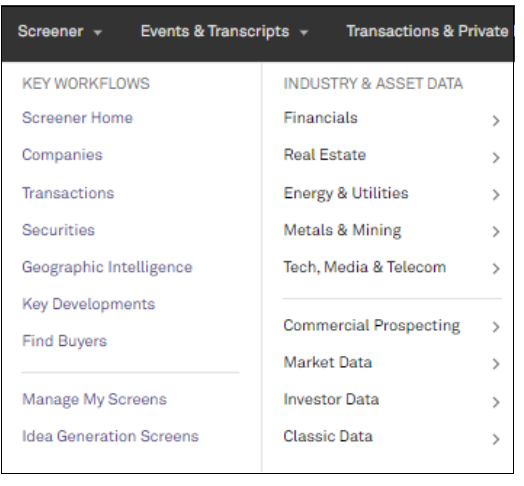
Users can now view a new Screener Menu featuring datasets that best align to their preferred industries.
Find it in the platform:
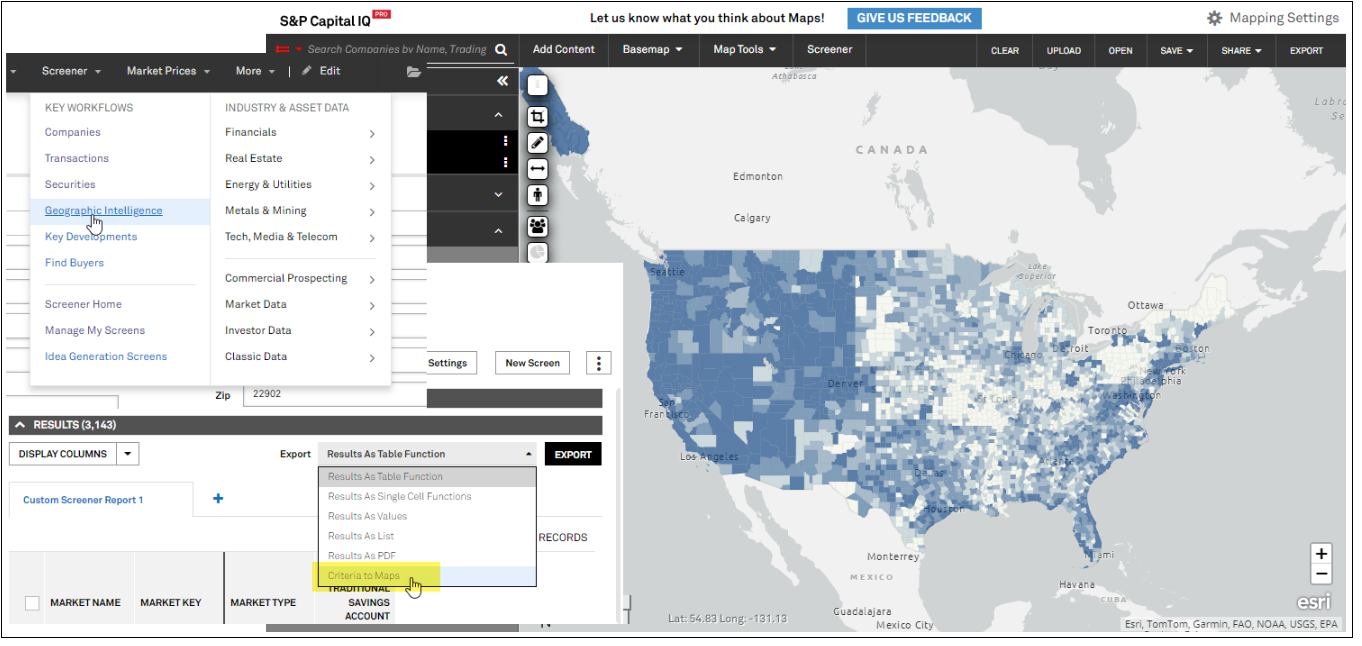
In this release, we added the ability to Map results from the Geographic Intelligence dataset in Screener to enable visualization of the comprehensive collection of demographics, financial product demand, macroeconomic data and more, from Screener to Maps.
Users can visualize and create thematic presentations of Countries, US States, Counties, Zip Codes, Cities, and more from the Screener Geographic Intelligence dataset in Maps.
Find it in the platform:
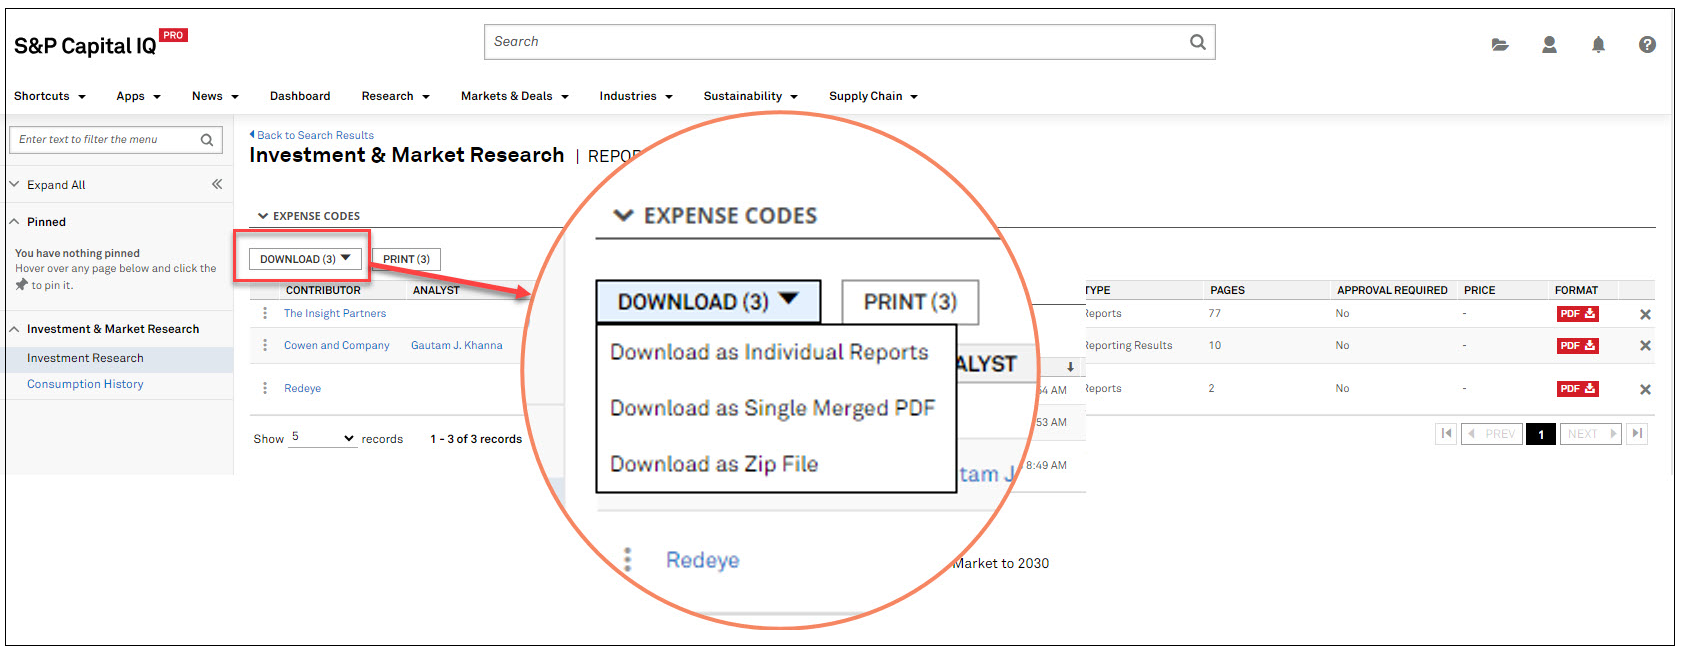
In this release, we enhanced the Report Preview page workflow by integrating the download and print action buttons within the grid, streamlining access to research reports. This update aligns with the improved design of our Research page, ensuring that download and print options are prominently visible and easily actionable for users.
Users can download and print Investment Research reports directly from the Report Preview page using action buttons located above the search grid, enhancing the overall user experience.
Find it in the platform:
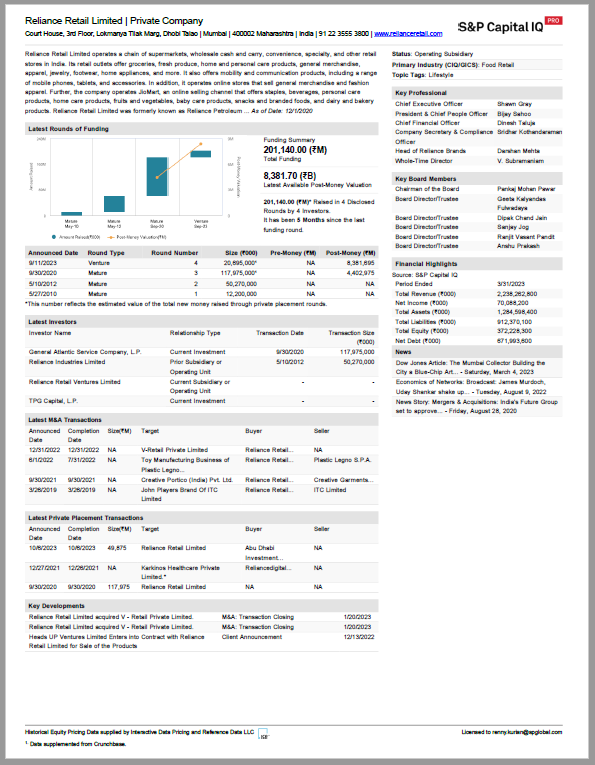
In this release, we revamped the Quick Report feature for private companies by making it a concise one-page report with a fresh layout, incorporating key data that is relevant to private companies.
The new Quick Report for private companies incorporates a more visual format while maintaining the balance of having key company information such as the latest rounds of funding, top investors, transactions, financial highlights, and more.
Find it in the platform:
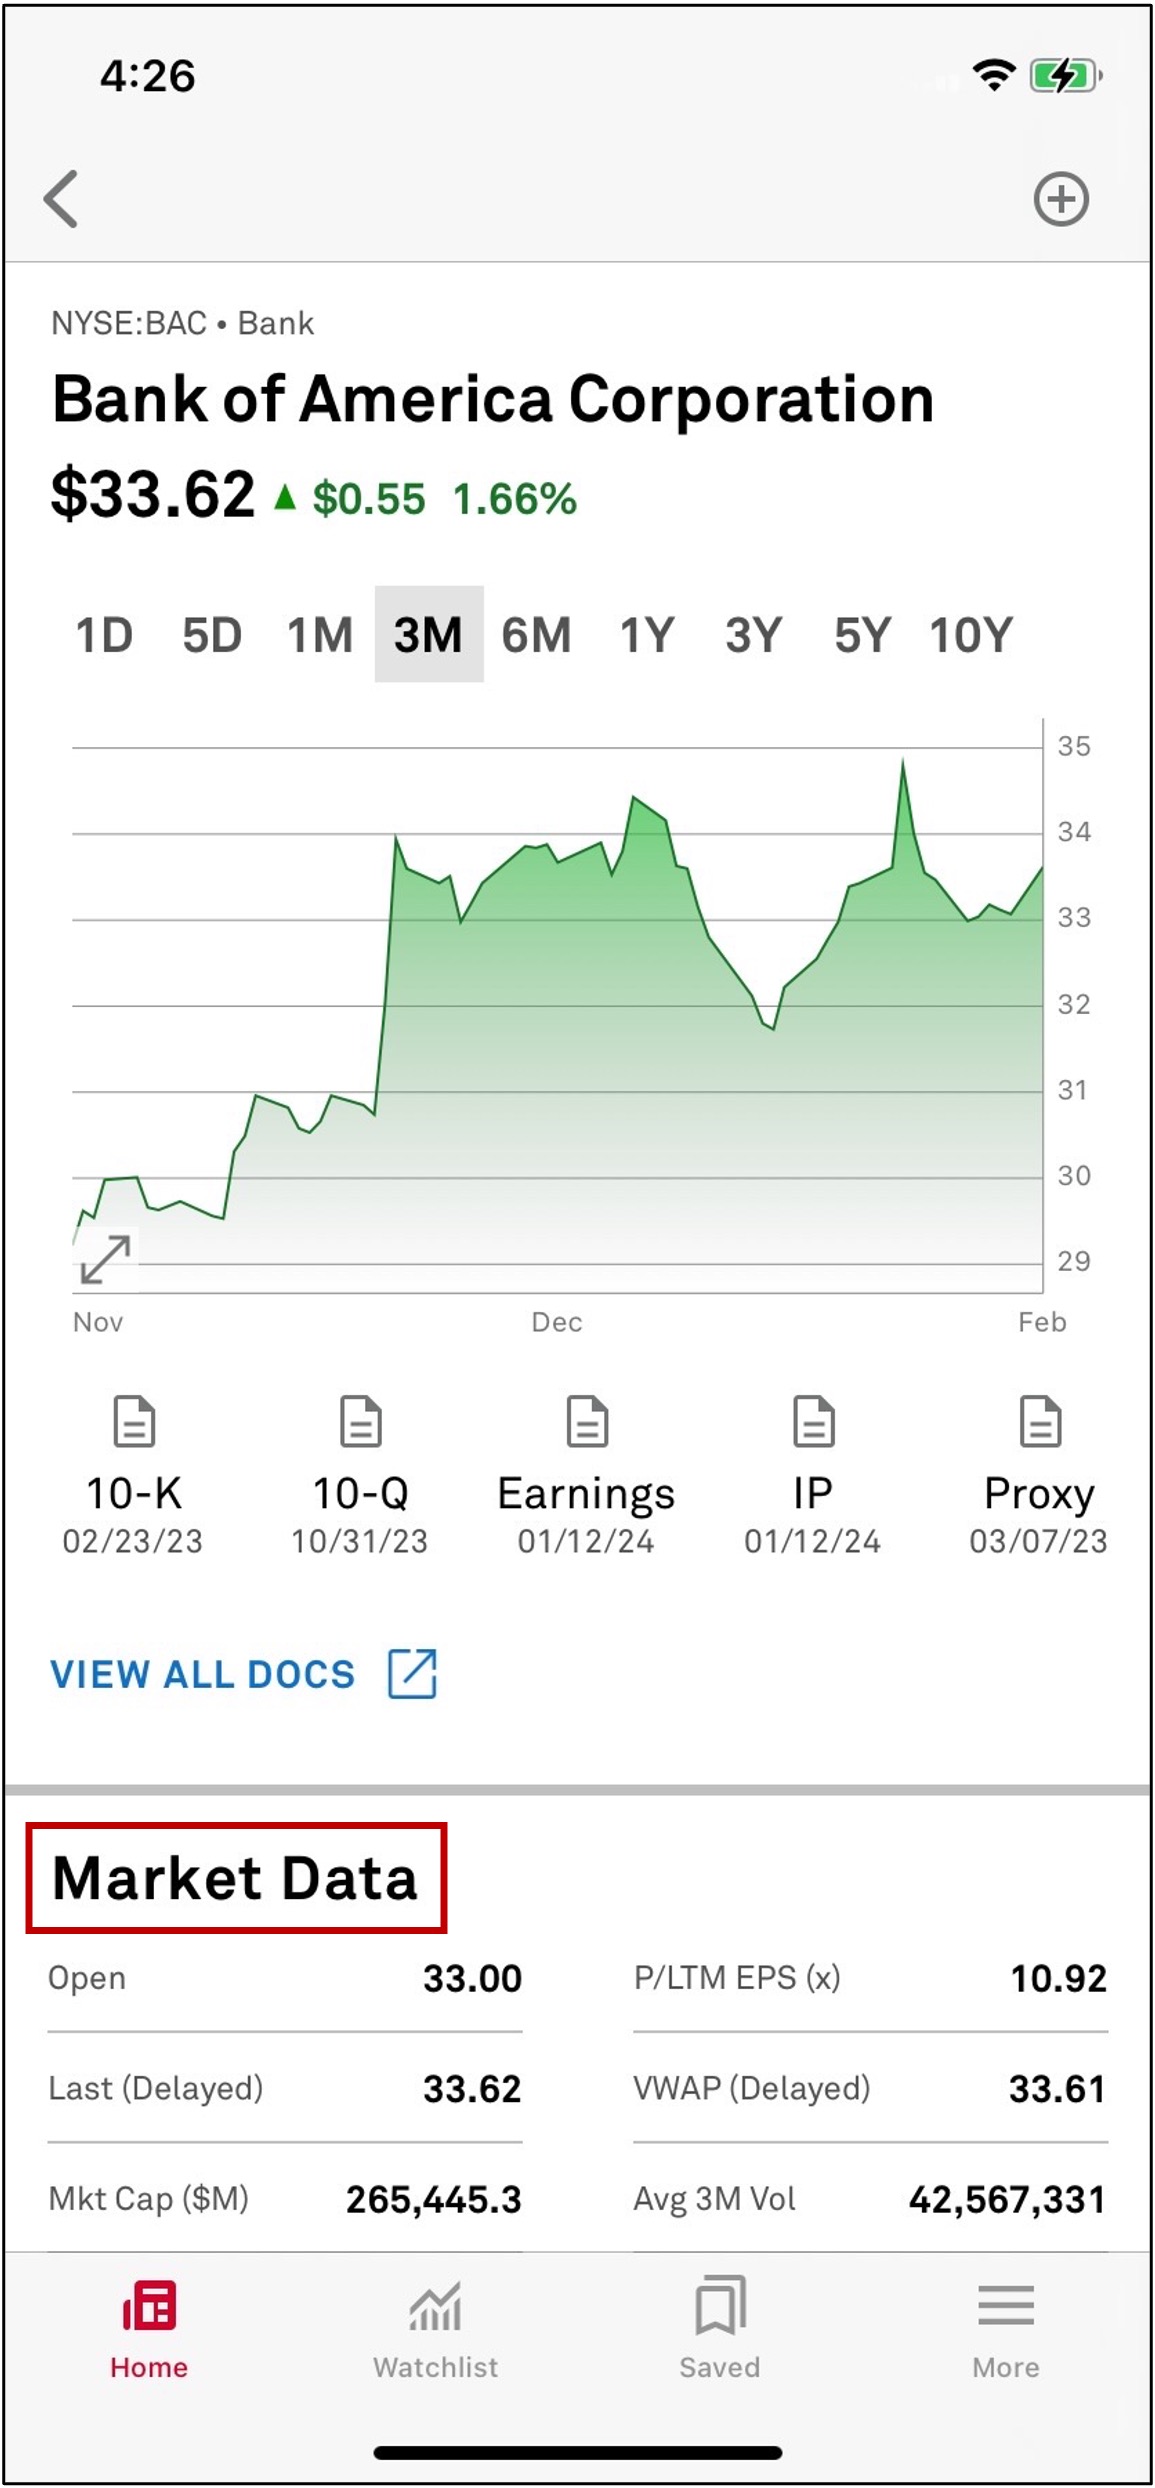
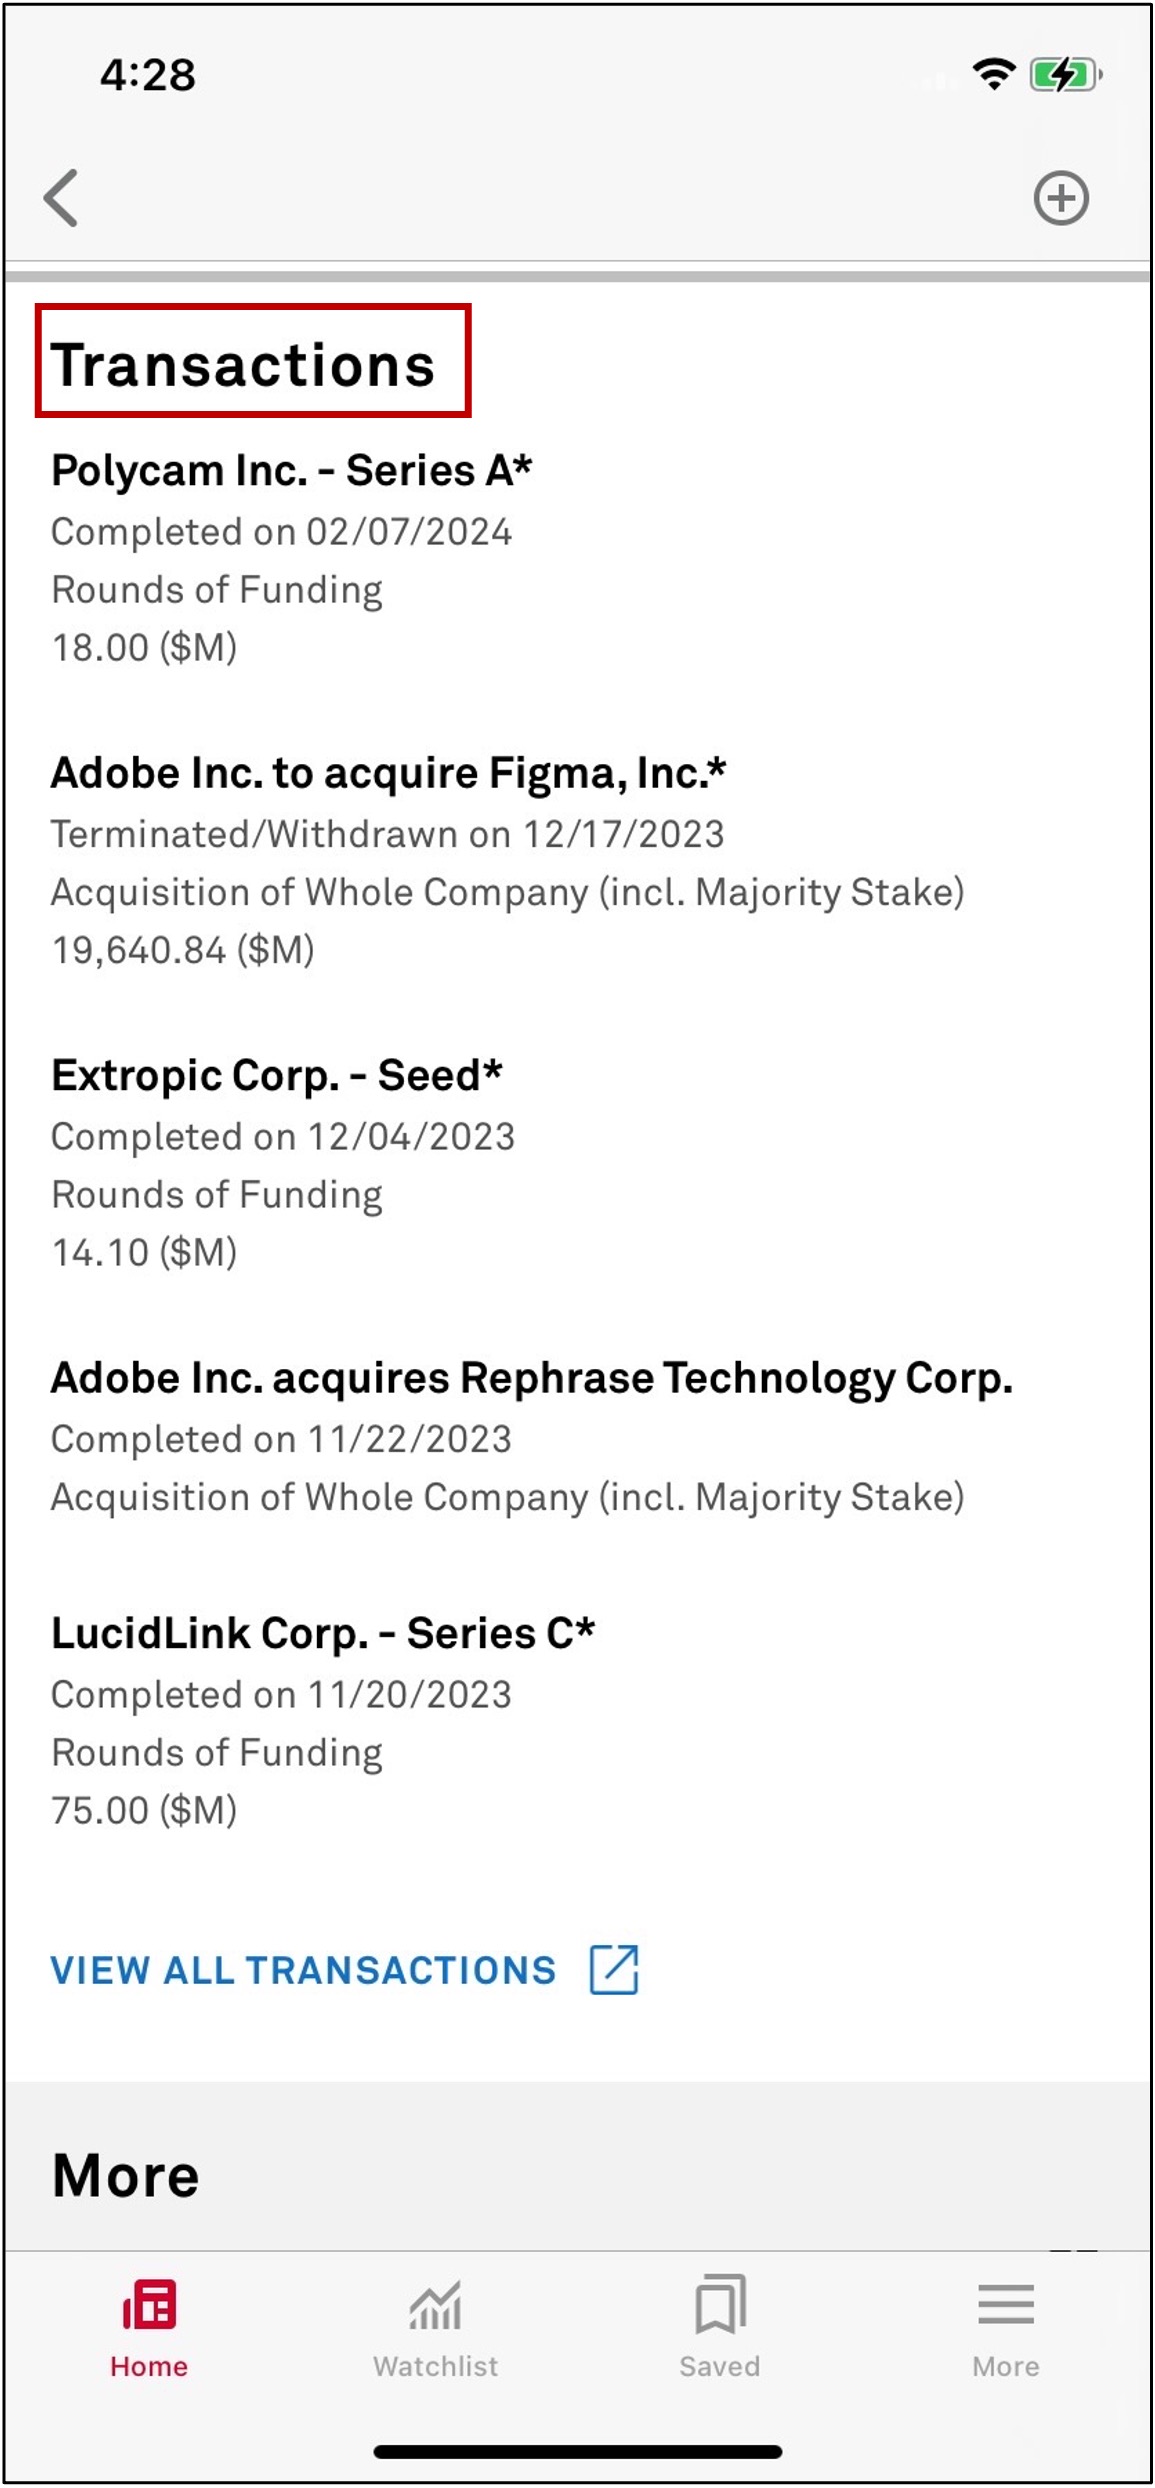
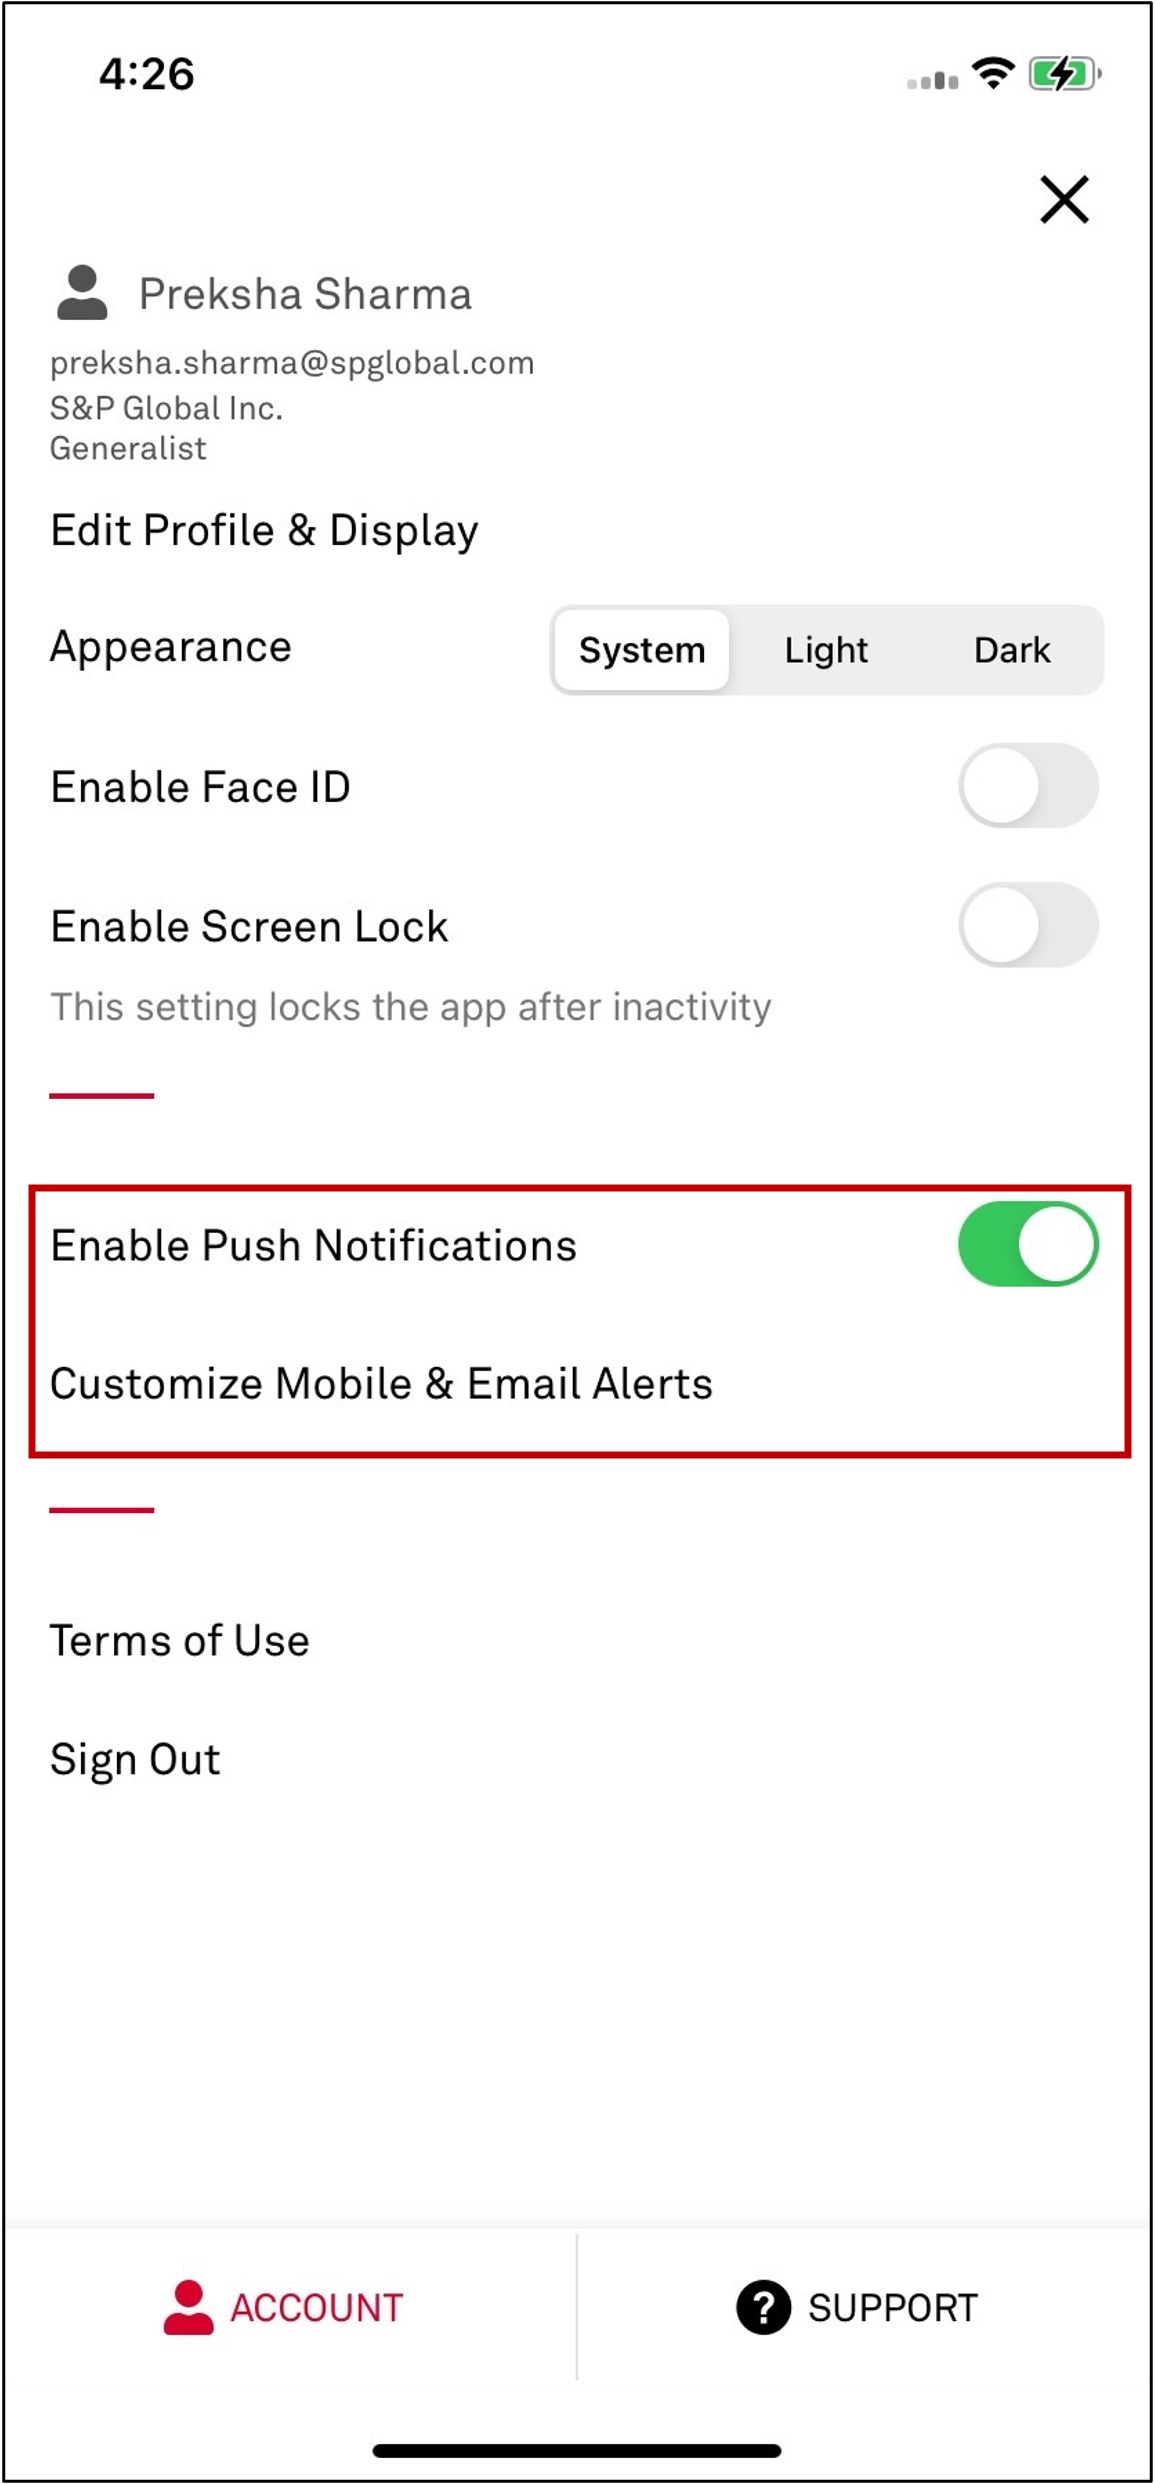
In this release, improvements are made to format and readability for News, Corporate Profile, and Alerts & Notifications. All changes have been made to both our Android and iOS mobile applications.
Note: Mobile update will be available at the end of March, 2024 from the Apple App and Google Play stores.
Users can view updated section headers on Corporate Profile.
Find in the Mobile App:
Find in the Mobile App:
In this release, we added several new or enhanced Excel templates to meet your data analysis needs.
This model allows users to view the performance of banks for a selected state ranked by City Listing, Size, Margin, Fee Income, Efficiency, Asset Quality, Earnings and Overall Performance.
Perform custom PE/VC fund benchmarking by filtering the desired funds to further slice and dice fund performance metrics and draw comparisons with any funds within a customized benchmark group. (Available to users with premium access). #Preqin
Private Equity Firm & Fund Details
Identify relevant PE/VC General Partners (GPs) using specific investment criteria, preferences, and strategies to further deep dive into the GP's funds, fund performance, portfolios, and investor information in greater detail. #Preqin
Transcript Sentiment Analysis
Analyze Transcript Sentiment Scores for a company you select and its peers, or at the portfolio level. The model also provides the ability to compare financial metrics and multiples against sentiment scores for more in-depth analysis. #Transcripts
Canadian Insurance - P&C Market Share Summary
Provides Market Share by Line of Business (LoB) and province for P&C Canadian & Foreign insurance companies using IFRS 17 disclosures. Also provides exhibits from the Provincial and Territorial Summaries for the selected company or the industry.
Canadian Insurance - P&C Peer Comps and Financials
Provides a 10-peer comparison of a Canadian P&C Insurance company that you select . Included in the template are key metrics along with performance & profitability ratios based on the IFRS 17 disclosures and Core Financial Statements for the company or the industry.
View S&P Ratings, Market Derived Signals, Credit Default Swaps, along with the Pre-Adjusted and Adjusted CreditStats Direct Financials for Banks. #RD #CIQ #Charts
Annual Mine Production Summary
Analyze historical and current yearly production data along with actual, estimate and forecast production reported at the mine level.
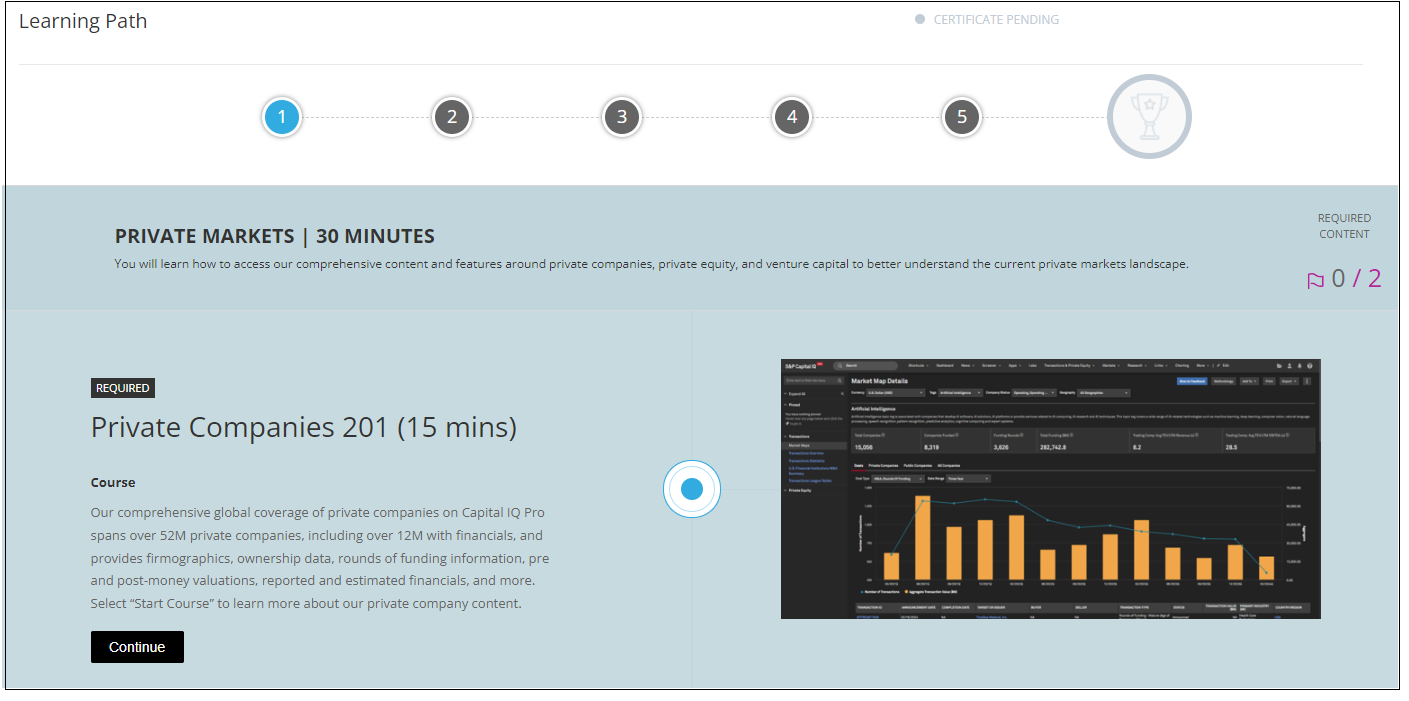
We are excited to announce the release of the new Capital IQ Pro 201 Certification in Capital IQ Pro Academy to help users learn more of the advanced features on the Capital IQ Pro platform and Office Plug-in.
Users can access the new Capital IQ Pro 201 courses to learn more about advanced Capital IQ Pro platform and Office Plug-in capabilities including Peer Comps, Transaction Screening, Private Companies, Find Buyers, Office Tools, and more. Once users complete and pass all ten courses, they are eligible to receive a Capital IQ Pro 201 certification to add to their LinkedIn. The Capital IQ Pro 201 certification adds to the other great courses already available in Capital IQ Pro Academy, including Capital IQ Pro 101, Banking 101, and RatingsDirect 101.
Find it in the platform:
Marketplace Data & Solutions January 2024 Communiqué
Marketplace Data & Solutions February 2024 Communiqué
Marketplace Data & Solutions March 2024 Communiqué