July 2024 S&P Capital IQ Pro Release Notes
Table of Contents July 2024 S&P Capital IQ Pro Release Notes
S&P Capital IQ Pro Release Highlights
In this release, we added new datasets and tools on Capital IQ Pro designed to enhance your daily workflows:
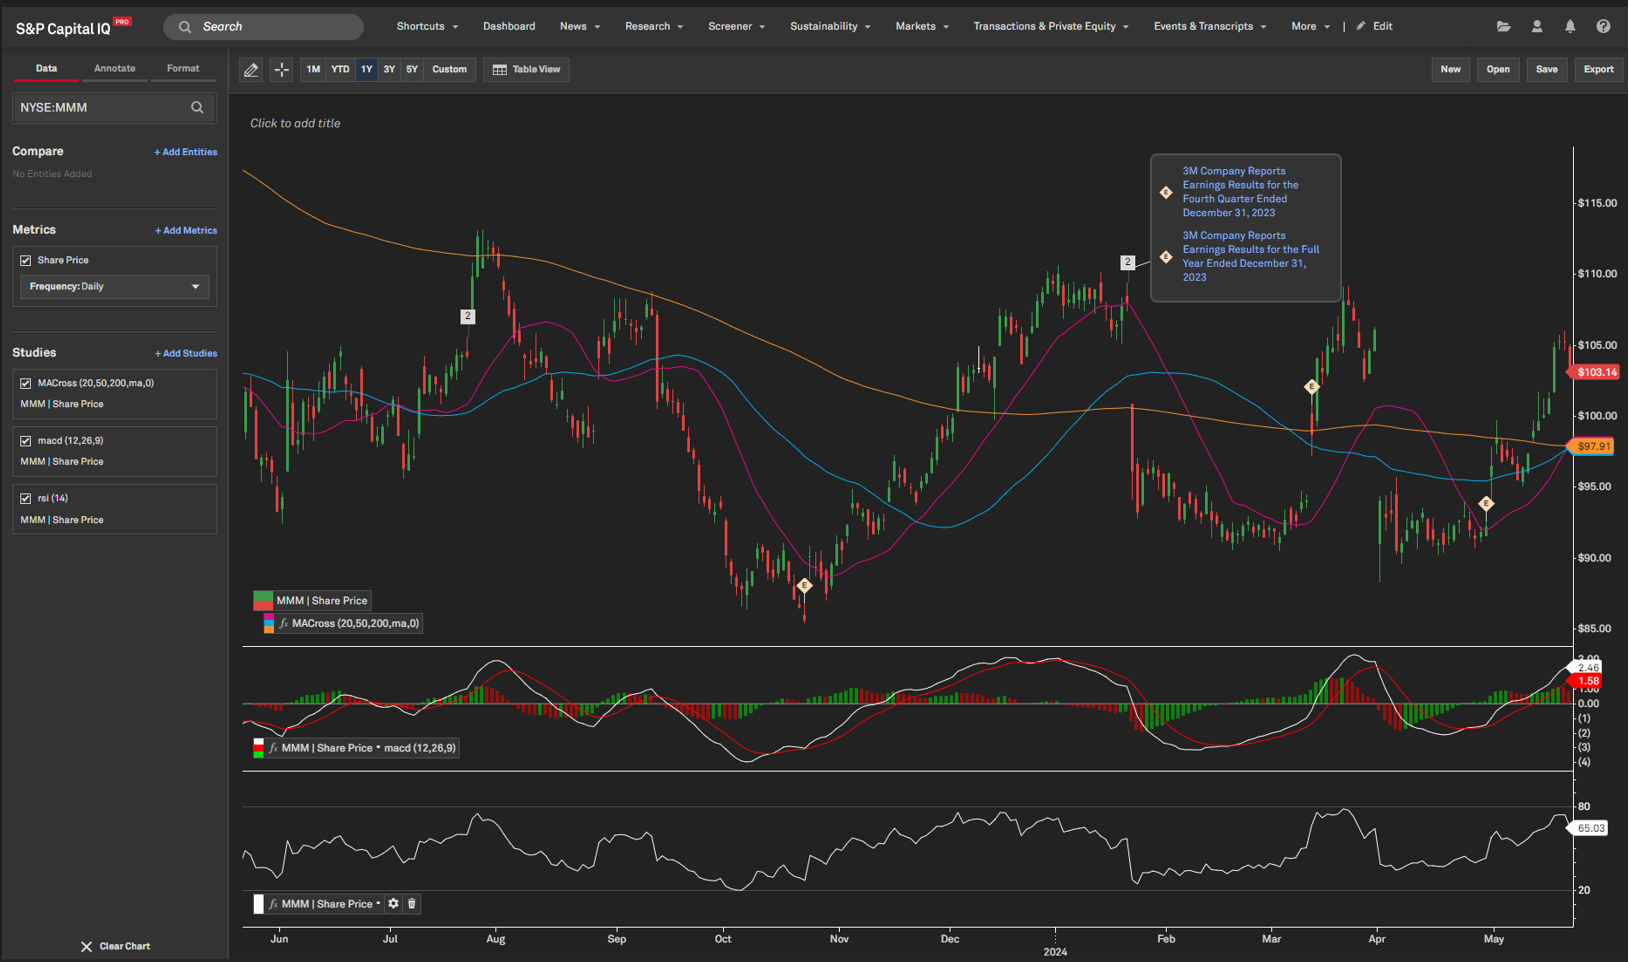
We introduced Chart Builder (Beta) to help customize your visual analysis with our library of pre-built charts and technical indicators, drawing tools, annotations with key developments, and the ability to create custom aggregates. We now offer our daily Morning IQ and Evening IQ newsletters for the U.S., EMEA, and APAC markets to stay informed of the latest regional market trends. We improved our Search capabilities to make it easier to discover relevant information on the platform, including comprehensive instant answers, expanded synonyms, and enhanced Boolean search. We expanded our Market Data offering by adding inactive securities and new Capital IQ equivalent Beta metrics across the platform.
Watch a video highlighting the enhancements from our latest release:
Visit S&P Capital IQ Pro and Contact Us for additional details. Chart Builder
In this release, we invite you to use a new and reimagined Chart Builder with improved presentation creation, analytical capability, and application performance.
Chart Builder (Beta)
With the introduction of Chart Builder (Beta), users can start with a template and edit a chart easily to customize series styling, add technical indicators, and markup the chart with drawing tools. Users can also annotate the chart with key developments and create custom aggregates within the application to chart a weighted index of companies on a single series.
Find it in the platform:
- Navigate to Chart Builder (Beta) from the Apps menu in the top navigation
- Create your chart by typing in a public company
- Select a template to quickly set up a chart, or click the Browse Metrics tab to select the data item to add to your chart
- Modify the date range at the top of the chart with default date ranges or input customized dates
- Use the left pane to add a company or custom aggregate as a benchmark to compare against, modify the data item being charted, or customize the chart formatting
Alerts
With this release, we now have additional daily recaps for the US, EMEA, and APAC markets so that our users can stay informed of daily regional market trends. Users can sign up for the Morning and Evening IQ newsletters by region across US, EMEA and APAC. These newsletters offer timely summaries tailored to each trading day’s close and are accessible in our Subscription Center. Additionally, we updated Market Data alerts for easier setup and added the ability to set alerts for an individual stock Target Price. These enhancements provide better, relevant, and easily accessible content, enhancing user workflows and ensuring timely access to the required information.
US Evening IQ Newsletter
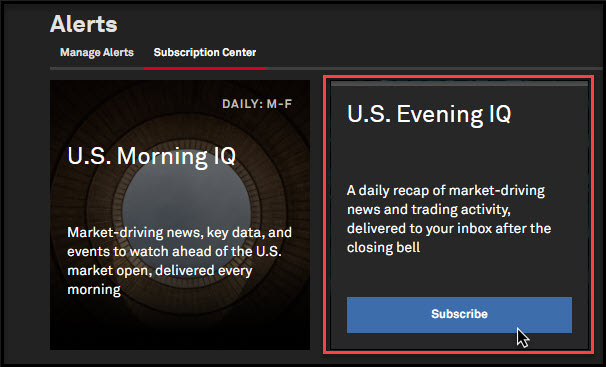
In addition to the US Morning IQ newsletter, users can now subscribe to the US Evening IQ newsletter, which offers daily summaries at the close of the US market, providing a concise and relevant overview of crucial information. These new newsletters ensure users are well-informed with timely insights and help enhance their decision-making by delivering end-of-day market recaps directly to their inbox.
Find it in the platform:
- Click the Bell icon on the right side of the top navigation and select Manage Alerts
- Click Subscription Center
- Click Subscribe or Unsubscribe from your preferred Newsletter
Regional Morning and Evening IQ Newsletters
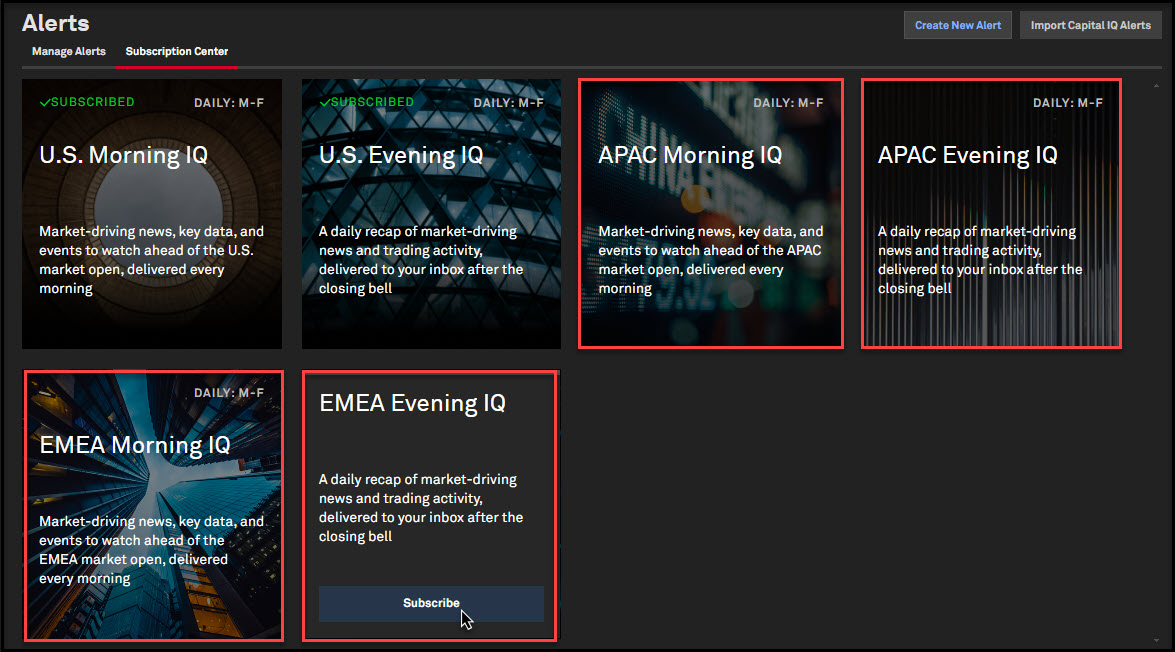
Users can now subscribe to the EMEA and APAC Regional Morning and Evening IQ newsletters, which provide daily customized market insights and supplementary data, similar to our US market newsletters.
Find it in the platform:
- Click the Bell icon on the right side of the top navigation and select Manage Alerts
- Click on Subscription Center
- Click Subscribe or Unsubscribe from your preferred Newsletter
Enhanced Market Data Alerts
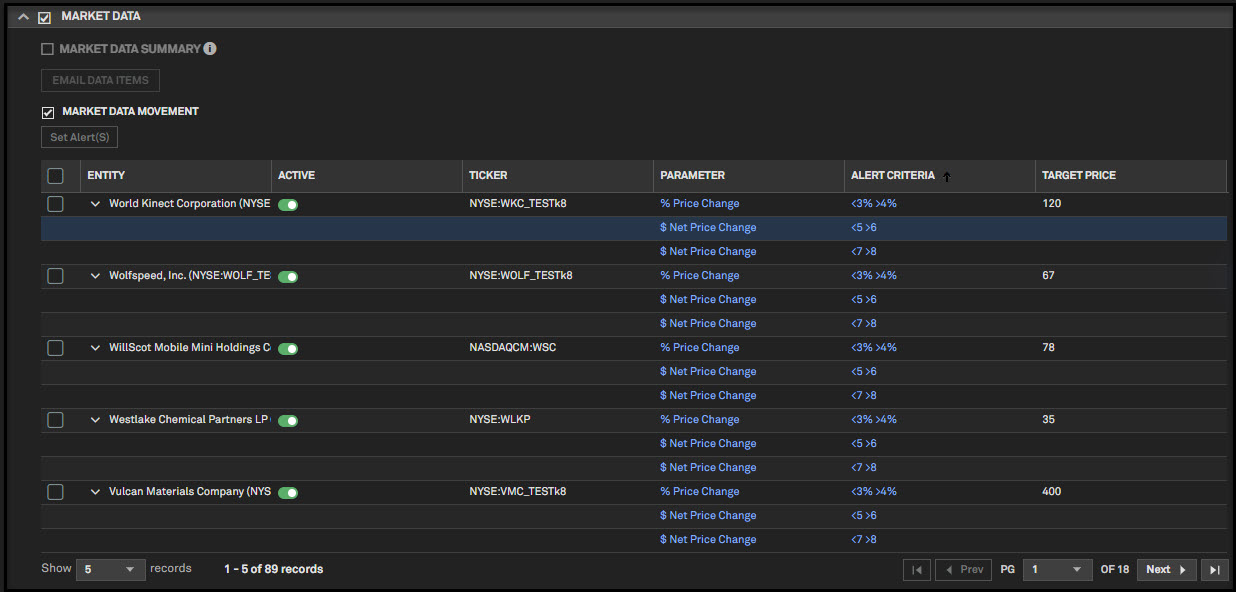
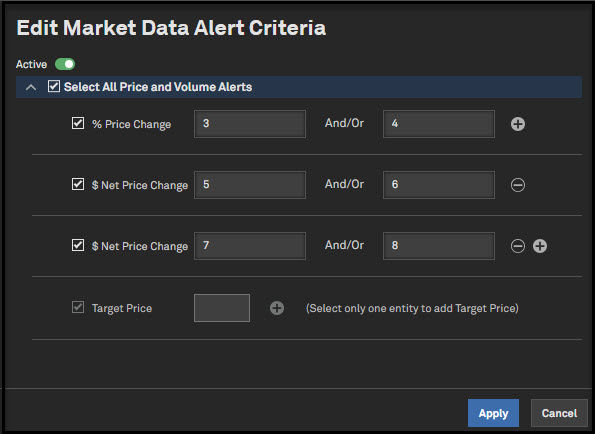
Users can now effortlessly add multiple criteria and parameters to their market data alerts and create single Target Price alerts.
Find it in the platform:
- Click the Bell icon on the right side of the top navigation and select Create New Alert
- Add Alert Name and select required Alert Settings
- In Alert Filters, add companies, lists, or portfolios
- On the Alerts Triggers, select Market Data and select up to 3 criteria per metric
- Click Apply and Save the alert on the top right corner
Search
In this release, we introduced exciting capabilities to enhance the discoverability of relevant information, including comprehensive instant answers, expanded synonyms in search, and improved query suggestions. Additionally, we added NEAR operators for advanced Boolean search, the display of listing statuses for equities and funds, Government, Supranational, Agency, and Corporate (GSAC) securities availability in search, and the ability to discover investor activism campaigns.
Instant Answers in Top Search
Users now benefit from a significant expansion of our instant answer capabilities within the top search, providing access to a wealth of additional data points directly within the search functionality. With this update, users can use keywords and sentences such as Company Revenue 2021 for past company metrics and country metrics. 71 company metrics and 8 country metrics are included. This enhancement, accompanied by an improved interface, provides better usability for users.
Find it in the platform:
- Historical Company metrics
- Navigate to the search bar within the top navigation menu and enter keywords for historical company metrics, e.g. Tesla Revenue 2021
- Access instant answers that will provide valuable historical context, whether it’s revenue or other key performance indicators
- When clicking on the answer provided in the search experience, users will be directed to the company profile page.
- Historical company metrics are supported through the year 2020, e.g., IBM Revenue 2020
- Queries without a time period specified will have the most recent answer provided, e.g., Tesla Revenue
- Country metrics
- Navigate to the search bar within the top navigation menu and enter keywords for country-specific metrics such as demographic data and economic indicators, e.g. India GDP
- When clicking on the answer provided in the search experience, users will be directed to the country profile page
- The following country metrics are supported as part of this enhancement
- Gross Domestic Product (GDP)
- Purchasing Managers Index (PMI)
- Purchasing Managers Index Services
- Purchasing Managers Index Manufacturing
- S&P Credit Rating
- Total Population
- Real GDP Growth
- Risk Score

Enhanced Search Suggestions in Top Search
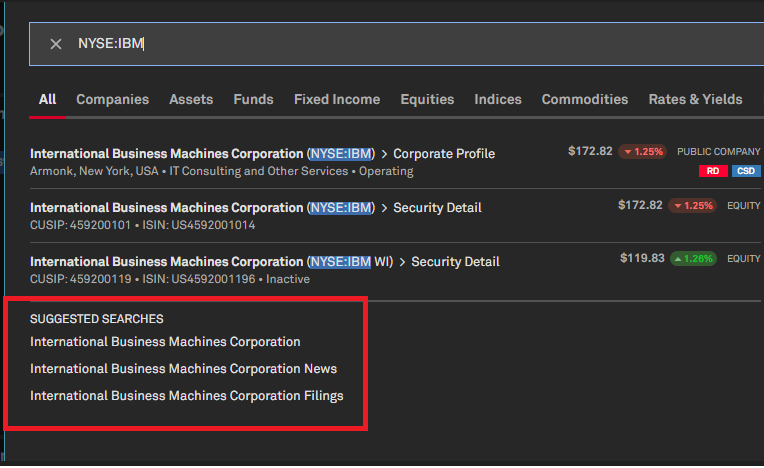
Users will receive more contextually relevant suggestions as they type in their search queries, helping them discover relevant content. Search query suggestions are available to correct any misspellings or typos in the user's keyword query.
Find it in the platform:
- Navigate to the search bar within the top navigation menu
- Type a search query e.g., IBM and view intuitive and relevant suggestions to expand the search
- Click on the search suggestions to refresh the search results and view relevant content for the suggested query
- Type a search query where the company is misspelled, e.g. appel or bankof america
- Notice the search experience is now providing relevant suggestions for Apple and Bank of America
Enhanced Boolean Search with ‘NEAR’ Operators
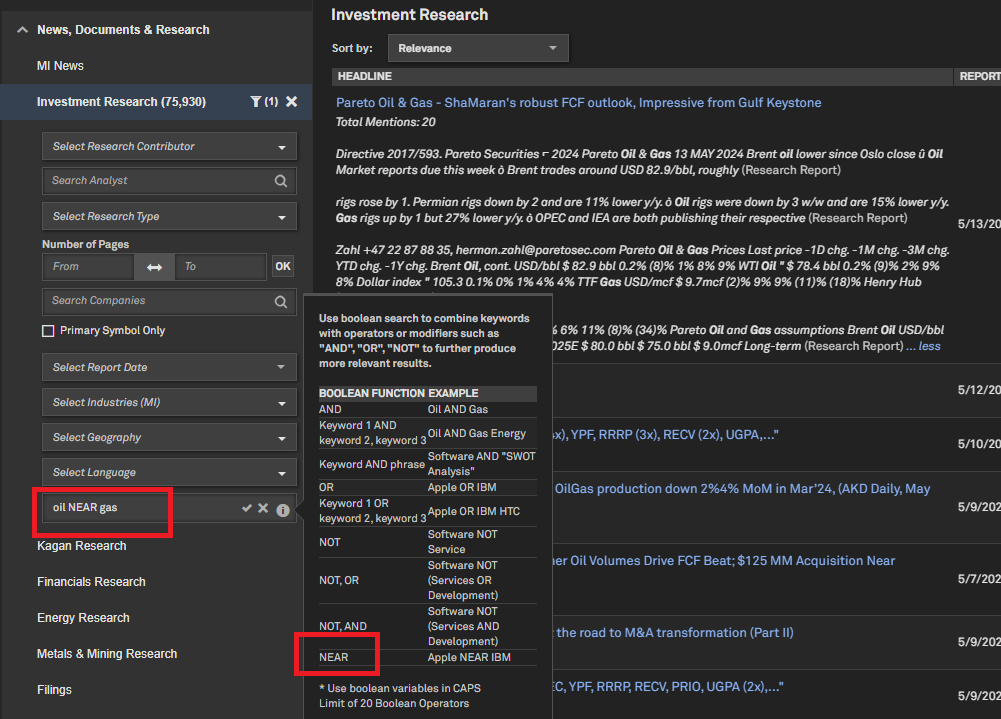
With the inclusion of NEAR operators in Boolean search, users can more easily discover content relevant to their research within our advanced search capabilities. The supported operations include NEAR, NEAR(n), NEAR(x,y), NEAR with OR, NEAR with AND, NEAR with NOT, and NEAR with any combination of AND, OR, NOT.
Find it in the platform:
- Navigate to the search bar within the top navigation menu
- Use NEAR operators in Advanced Search Boolean filters for the following verticals: MI News, Kagan Research, Energy Research, Financial Research, M&M Research, Filings, Key Developments, Events
- Examples of how the Near operators work include the following:
|
Examples of NEAR Operators
|
|
NEAR
|
Industry NEAR Enterprise
|
Industry within 30 words of enterprise
|
|
NEAR(N)
|
Industry NEAR(5) Enterprise
|
Industry within 5 words of enterprise
|
|
NEAR(x,y)
|
Industry NEAR(1,5) Enterprise
|
Industry within a range of 1 to 5 words from enterprise
|
|
NEAR with AND
|
Oil NEAR(10) (Exploration AND Production)
|
Oil is within 10 words of both exploration and production
|
|
NEAR with OR
|
Oil NEAR(10) (Exploration OR Production)
|
Oil is within 10 words of either exploration or production
|
Status Indicators for Equities in Search
Users can now view the status of equities in search results, even when they are inactive or no longer actively traded, providing visibility into their current status. The status is also available as a filter option for equities within the advanced search results page.
Find it in the platform:
- Navigate to the search bar within the top navigation menu
- Type a keyword for any security (e.g., NYSE:bml) and notice the status of the relevant securities
- Also view the status of all relevant results by hitting ENTER on the keyboard to be directed to the advanced search results page
- Navigate to Equities vertical in the left-hand navigation to find the option to filter by status and view the additional column labeled Status for each result

Improved Synonyms in Search
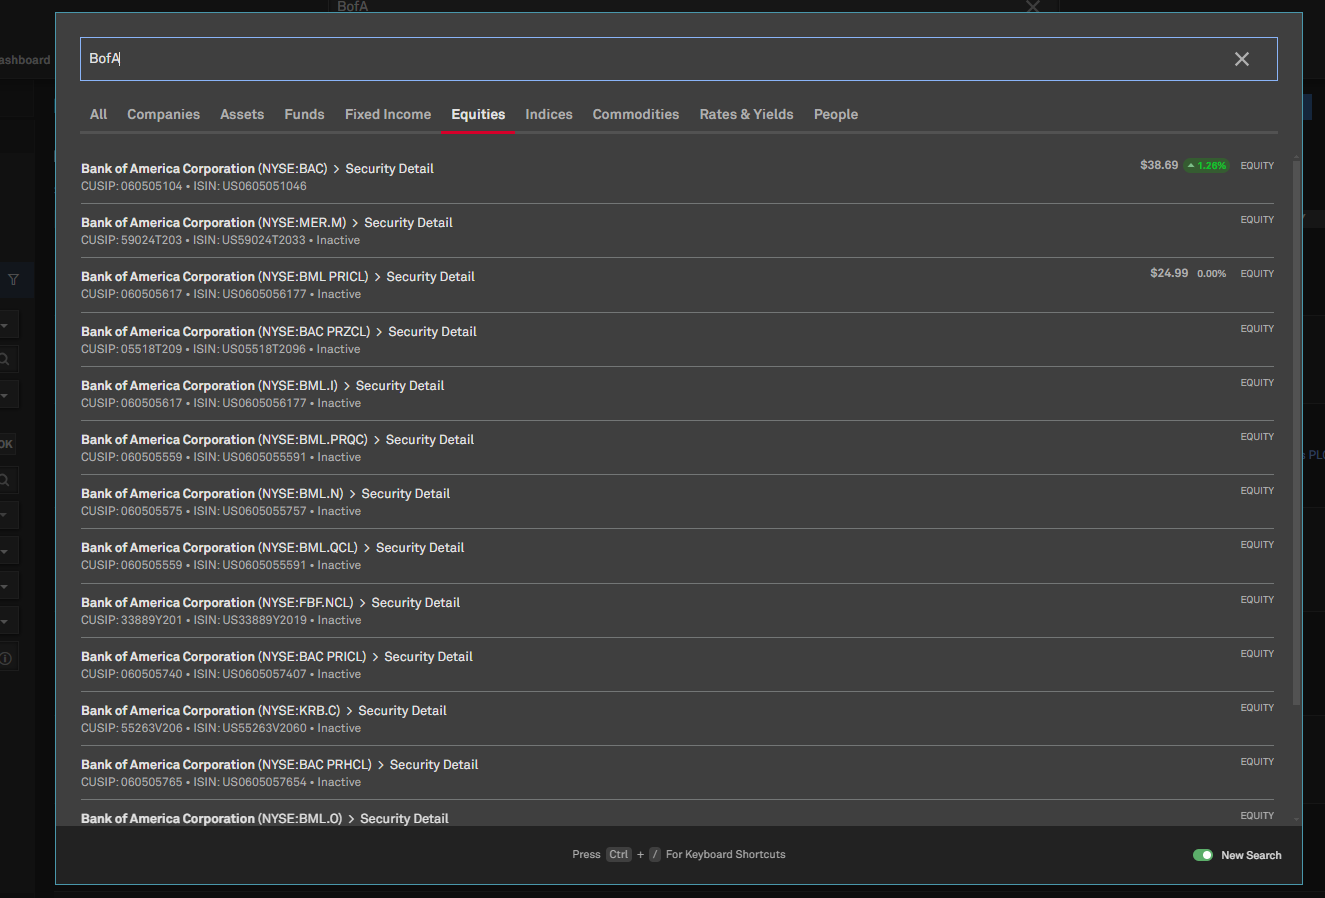
Users can now discover content related to specific companies using various synonymous terms and alternative company names. This feature extends the existing synonyms available for companies to include other content sets on typeahead, such as Fixed Income, Equities, and Transactions.
Find it in the platform:
- Navigate to the search bar within the top navigation menu on the Capital IQ Pro platform
- Type a keyword (e.g., BofA, a synonymous term for Bank of America) to see relevant results for fixed income, equities, and transactions.
- Other examples include “schwab,” a synonymous term for The Charles Schwab Corporation and JPM, a synonymous term for JPMorgan Chase & Co. When users search with these synonymous terms, they will also see relevant results for fixed income, equities, and transactions content for the respective companies.
Government, Supranational, Agency, and Corporate (GSAC) securities in Search
Users can now access expanded coverage of Fixed Income data from Markit, including new bond types available in top search and advanced search results.
Find it in the platform:
- In Search within the top navigation menu, search for GSAC Securities, e.g. CND10003ZSP0; G079AQEA2
- Navigate to the Fixed Income page in the left navigation in All Results
- Results can be filtered by Debt Capital Markets bond type
- New filters added include Sovereign and Supranational

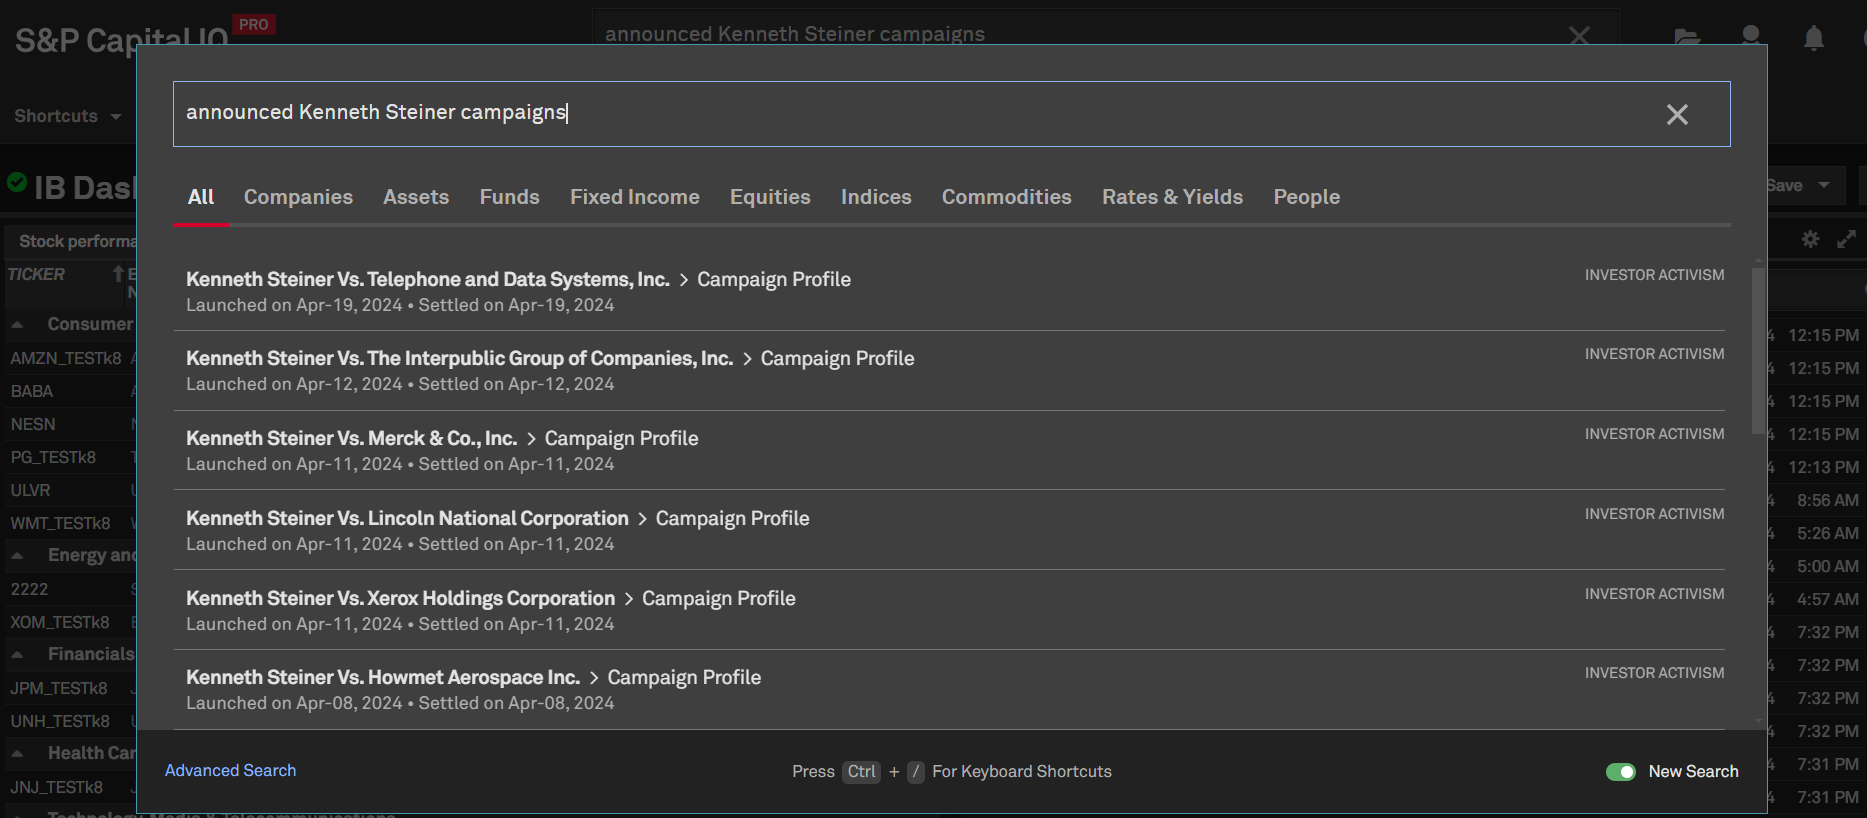
Investor Activism Campaigns in Search
Users can now find Investor Activism campaigns directly in Search.
Find it in the platform:
- Navigate to the search bar within the top navigation menu
- Users can search by campaigns launched by Target/Acivist or campaigns in a specific industry
- Users can also find activism campaigns using natural language queries, e.g. recently launched activist campaigns, successful activism campaigns 2022 etc. Additional examples include the following :
- Campaigns launched by Elliott
- Blue Clay Capital Management, LLC Vs. BBQ Holdings, Inc
- Activism campaigns in Energy
- Successful Elliott campaigns
Macroeconomic Data
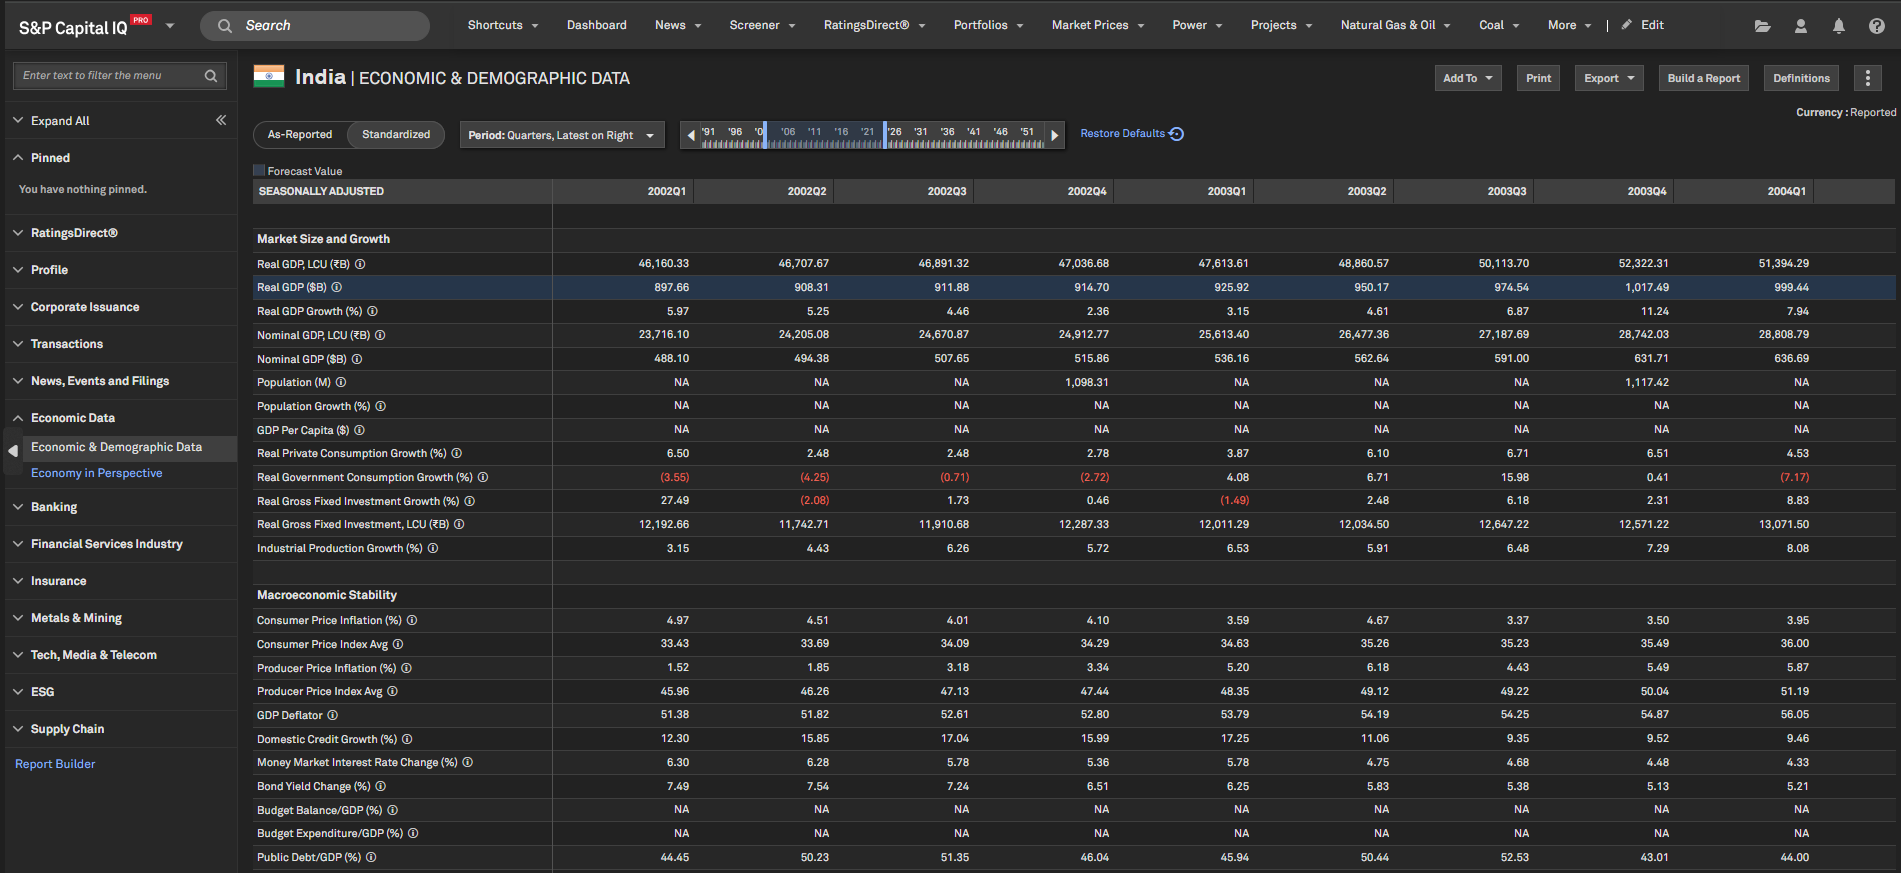
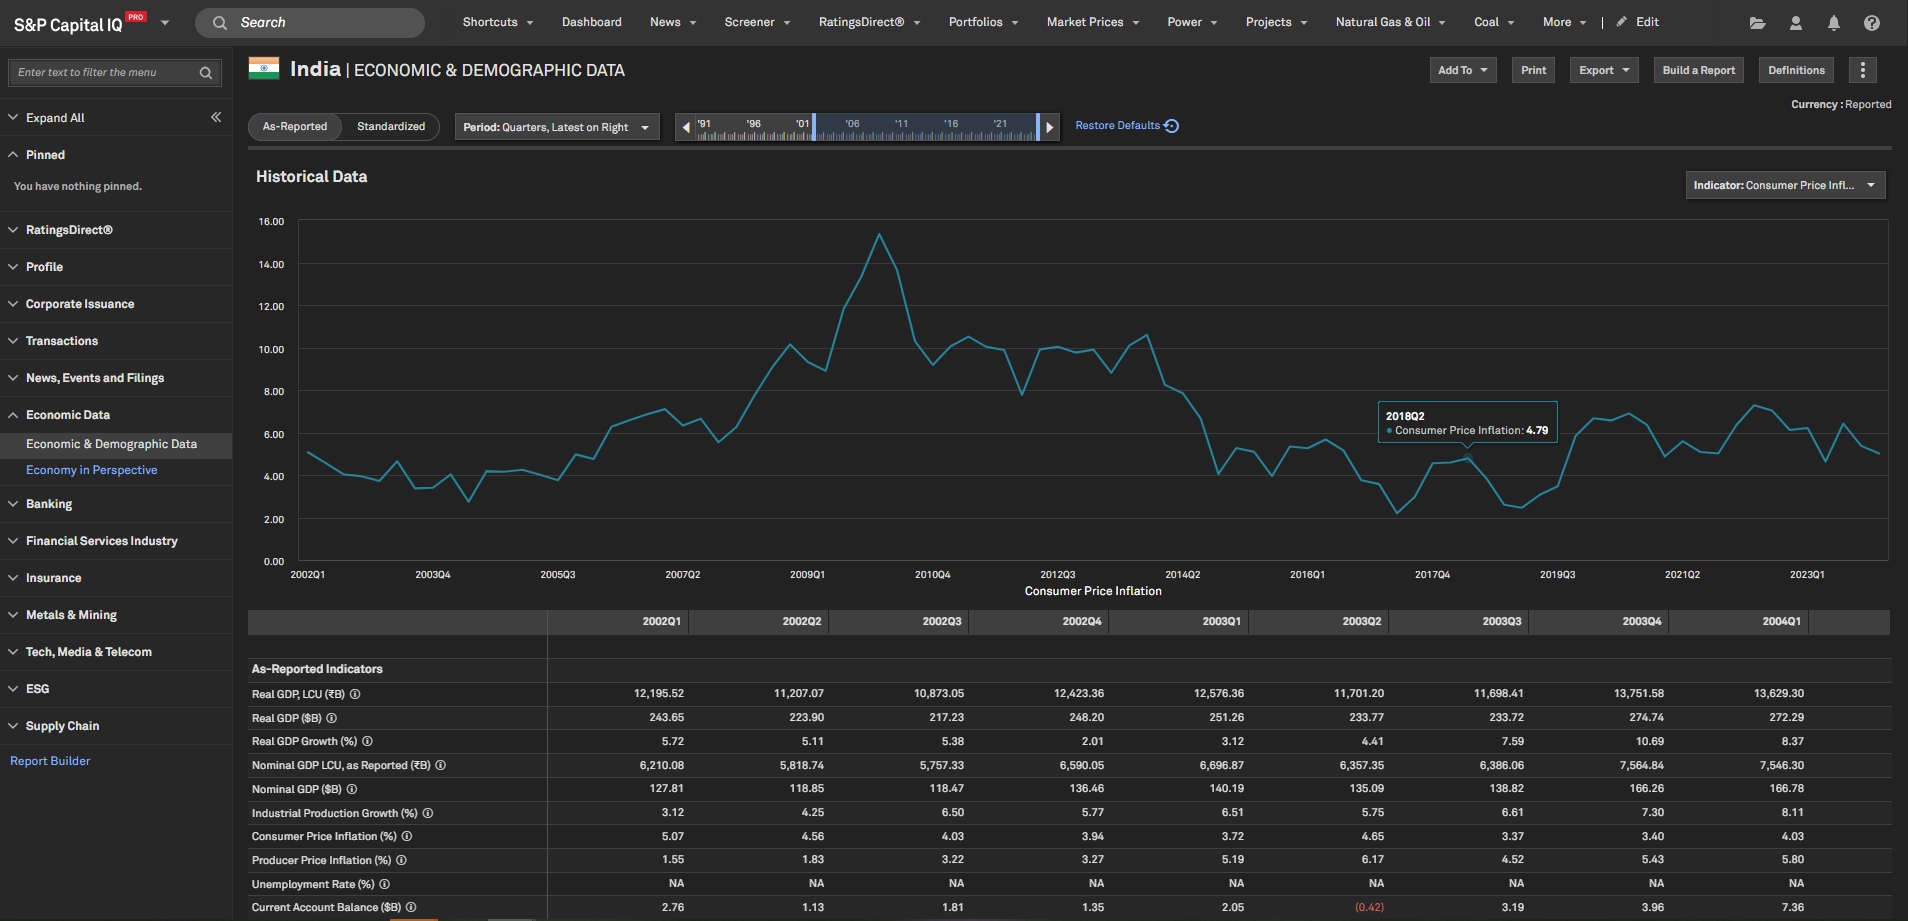
In this release, we expanded our global economic indicator coverage to include annual, quarterly, and monthly historical macro indicators for 185 countries. These 15 indicators are classified as As-Reported Macro Indicators and are updated more frequently.
As Reported, Historical Demographic Data Macro Indicators
Users can now access 15 new As Reported Macro Indicators which include Real GDP Growth(%), Real GDP(LCU), Nominal GDP($B), Real GDP($B), Nominal GDP(LCU), Consumer Price Inflation(%), Producer Price Inflation(%), Industrial Production Growth(%), Unemployment Rate(%), Current Account Balance($B), Goods Imports($B), Goods Exports($B), Trade Balance($B), Exchange Rate Average, Exchange Rate End. We also added two new indicators to our Forecasted Series: Real GDP($B) & Nominal GDP(LCU).
Find it in the platform:
- Country Profile
- Search for any Country from the top search bar to navigate to a Country Profile from the left-hand navigation, click the Economic & Demographics tab
- Select As-Reported tab to see the historical, as-reported data
- Use period and range selectors to choose your desired time period
- Use the indicator drop down on the right to chart the historical time series based on indicator and the period chosen
- Screener:
- Navigate to Screener from the top navigation or the Apps menu
- Select Geographic Intelligence
- Choose Countries of interest and from Edit Criteria or Display Columns, expand Macroeconomic Data > As Reported folder to choose the required macro-indicators
- Use the parameters to choose desired time periods
Market Data
In this release, we expanded our equity offering coverage by adding inactive securities across the platform. Additionally, we onboarded new metrics for CIQ equivalent Betas on the Dashboard and S&P Capital IQ Pro Plug-in.
Beta Metrics
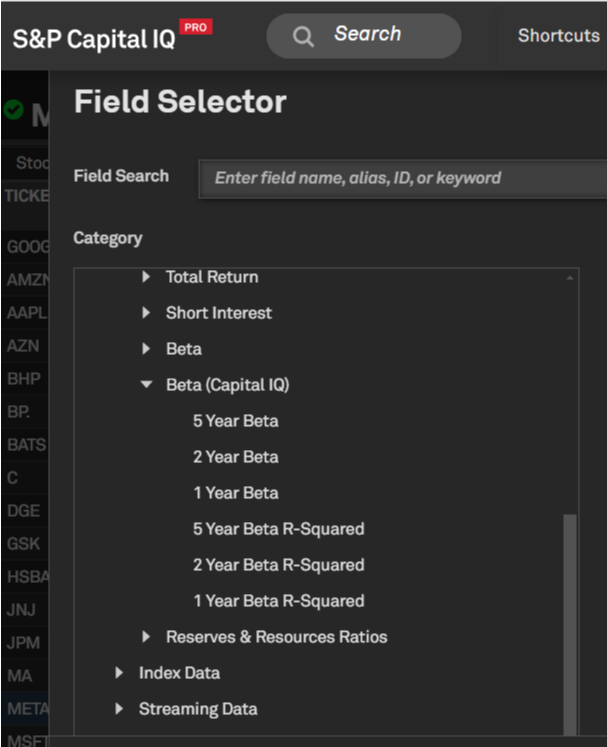
Users can now access the Capital IQ equivalent Beta metrics in Dashboard and S&P Capital IQ Pro Plug-in. S&P Capital IQ Pro Plug-in will additionally support custom Beta metrics.
Find it in the platform:
- Navigate to Dashboard and open Add Widget menu on the top right
- Select List widget and navigate to the Field Selector
- Go to Market Data > Equity Market Data > Beta (Capital IQ) with different Beta metrics
Inactive Securities
Users can access inactive securities data within the key areas of the product, including Dashboard, Search, Charting, Office Plug-in, and Screener.
Find it in the platform:
- Search for and select an entity in the top search bar
- Navigate to Equity Listings in the left navigation
- Select the option to include Inactive in Status dropdown
- The page will be updated with inactive listings along with the active listings

Investor Activism
In this release, we introduced Activist Investor filters and indicator flags on the Ownership pages and added Activist Investor filter and Takeover Defense Scores within Screener. Additionally, we added new multi-to-one data field options in S&P Capital IQ Pro Plug-in for Activism campaigns.
Activist Investor filter and flags on Ownership pages
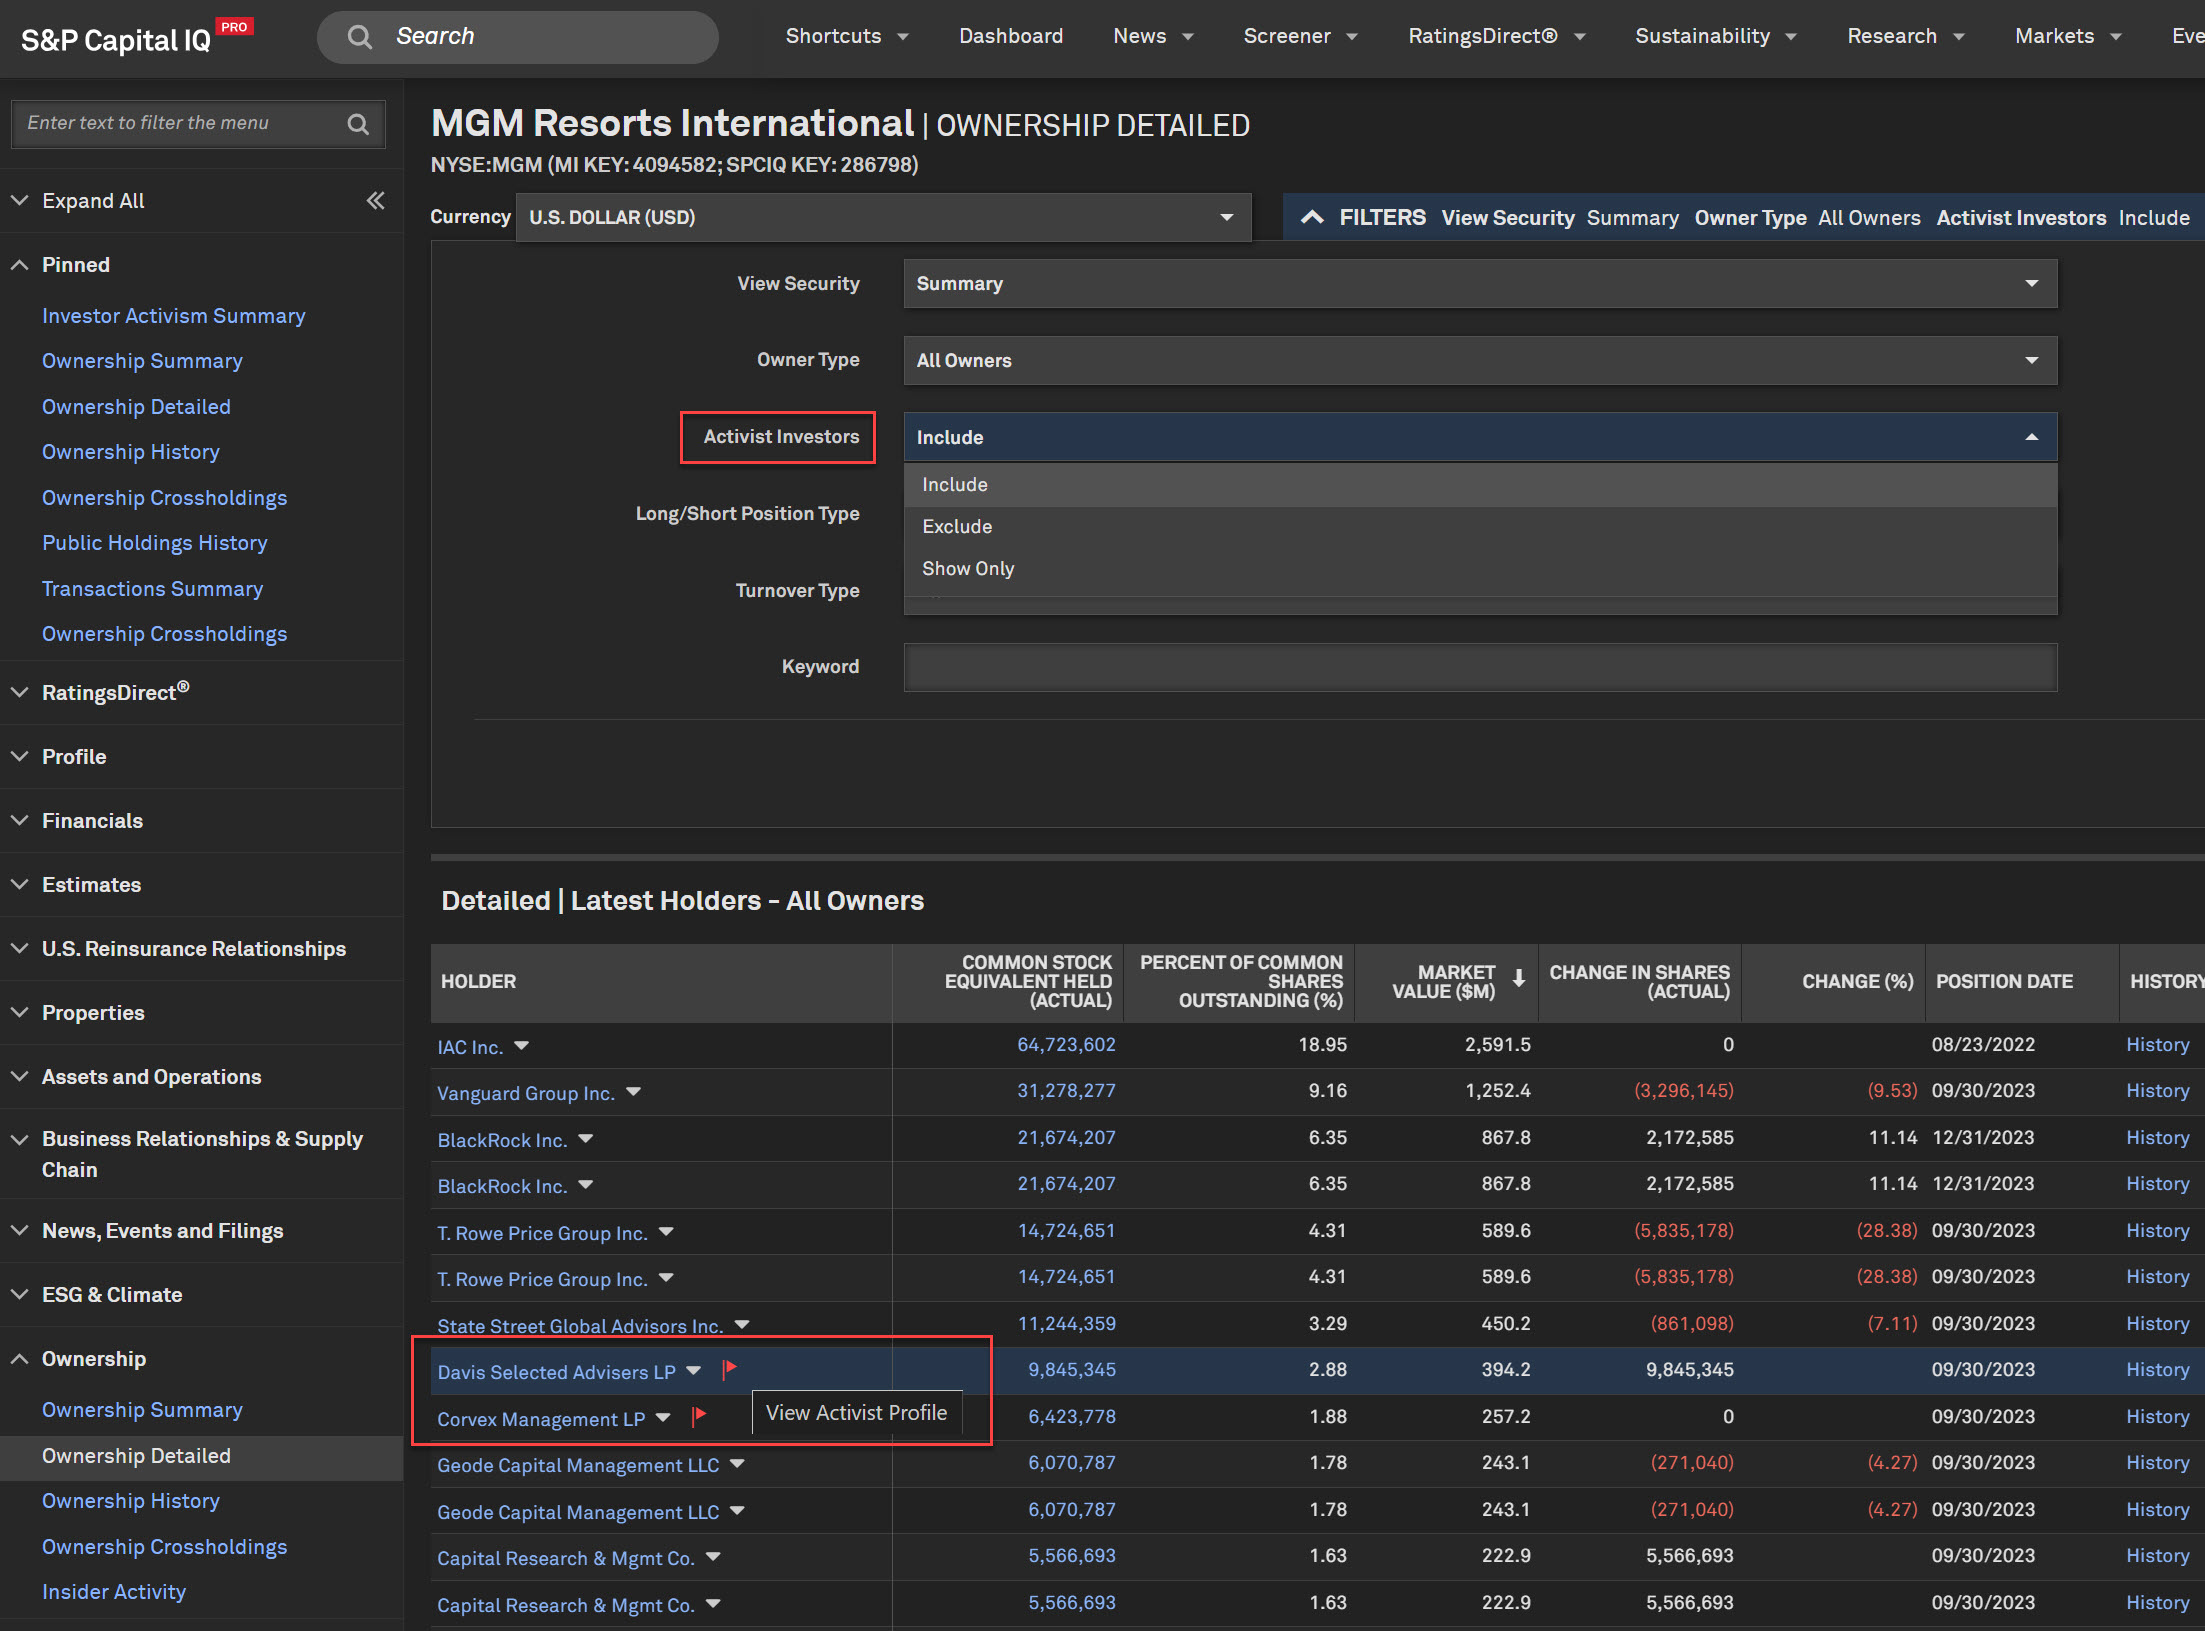
Users can quickly identify Activist Investors on Ownership pages with the Activist Investor filter and red indicator flags.
Find it in the platform:
- Search for and select a company in the top search bar
- Expand Ownership in the left-hand navigation and select Ownership Summary
- Navigate to Top Holders or Top Buyers and Sellers tabs to identify any Activist Investors indicated by a red flag next to the company name
- Click on the red flag to navigate to Activist Profile page
- Or expand Ownership in the left-hand navigation and select Ownership Detailed, Ownership History, or Ownership Cross holdings
- Expand top filter menu to find the new Activist Investor filter
- Navigate to the data grid to identify any Activist Investors indicated by a red flag next to the company name
Investor Activism Enhancements in S&P Capital IQ Pro Plug-in
Users can now populate data in individual cells within the S&P Capital IQ Pro Plug-in for data items which have multiple associated entries, instead of consolidating all the data in one cell.
Find it in the platform:
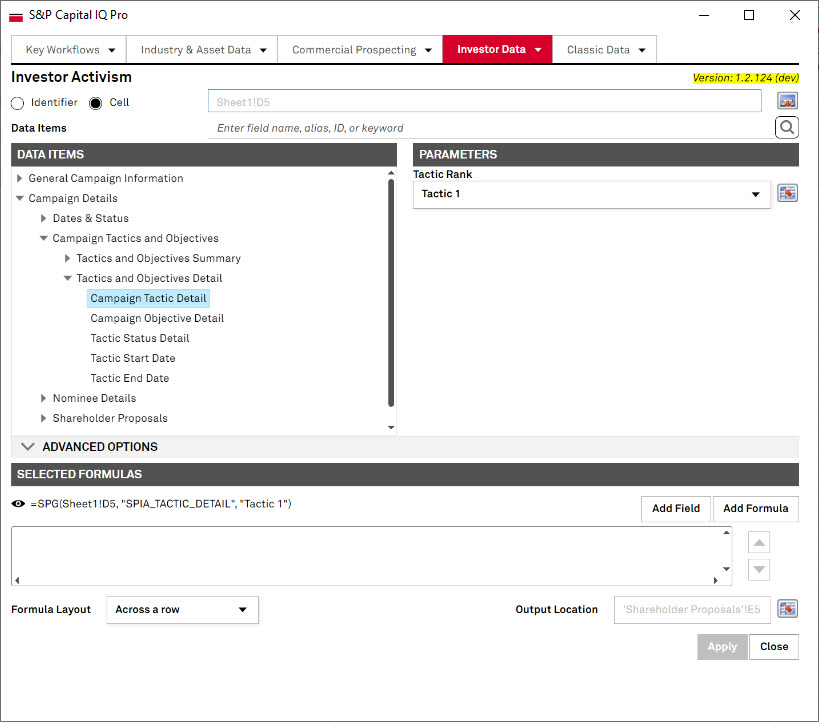
- Launch S&P Capital IQ Pro Plug-in and open Formula Builder
- In the top menu, select Investor Data > Investor Activism
- For any multi-to-one data item Campaign Tactic Detail, follow the detail folder to the single cell version of that data Campaign Details > Campaign Tactics and Objectives > Tactics and Objectives Detail > Campaign Tactics Detail
- E.g., Campaign Tactic Detail: =SPG(“Ticker”,”SPIA_TACTIC_DETAIL”,“1”) where “1” is the Tactic Rank
- Nominee Name Detail: =SPG(“Ticker”,”SPIA_NOMINEE_NAME_DETAIL”,“1”) where “1” is the Nominee Rank
- Proposal Detail: =SPG(“Ticker”,”SPIA_PROPOSAL_DETAIL”,“1” where “1” is the Proposal Rank
Investor Activism Screener Enhancements
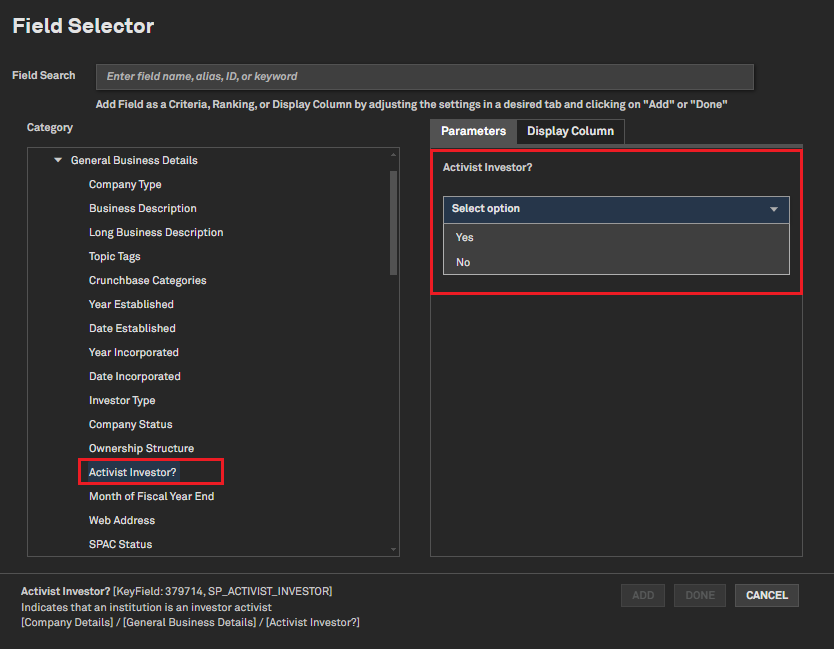
Users can now screen for companies flagged as Activist Investors and retrieve Takeover Defense Scores within the Screener.
Find it in the platform:
- Navigate to Screener from the top navigation bar or from the Apps menu
- Select Companies view, under Browse Criteria on the left, expand Company Details > General Business Details > Activist Investor?
- Or under Browse Criteria on the left, expand Company Details > Corporate Governance & Takeover Defenses > Takeover Defense > Takeover Defenses Score
Peer Comps
In this release, we enhanced Peer Comps to support scoring for Topic Tags and secondary industry fields and updated Peer Comps reports to be specifically tailored for Banks and Credit Unions.
New Fields in Peer Score Criteria
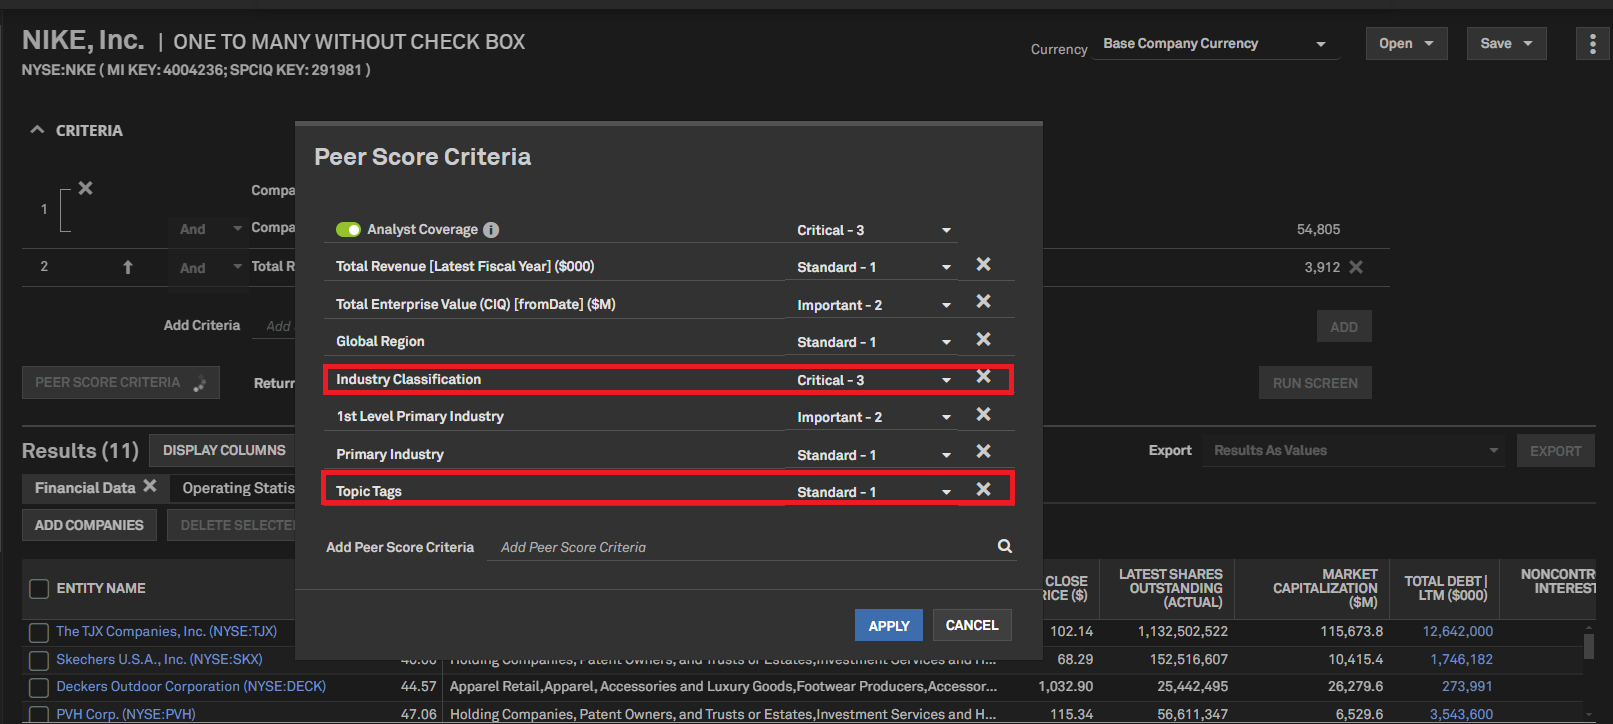
Users can now score Peer Comps using Topic Tags and secondary industries. Peer candidates will be evaluated based on the number of values matching the focus company. Topic Tags and secondary industry are included as Peer Score criteria by default for public companies with market capitalization exceeding $25 billion.
Find it in the platform:
- Search for and select an entity from the top search bar and select Peer Comps from the left-hand navigation under Profile
- Expand Criteria and click on Peer Score Criteria
- Click Add Peer Score Criteria to add a new field for scoring
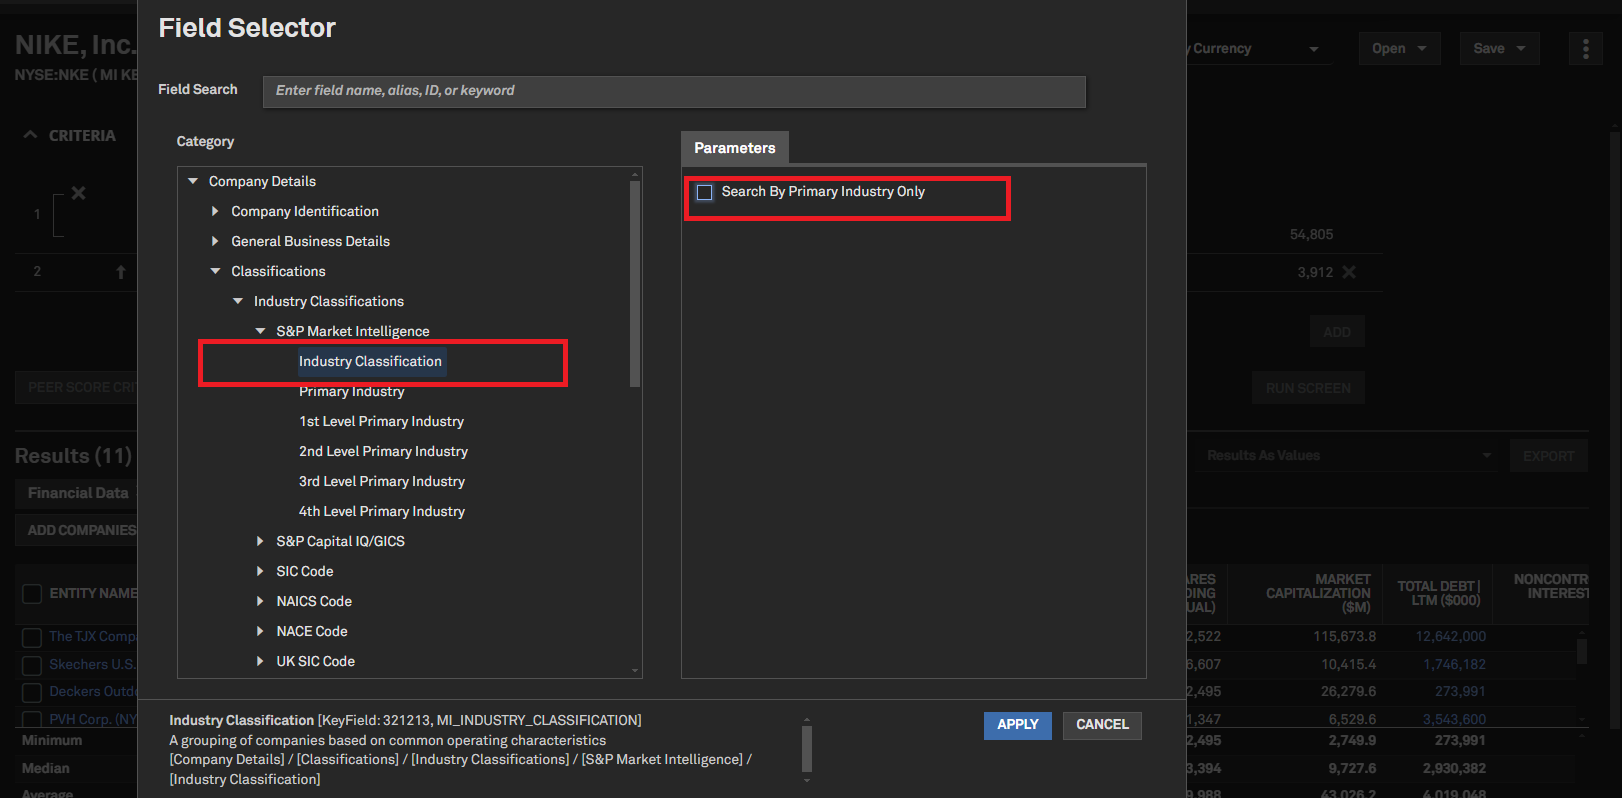
- To add Topic Tags, navigate to Company Details > General Business Details > Topic Tags, select the required tag, click Apply
- To add Secondary Industries, navigate to Company Details > Classifications > Industry Classification and select either the GICS or MI Industry classification
- Uncheck the checkbox Search By Primary Industry Only and click Apply
Enhanced Peer Reports for Banks and Credit Unions
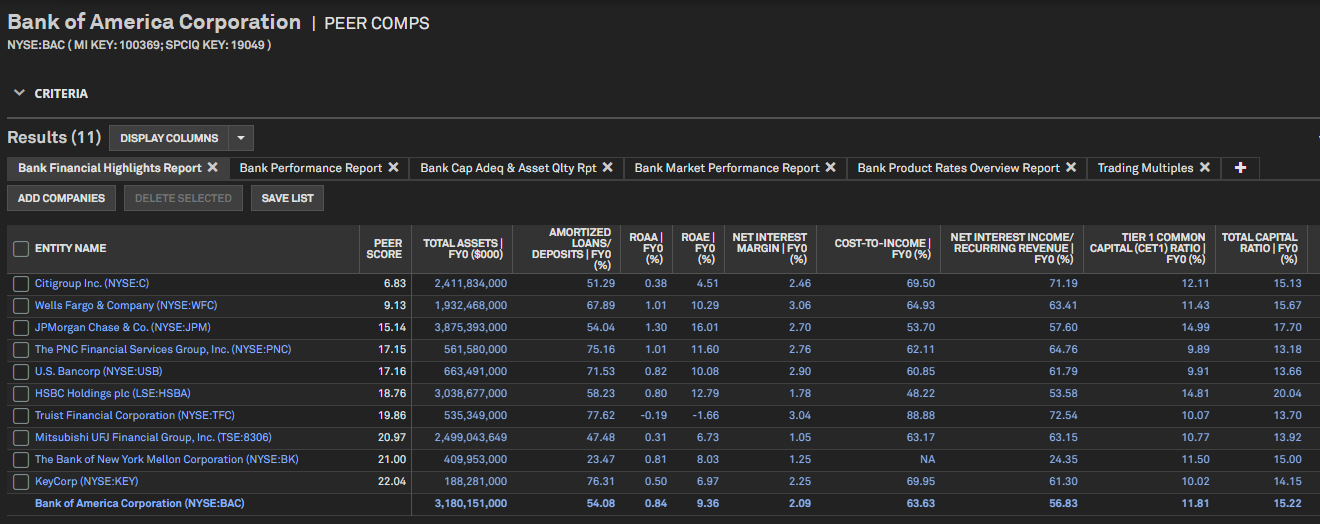
Users now have access to peer reports with key fields customized for US and non-US banks and Credit Unions. Additionally, users can add or remove relevant key fields from these peer reports to better align with their data requirements.
Find it in the platform:
- Search and add a US or non-US bank or Credit Union from the search bar
- Select Peer Comps from the left-hand navigation bar under Profile
- Click on Display Columns to add or remove key fields
S&P Capital IQ Pro Plug-in
In this release, we added Custom Beta, additional Beta metrics and market data information on inactive securities in S&P Capital IQ Pro Plug-in.
Custom Beta, and 1-Year, 2-Year, and 5-Year Beta
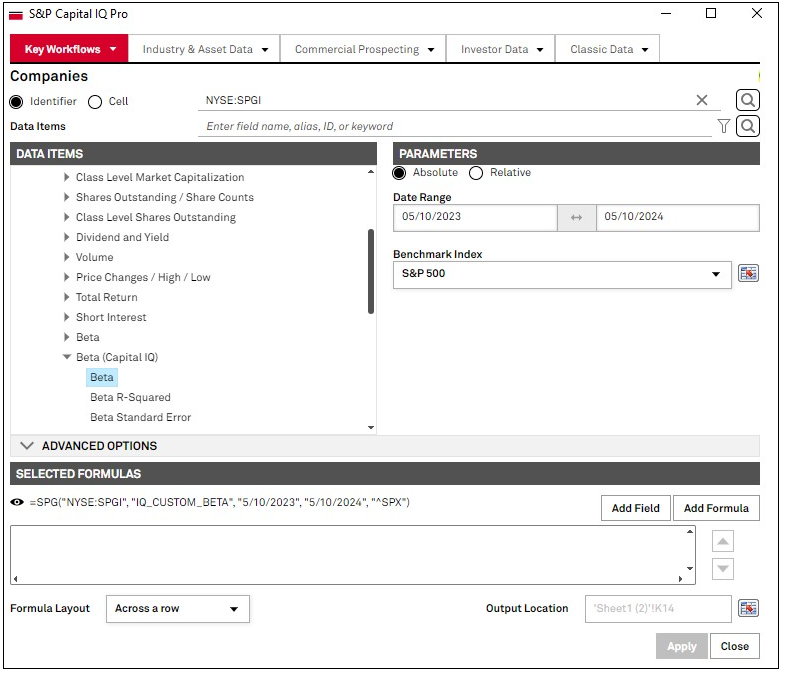
Users can now calculate custom Beta for a given company and index over a range of dates. Additionally, Beta functionalities in the S&P Capital IQ Pro Plug-in are expanded to include 1 year, 2 year, and 5 year Beta.
Find it in S&P Capital IQ Pro Plug-in:
- Launch S&P Capital IQ Pro Plug-in and open Formula Builder
- Under Data Items, navigate to Market Data > Equity Market Data > Beta (Capital IQ). E.g. Formula =SPG(“NYSE:IBM”, “IQ_CUSTOM_BETA”, “5/8/2023”, “5/8/2024”, “^SPX”)
- For Beta (IQ_CUSTOM_BETA), index is an optional parameter. If no index is specified, a default index will be used based on the trading exchanges as below:
- US stock exchange - S&P 500
- Canadian stock exchange - S&P/TSX Composite Index
- Emerging Markets stock exchange - MSCI EAFE (Developed Markets)
- Emerging Markets stock exchange - MSCI Emerging Markets
- Frequency is one month unless it is specified in the optional parameters
Inactive Securities
Users can now view and pull pricing data for inactive securities or historical (defunct) companies in S&P Capital IQ Pro Plug-in and Screener.
Find it in the platform:
- S&P Capital IQ Pro Plug-in:
- Launch S&P Capital IQ Pro Plug-in and open Formula Builder
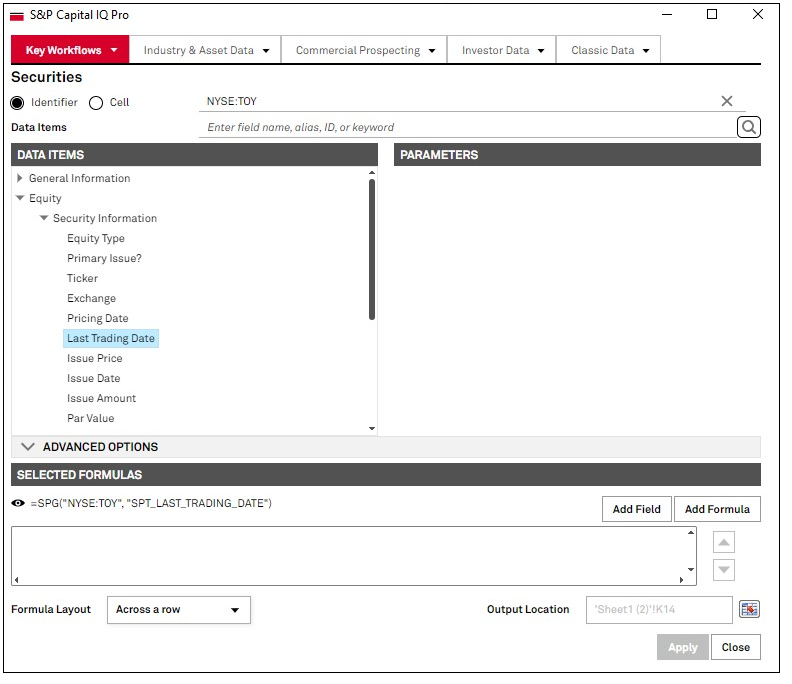
- Use a company ID, Exchange:Ticker[Inactive], Exchange:Ticker, ISIN, SEDOL, or CUSIP to retrieve market data or multiples data for inactive securities and historical companies. E.g. Formula =SPG(“NYSE:TOY[INACTIVE],”SP_PRICE_CLOSE”, “5/8/2001”)
- Screener:
- Navigate to Screener from the top navigation or the Apps menu
- Select Securities view, navigate to General Security Information to find new data items Equity Listing Active Status and Last Trading Date
Excel Template Library
In this release, we added several new or enhanced Excel templates to meet your data analysis needs.
Financed & Insured Emissions Data Miner (Per PCAF)
Corporate financed and insurance-associated emissions data miner aligned with PCAF recommendations, providing scalable extraction of GHG emissions, disclosure flags and financial data from Trucost's Environmental register and S&P Capital IQ Pro data. #ESG
Historical Multiple vs. Price Chart
Plot the pricing history of a company, along with desired price moving averages & also overlaying historical valuation multiples. #CIQ #charts #language
Bank & Credit Union Valuation
This model provides a quick valuation of a bank and a credit union by incorporating user inputs for operational and market variables and generating an estimated cash flow from either a stand-alone or acquisitive perspective.
Deposit and Loan Beta
Calculates deposit and loan beta, and deposit and loan growth rates for a focus company and peers over a specified time period. It also allows you to analyze an institution's reaction to changes in market rates using our standard rate products.
Basel III/IV Dashboard
This model allows you to benchmark the minimum capital requirement data against counterparties' actual capital ratios. It also indicates the Basel III implementation status country-wise.
Earnings Watch Dashboard
This model displays the performance of an index or list of companies during earnings season on the aggregate and constituent levels. It includes sector level as well as single company performance snapshots and the preview of upcoming earnings reports. #CIQ
S&P Cap IQ Pro Office Tutorial
This tutorial provides an overview of the basic functionality of S&P Cap IQ Pro, along with the details on each of the functions available in the Excel add-in.
U.S. Broadcast Station Quarterly Deal Metrics
A quarterly analysis of TV and radio station deal activity in the U.S. broadcast sector, including a breakout of deal volume in each state.
Custom Index Charts
This model allows users to create and chart custom indices price return, total return, and multiples comprised of companies of their choice & compare it against benchmark indices. #CIQ #charts
All Stat Entities - NAIC Statement (Industry)
Contains our entire offering of Health, Life, and P&C entities over a large array of NAIC exhibits for a single period. Each tab comes equipped with a ranking feature for rough Market Share analysis.
Life - Peer Market Share Analysis
Compares Premiums & Annuity, Market share, Benefit Ratio, growth among peers by LOB & State. View State & LOB concentration, Market share on US map; Market share & 10 yrs peer comparison by business type and Co. level analysis over different parameters.
Life - Market Share (All 50 States)
Life and A&H Market share for Life groups and individual companies with separate tabs for all 50 U.S. States. Additionally, the template features functionality to combine the premium data of Life and A&H for the U.S. states and geographic rollups.
June 2024 CIQ Pro Release Notes
June 2024 Capital IQ Pro Release Notes
- We integrated more than 19.4 million Government, Supranational, Agency, and Corporate securities from Markit, enhancing our Pricing, Analytics and Reference data coverage.
- We introduced Transcript Summarization, which provides a summary of earnings call transcripts organized by Topics and Sentiment that offers a comprehensive overview of the discussions within each call.
- We expanded our private markets offering by adding 14 new energy-related topic tags and added Preqin's Private Debt asset class on S&P Capital IQ Pro.
- We added the ability for users to automatically sync corporate and industry events within the Events Calendar to their personal calendars to seamlessly receive all related event updates.
- We added industry-level content for Banking, Insurance, Real Estate, Energy, and TMT
Marketplace Data & Solutions Communiqué
The Marketplace Data & Solutions Communiqué reflects developments in the S&P Global Marketplace, your discovery tool for differentiated data and robust solutions with an integrated support site.
Marketplace Data & Solutions Communiqué
Data: Leverage premium fundamental and alternative datasets available seamlessly, along with expert analysis, to accelerate your journey from data to insight.
Solutions: Gain maximum value from your big data with technology solutions designed to enhance your workflow, increase your insights, and complement your datasets. Our solutions, including Snowflake, Kensho NERD, Xpressfeed, Xpressfeed Loader, and API Solutions, help you make the most of all your data.
If you wish to subscribe, sign up on the Communiqué Marketplace site.


