
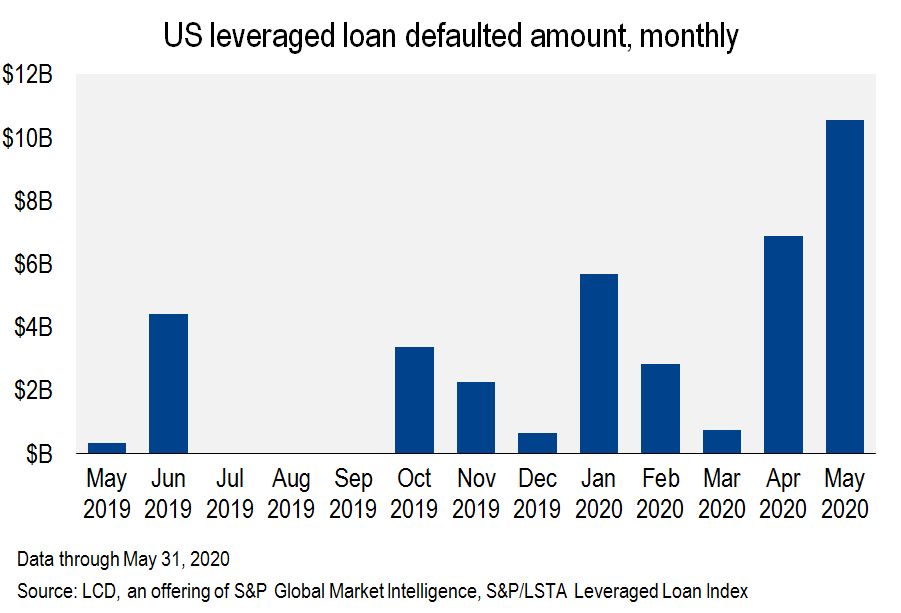
The $1.2 trillion U.S. leveraged loan market saw another $10.54 billion of defaults in May, the busiest month, by volume, for this activity since 2014. Following a record number of defaults in April, May crossed additional milestones: The 2.85% historical default average was breached for the first time in more than five years, and the Retail sector once again climbed to record highs.
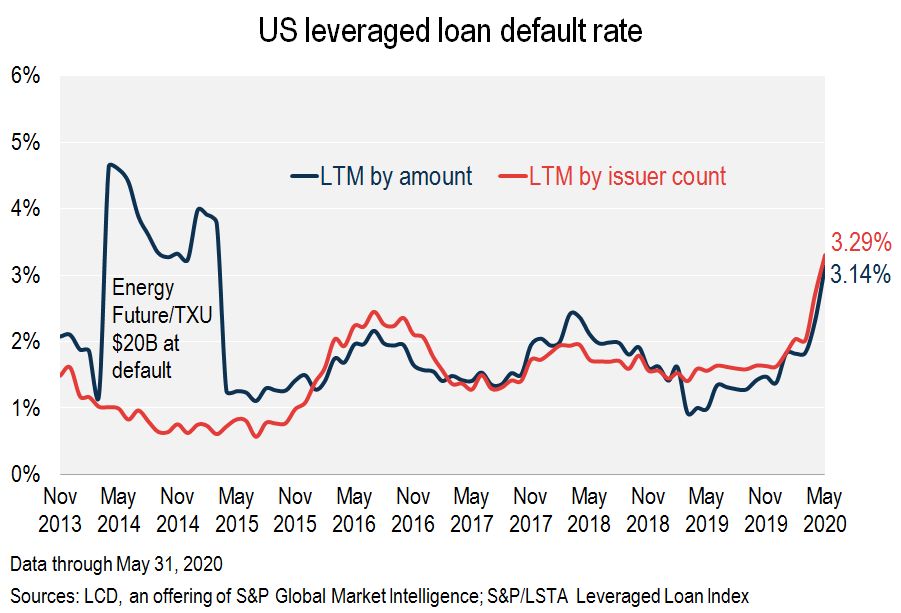
In the broader S&P/LSTA Leveraged Loan Index, the default rate by issuer count, at 3.29%, is now at its highest level since September 2010. By amount, the rate climbed to 3.14%, from 2.32% in April and 1.39% at the end of 2019.
 |
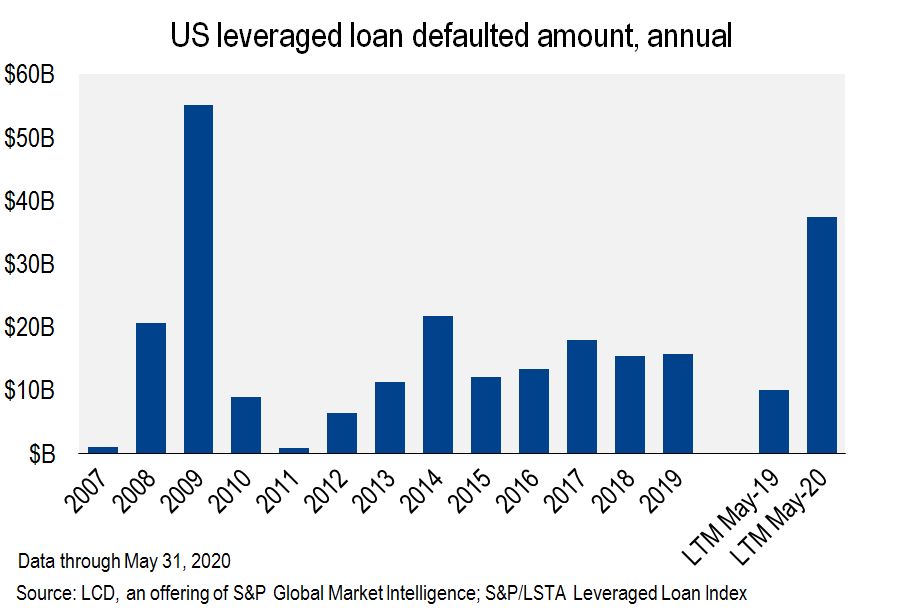
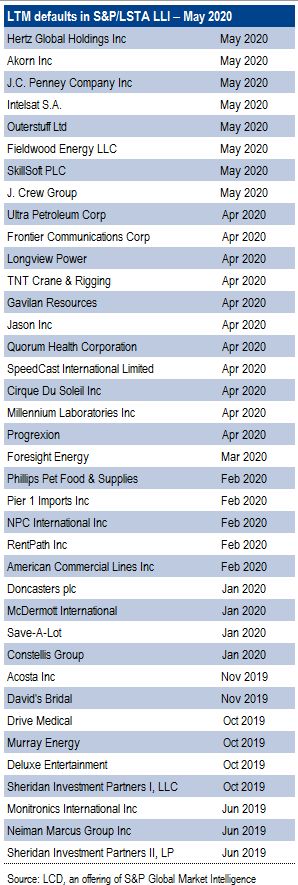
The eight new corporate defaults across 12 facilities lifted the trailing-12-month default volume in May to $37.4 billion, 271% ahead of last year’s pace.
 |
Car rental concern Hertz Global Holdings Inc. on May 22 became the eighth issuer in the S&P/LSTA Loan Index to default on its term debt in May.
 |
If discounting the outsized influence of the $19.5 billion default of Energy Future Holdings Corp
Moreover, the asset class, save for this one issuer, would have trailed its aforementioned historical average default rate for nearly 10 years.
Retail records
A trio of prominent retail chains in the U.S. — J. Crew
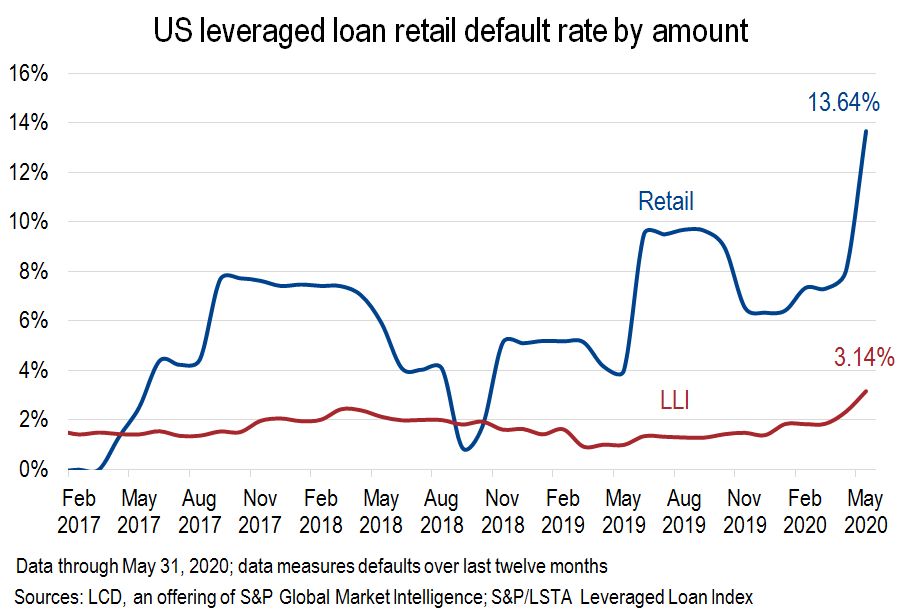 |
In terms of share across the index, Retail was unsurprisingly the biggest contributor of defaults in May, at 27%, followed by Telecommunications — made up solely of Intelsat
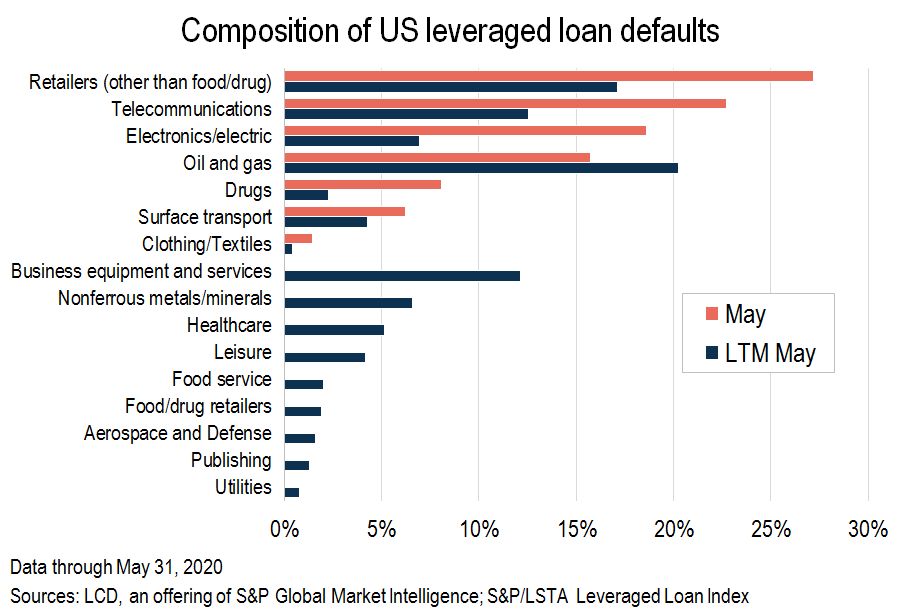 |
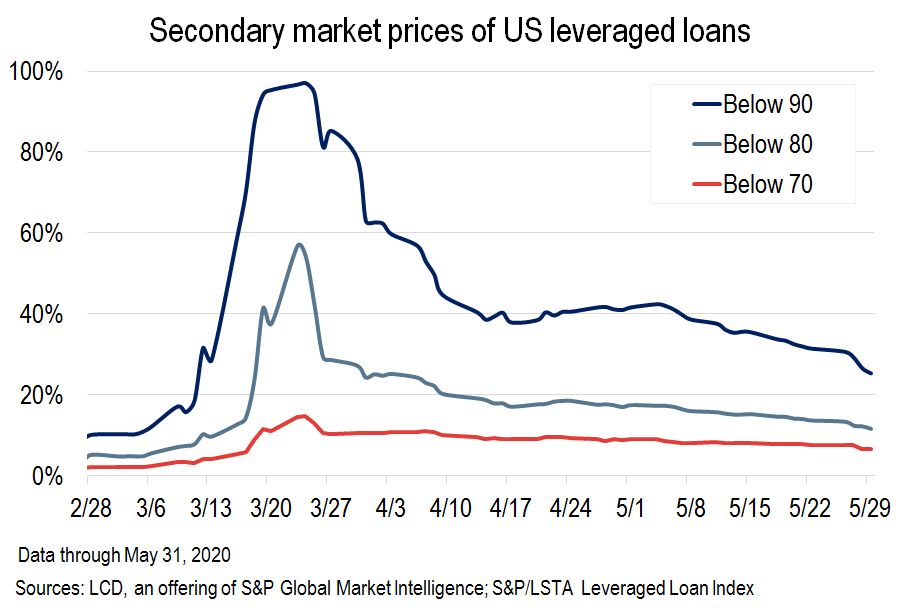
Forward measures continue to show a market that is pricing in an elevated period of defaults going forward.
The volume of loans below the anecdotal 80 measure of distress, at $134 billion,
As a result of the repricing of risk in the leveraged loan market from pre-coronavirus levels, almost no loans have been bid above par at the closing levels since March 13, and 25% of the market is still priced below 90, from just 10% at the end of 2019.
Twelve percent of loans are priced below 80, from just 4% at the end of 2019, and 6.5% below 70, up from 2%.
 |
 |
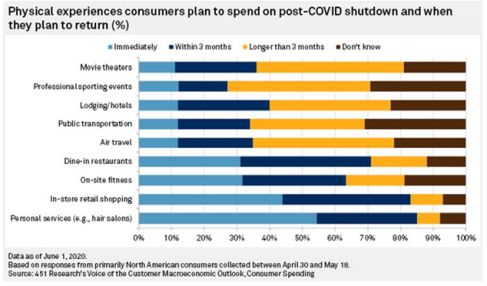
The survey, based on responses from 1,250 people collected between April 30 and May 18, primarily in the U.S. and Canada, found that 55% of respondents said they would immediately spend money at "personal services" establishments like hair salons and massage parlors. Forty-four percent of consumers surveyed by 451 Research said that they plan to start shopping at retail stores.
 |
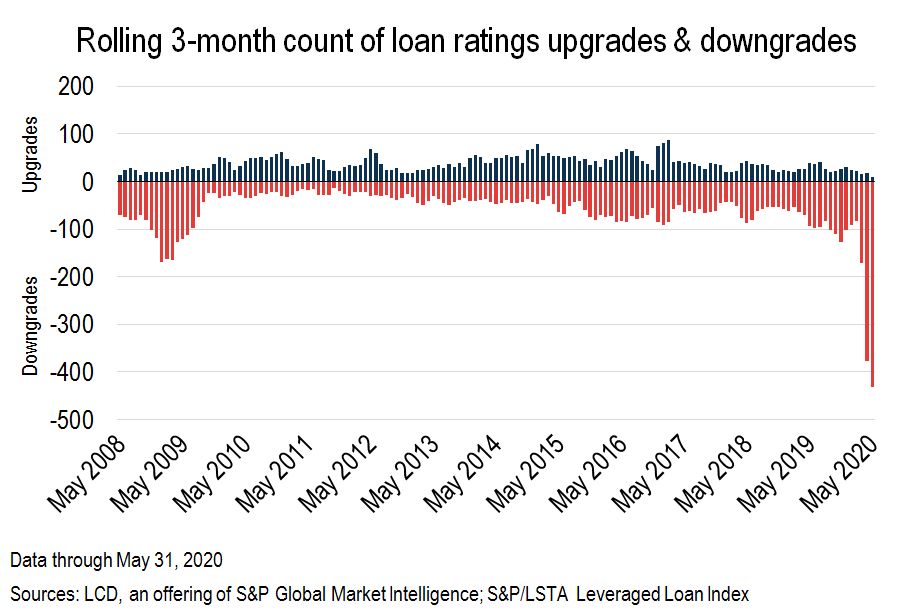
While the pace of downgrades slowed in May, to 90 loans, from a record 228 in April and 114 in March, it remains elevated by historical standards. December, by comparison, had just 26 loan downgrades.
On a three-month rolling basis, the ratio of downgrades to upgrades climbed to 43.2x in May—another record high reading. This is up from 22.1x in April, and 11.4x in March.
It was just 3.8x in February.
 |
Given the mounting downgrades, the composition of the B– cohort has changed significantly. Out of the $269 billion in loans currently occupying this ratings bucket, $79.4 billion, or roughly 30%, have been downgraded to this level since March 1.
For comparison, only 17% of B flat outstandings come from post-coronavirus downgrades ($55 billion out of $320 billion). The CCC+ bucket saw the biggest impact from the recent spike in downgrades—out of the $86.6 billion outstanding, 71%, or $61.9 billion, resulted from a downgrade in the last three months.
 |
 |
This story was written by Rachelle Kakouris, of LCD's Research group.