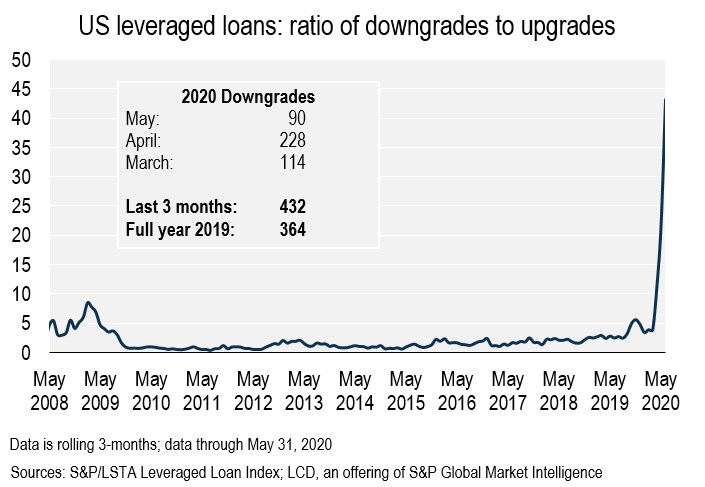
The impact of the COVID-19 pandemic — yet to fully play out in terms of corporate earnings — is reflected in the record speed of downgrades by rating agencies. The three-month rolling downgrade count of loan facilities in the S&P/LSTA Leveraged Loan Index outpaced the rate of upgrades by a ratio of 43 to 1 in May.
 |
The fallout of this current downgrade cycle is multifaceted. Collateralized loan obligations, the largest investor segment in the $1.2 trillion U.S. leveraged loan asset class, are exceeding their structural limits for lower-rated debt at eye-watering numbers. The repricing of downgraded companies' debt, and the increasing challenge for lower-quality loans to find a home, will undoubtedly make traditional funding more prohibitive for these issuers, while the ratings quality mix of the market continues to worsen.
Request a demo of LCD to see more of the top leveraged finance stories from 2020
Click hereAs a leading indicator, rising downgrades also typically precede a period of increased defaults.
During the Great Financial Crisis, the three-month rolling count in favor of downgrades peaked at just 8.45x.
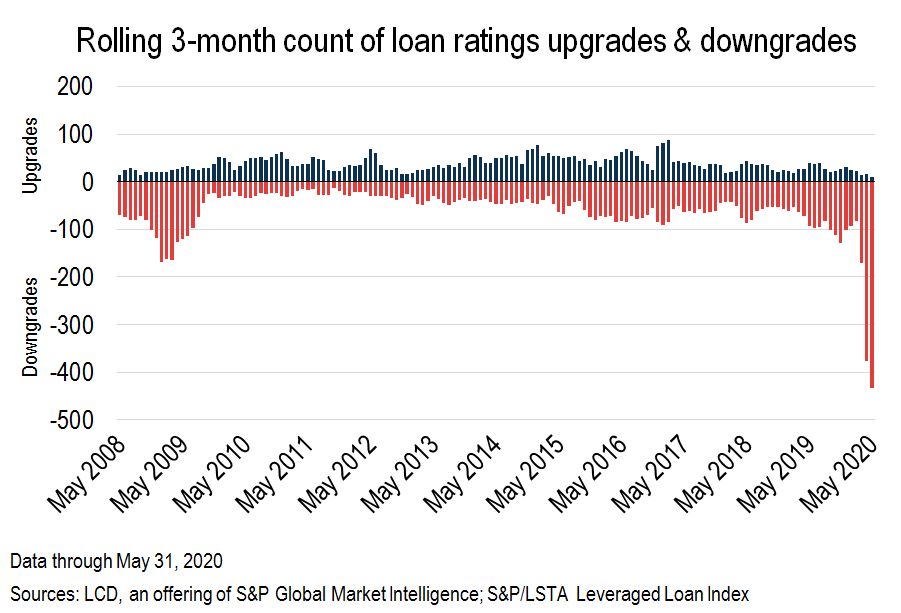
While the count of loan facility downgrades by S&P Global Ratings slowed to 90 in May, it followed a record 228 downgrades in April and a previous record of 114 in March. Even with the full effects of COVID-19 and its harm to the global economy still unknown, the past three months alone have outpaced the full-year 2019 downgrade total of 364 loans by 19%.
That figure was up from 244 in all of 2018 and 231 in 2017.
 |
Request a demo of LCD to see more of the top leveraged finance stories from 2020
Click herePutting these numbers into further perspective, the highest monthly downgrade count was 81 issues during the Great Financial Crisis, which at the time represented 9.3% of the rated facilities.
At the April 2020 peak, the 228 downgrades represented 16.3% of the 1,397 rated facilities, showing clearly the increasing instances of downward rating actions.
Moreover, through May, 32% of the loan market by par amount outstanding at the facility level had received a ratings downgrade, representing $368.61 billion of the $1.169 trillion of rated loans at the end of 2019.
In the 12-month measure through May, the ratio of downgrades to upgrades rose to 8.53x, well beyond the ratio at the end of 2019 of 3.17x, and the 2009 peak of 5.29x.
The downgrades that have come at breakneck speed are also predominantly at the lower end of the ratings spectrum, changing the composition of the B- cohort significantly.
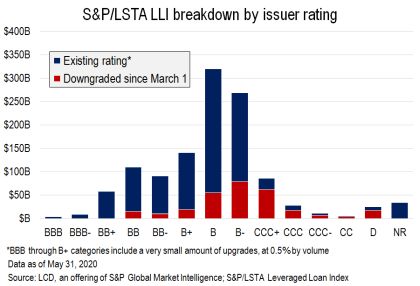 |
Out of the $269 billion in loans currently occupying this ratings bucket, $79.4 billion, or about 30%, have been downgraded to this level since March 1.
For comparison, only 17% of B flat outstandings come from post-coronavirus downgrades ($55 billion out of $320 billion).
The CCC+ bucket saw the biggest impact from the recent spike in downgrades — out of the $86.6 billion outstanding, 71%, or $61.9 billion, resulted from a downgrade in the last three months.
Sectors with the most downgrades this year include Leisure (11.4%), Business Equipment & Services (8.8%), Industrial Equipment (7.8%), Healthcare (6.5%), Electronics/electric (6.5%), Non-food and Drug Retailers (6.1%), and Oil & Gas (5.9%).
Request a demo of LCD to see more of the top leveraged finance stories from 2020
Click here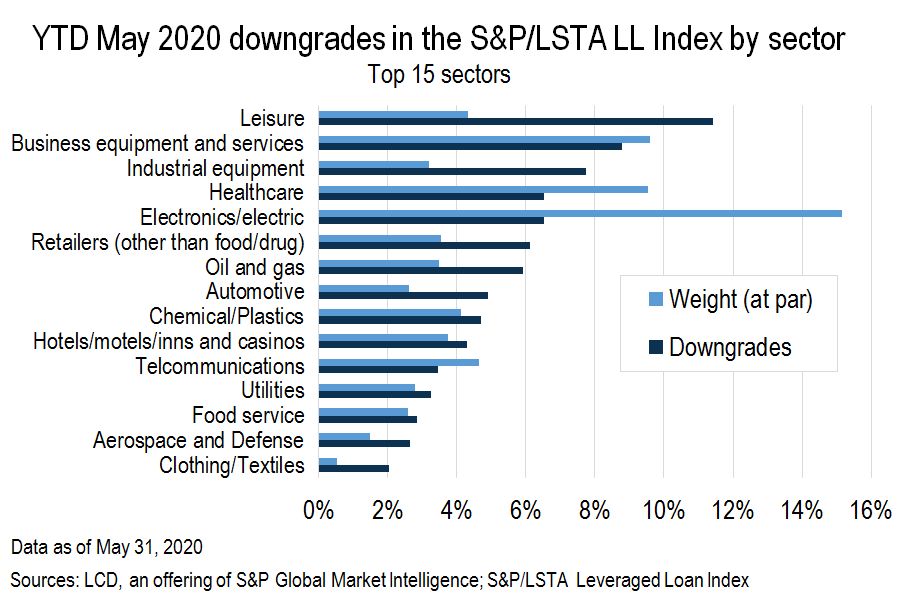 |
Worth noting, Leisure, newly topping the table for downgrades, made up only 4.14% of the loan market in 2019, and Industrial Equipment 3.15%. Business Equipment & Services, Healthcare, and Electronics/electric are three of the largest sectors in the S&P/LSTA Leveraged Loan Index, with shares at 9.4%, 9.7%, and 14%, respectively.
Autos and Hotels & Casinos, meanwhile, did not feature in the top 15 of downgraded sectors before the COVID-19 crisis. They now have a downgrade share of 4.9% and 4.3%, respectively.
This downgrade cycle has also further worsened the ratings mix of the leveraged loan market, with the share of issuers in the S&P/LSTA Leveraged Loan Index rated B- or lower climbing to 33.5% as of May 31, the highest reading ever.
This stood at just 10% five years ago.
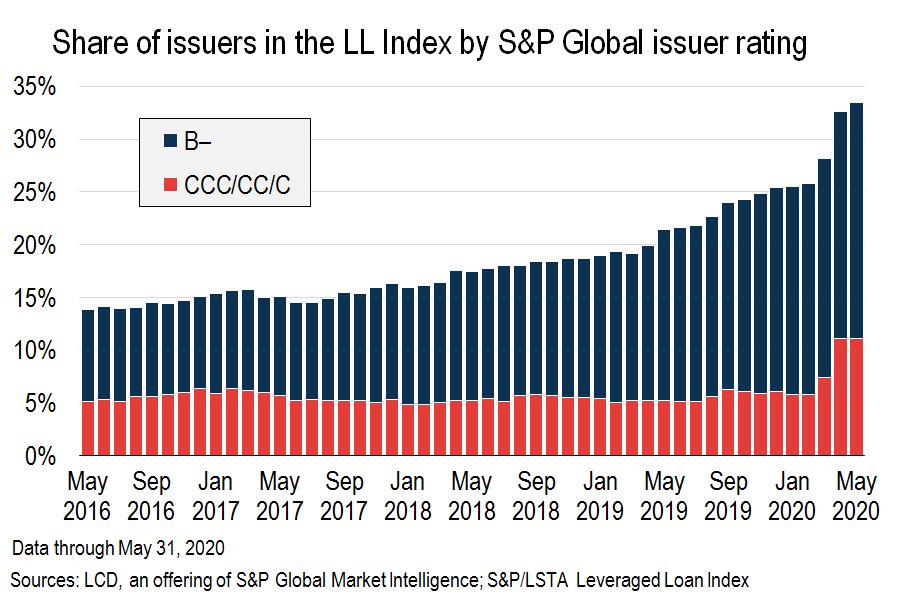 |
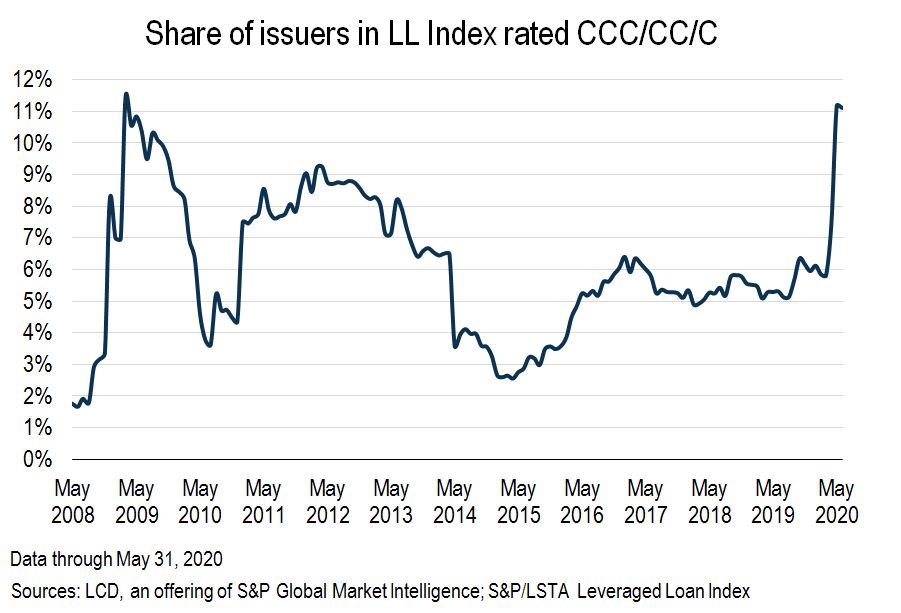
Loans whose issuers are rated CCC, CC or C now make up a record 11% of the index, unchanged from April, and significantly higher than the 2.9% of the market five years ago. This is a particular pain point for CLOs.
 |
Rising downgrades, as mentioned earlier, typically precede a period of rising defaults. The below chart shows how the default rate and the downgrade/upgrade ratio have cycled historically. The downgrade/upgrade ratio averaged 2.7x in the six months before the November 2009 default peak of 8.25% (on an issuer basis).
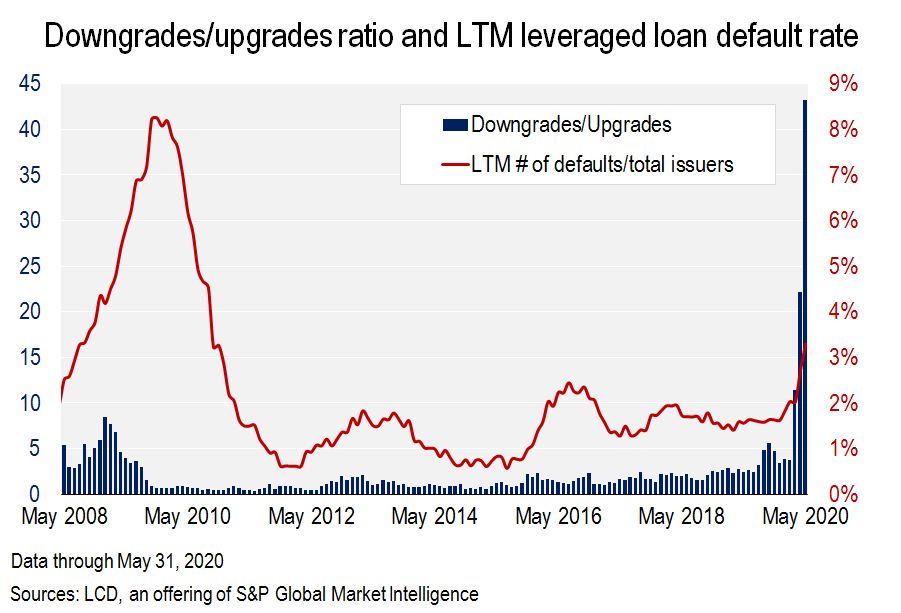 |
Despite the current 43x downgrade ratio, loan defaults have only just surpassed their historical 2.85% average. Nevertheless, the default rate by issuer count, at 3.29%, is now at its highest level since September 2010. By amount, the rate climbed to 3.14%, from 2.32% in April, and 1.39% at the end of 2019. (See "Loan default rate passes historical average in May; volume tops $10B," LCD News, June 1, 2020.)
CLObbered
The heady pace of downgrades has extensive implications for the CLO market, the largest group of investors in the leveraged loan market by far, accounting for 71% of allocations in 2019.
While CLOs typically are sticky in terms of limited forced selling, with most not required to mark-to-market, a typical CLO can only hold 7.5% of the collateral pool in triple-C debt, while B- rated paper with a negative outlook is treated as triple-C for a CLO's weighted average rating factor, or WARF, test, although the debt does not fall into the triple-C bucket.
Once the triple-C basket limit is reached, the excess loans will see a haircut to their par value for overcollateralization tests, which can divert interest payments away from CLO equity and junior tranches.
To that end, unsurprisingly, the credit profile of U.S. CLO collateral pools has shifted rapidly over the past several months, with "almost all of the deals within S&P's CLO Insights 2020 Index exceeding the 7.5% 'CCC' threshold" by May 25, according to a June 1 S&P Global Ratings report titled "Under Stress: Assessing CLO Manager Performance During COVID-19."
The report noted that this shift in Ratings' portfolio exposures across its CLO Insights 2020 Index of 410 U.S. S&P Global Ratings–rated reinvesting broadly syndicated loan (BSL) CLO transactions has unfolded more rapidly over the past several months than at any other point in the history of the CLO market.
According to the report led by analysts Daniel Hu and Stephen Anderberg, CCC rated buckets in Ratings' analysis increased to 12.25% as of May 25, 2020, from 4.13% as of March 1, 2020, while exposure to nonperforming assets increased to 1.35%, from 0.63%. Together, these exposures increased by 8.84%.
Due to the downgrades, as well as market value haircuts, and par loss, the average junior overcollateralization cushion meanwhile declined from 3.73% at the start of March to 1.63% (a decline of 2.10%), with about 17% of CLO transactions in the index failing as of the publication date.
However, if the CCC buckets were 1.23% higher, it is likely a few more deals would have failed their O/C tests. As of the CLO trustee reports available May 25, about 17% of the CLO transactions within S&P Global's index are failing one or more of the tranche O/C tests, while another 7% were passing but currently have less than 50 bps of cushion for their junior O/C test.
By turning over 8.75% of the portfolio, managers were able to reduce their CCC and nonperforming exposures by about 1.23% at the cost of 21 bps in par. These trades likely saved a few deals from failing their junior O/C tests.
Looking ahead, while the Federal Reserve's backstop is undoubtedly helping to ease the liquidity pressures of companies impacted by COVID-19, this source of liquidity, and access to the traditional markets, is more constrained for leveraged loan issuers. Moreover, the quantifying data around the impact of the shutdown of economic activity and cash flow generation will not fully be known until the next set of earnings reports. As such, downgrades are expected to continue. At the lower rung, Morgan Stanley strategist Srikanth Sankaran expects that nearly a fifth of the loan market could transition to CCC as a result.
This story was written by Rachelle Kakouris. Rachelle, a Director for LCD Research, covers distressed debt.


