U.S. corporate credit quality has soured noticeably over the past year or so, with leveraged loan defaults more than tripling over that period — to 4.16% from 1.29%, by amount, according to the S&P/LSTA Leveraged Loan Index — while downgrades have outnumbered upgrades nine to one, according to LCD.
Indeed, as of Sept. 22, roughly a third of all currently outstanding loans belong to borrowers rated B- or lower (excluding those rated D), up from 23% a year earlier. Meanwhile, the global pandemic has compressed loan borrower EBITDA growth more drastically than during the Great Recession in 2009.
What do these worsening metrics mean for the prospects of leveraged loan recoveries, a key metric in the $1.2 trillion asset class? According to LCD's analysis, based on S&P Global's LossStats, compared to the last several years, discounted recoveries on defaults have fallen, though the sample remains select.
Request a walk-through of this content to see the 30+ years of exclusive data that powers this study
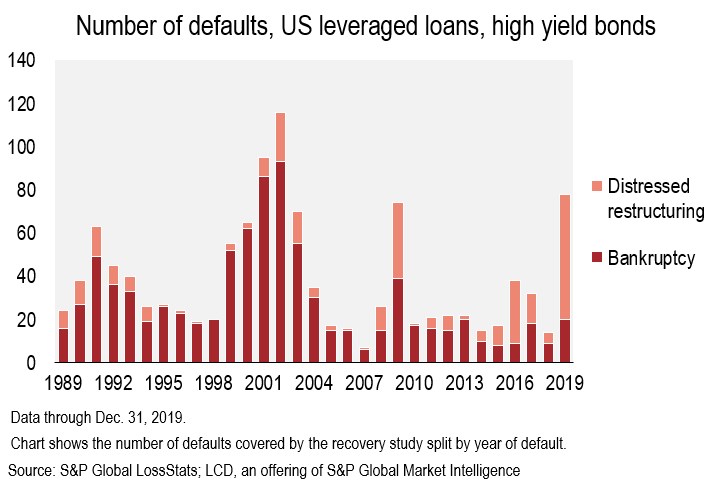
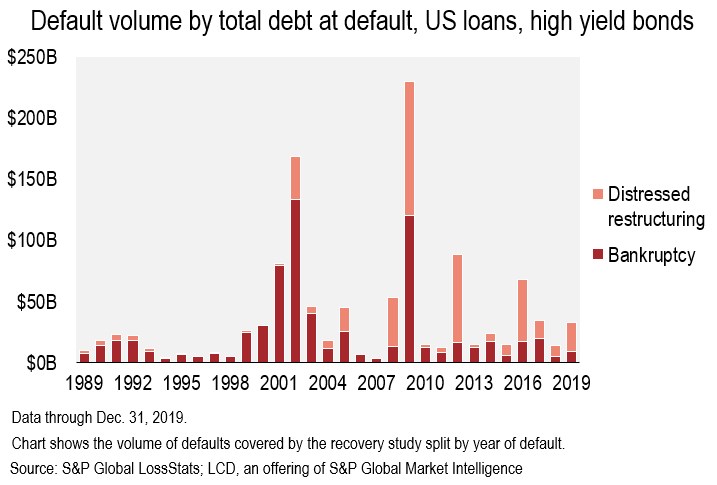
Sign up nowSome specifics about LossStats: Since the last study, conducted in the summer of 2019, LossStats has added to its coverage the ultimate recovery rates of 26 defaults, covering 113 leveraged loan and high-yield debt instruments. Of these defaults, 16 resulted in bankruptcies and 10 in distressed exchanges. The vast majority of new additions came from companies defaulting in 2019, with the Oil & Gas and Retail sectors together accounting for roughly half of that cohort. This brings the total defaulted debt covered by LossStats to $1.1 trillion over 32 years.
 |
 |
The LossStats database appraises recoveries and, after the debt markets have had the opportunity to absorb and evaluate the instruments, recoveries are determined by valuing the instruments at three different points in the recovery process: emergence, settlement, and liquidity event. The ultimate recovery number used in this analysis reflects the earliest of the identifiable points.
For the purposes of this analysis, LCD uses discounted recoveries, as opposed to nominal. Because restructurings can drag on for years, eliminating the noise of time is important to maintain comparability. The discounted recovery time values the nominal recovery back to the date of default, using the pre-petition default rate, normalizing recoveries over long periods of analysis and creating parity among the recovery outcomes from various events.
Recoveries
Of the 113 instruments added to the database in the last year, 42% are bank loans, while the rest are bonds. The 47 loans include 14 covenant-lite instruments and seven second-lien loans. The bonds include 13 senior secured tranches, 44 senior unsecured bonds, seven senior subordinated tranches and two subordinated tranches.
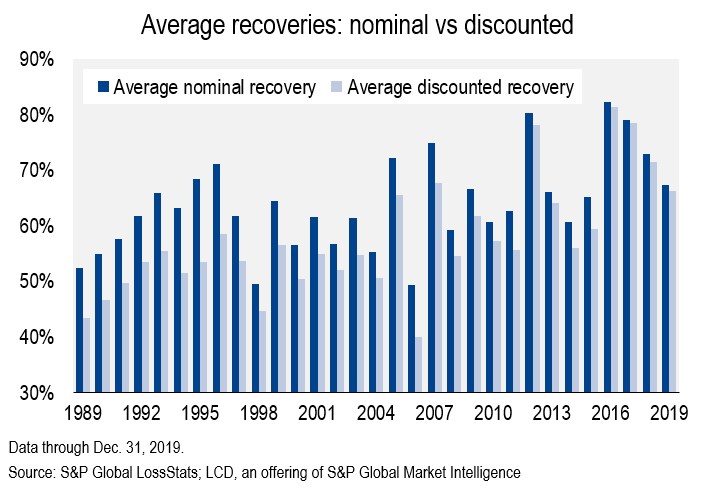
The average nominal recovery for the newly added instruments across bonds and loans is 67.4%, while the average discounted recovery is 66.3%. This compares with an average nominal recovery of 66% and an average discounted recovery of 59% across all instruments tracked for this analysis historically. However, looking at a shorter time period, recoveries have declined in each year since 2016. This is because the share of distressed exchanges in the cohorts has declined in each of the last four years, and the time in bankruptcy has increased. In general, the faster the restructuring process, the more beneficial it is to lenders.
 |
At the same time, recoveries on only bank loans underperformed the historical average. The average nominal recovery for the newly tracked loans is 75.2%, and the average discounted rate is 74.4%. This is below the historical average nominal rate of 86% and the historical average discounted rate of 79%.
Recoveries on defaulted loans are influenced by many factors, including the stage of the credit cycle, time spent in bankruptcy, an issuer's capital structure, and of course the collateral available to recover. Some of the factors in last year's sample offer insight into lower recoveries within that cohort. For example, these relatively recent bank loans had a lower debt cushion than is the case historically, 26% versus 43%, respectively, and contained a higher concentration of covenant-lite term loans than seen previously (14 out of 47). As we will discuss later, both of these factors impact recoveries. That said, the sample size is relatively small — 47 bank loans that were added to the study last year represent 26 default events.
Cov-lite loans have less lender protections than do traditionally covenanted loans, and have become a lightning rod for criticism of the asset class. Their impact on loan recoveries, in cases of default, has been a major topic of concern over the past decade. As of Aug. 31, roughly 80% of all U.S. leveraged loans outstanding were cov-lite.
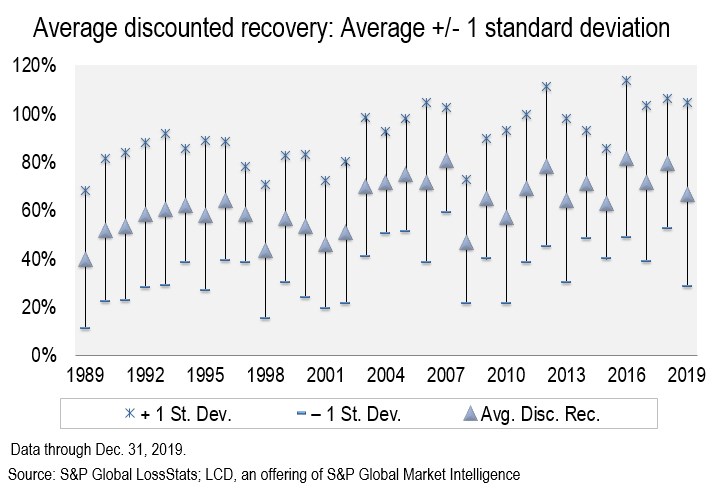
Looking at the recoveries data by default year vintage shows a decline in recoveries for last year’s cohort. With the historic, decade-long expansion showing clear signs of stalling, the average discounted recovery for 2019 defaults is 67%, down from the 71%-81% range between 2016 and 2018. In addition, the standard deviations around the average for the 2019 cohort has widened.
 |
Looking at the other metrics tracked for this analysis, the broad recovery levels are unchanged by the new additions to the data set. As mentioned in prior studies, debt cushion and seniority have a direct impact on recoveries. The more subordinated debt there is to the defaulted instrument, the stronger the recovery.
For all debt types, instruments with more than 75% of the capital structure subordinated to its position had an average discounted recovery of 91%. This dropped to 82% for those with a 51%-75% cushion, to 69% for a 26%-50% cushion, and to 49% for those with a cushion of 25% or less.
 |
Bank loans, which benefit from the senior secured position, performed much better across all debt cushion buckets. Having a first-lien claim on security further boosts recoveries. Loans with more than a 75% cushion have a 94% average discounted recovery, with a coefficient of variation of just 0.18. The average discounted recovery is 87% for bank loans with a 51%-75% cushion, 73% for those with a 26%-50% cushion, and 69% for a cushion of 25% or less. Clearly, while more subordinated debt is better for bank loan recoveries, the reality is that any debt cushion boosts recoveries.
Similarly, senior secured loans outperform all subordinated debt, as bank loans have an average discounted recovery of 79%, versus 47% for bonds. Likewise, revolvers outperform term loans (because of their relationship to debtor-in-possession funding), while first-lien outperforms second-lien.
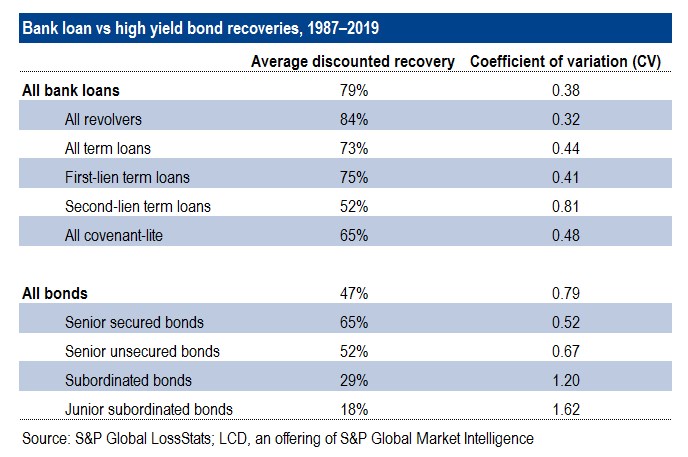 |
The 14 new cov-lite facilities in last year's cohort bring the total count of these instruments tracked by LossStats to 65. Although the data set for cov-lite defaults/recoveries remains thin, relative to other types of debt tracked for this analysis, the average recovery on these deals has declined to 65%, from 69% a year ago. That's less than the bank loan average, as well as that for term loans and first-liens. It remains considerably higher than the average of all bonds, but falls in line with the average discounted recovery of senior secured bonds.
In prior LossStats studies, the average discounted recovery for cov-lite was higher because the cov-lite debt primarily came from the pre-credit crunch boom. Back then, cov-lite deals were available only to higher-quality issuers. Indeed, in 2007, just 29% of new-issue volume lacked maintenance covenants, versus the 75% average in 2013–2019. All of the cov-lite facilities that were added to the recovery study last year were from 2013 or later.
In addition, as LCD reported earlier this year, the share of deals issued with only first-lien debt has climbed consistently over the last 10 years. As a result, the newer cov-lite facilities are more likely to have lower debt cushions, meaning less debt sitting below the cov-lite loan to absorb losses, in case of default. Looking at the data, the cohort of cov-lite issued after the credit crunch — the 2.0 incarnation — remains thin, at just 39 observations. However, the data indicate that these loans have underperformed cov-lite 1.0 loans, with an average recovery of 59%, versus 77% for those issued prior to 2010. These 39 loans had an average debt cushion of roughly 15%, vs. 32% for 2004-2010 cohort.
 |
To put these numbers in perspective, the average discounted recovery rate for all bank loans issued between 2004 and now is 80%. For senior secured bonds (excluding those secured by 2nd-lien and 3rd-lien debt), that average is roughly 75%.
Shifting gears, let's consider how company size influences recoveries.
LCD tracked pro forma financials for default events in LossStats, and focused on cash flow in the pre-petition transactions. The results were consistent with previous studies. When looking at pro forma EBITDA, negative- or zero-EBITDA structures had the lowest ultimate recoveries, but large corporate credits (transactions with more than $50 million in EBITDA) recovered slightly less, on average, than did middle market credits (transactions with $50 million or less in positive EBITDA).
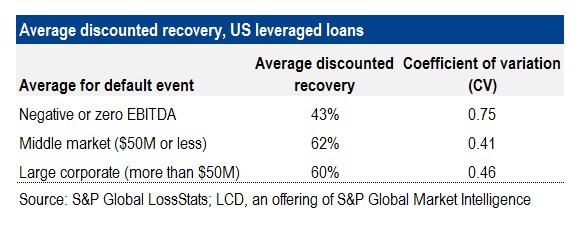 |
For a single default event, this study averaged the ultimate recovery levels for all pre-petition debt in a single default event. Companies with zero or negative EBITDA had the lowest ultimate recovery, with an average of just 43%, versus the average of 62% for middle market companies and 60% for large corporate borrowers.


