
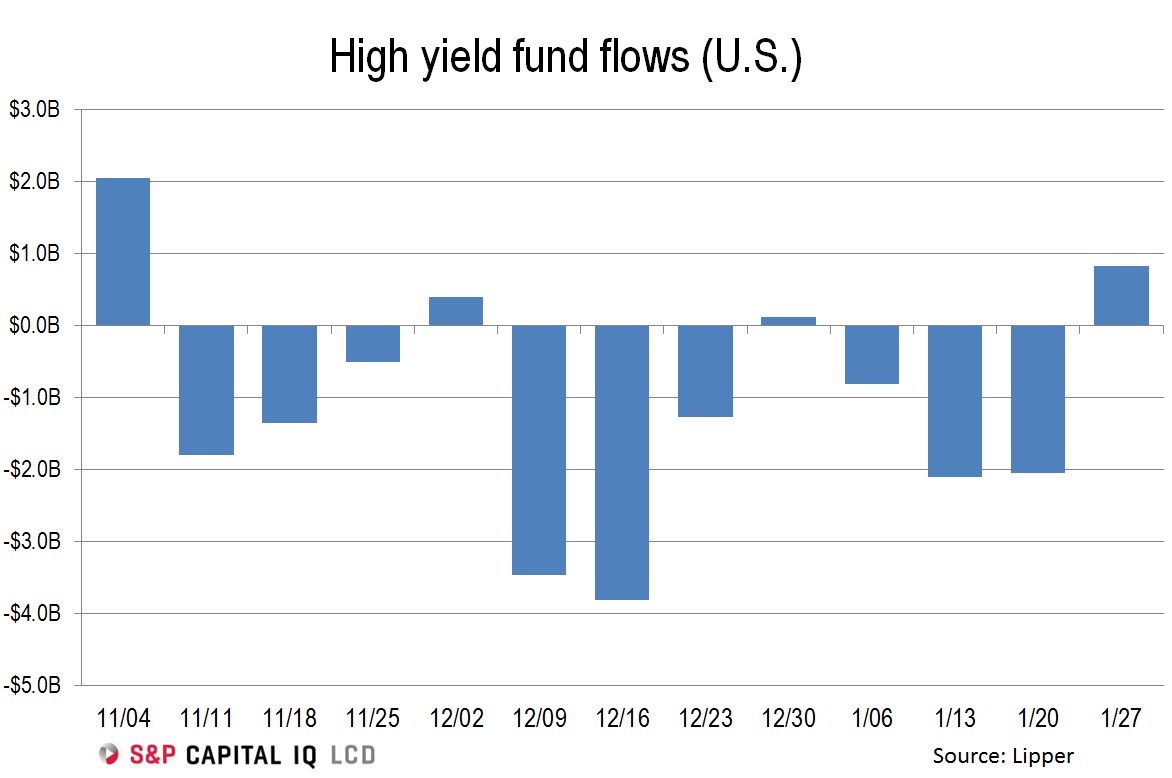
U.S. high-yield funds recorded a net inflow of $883 million in the week ended Jan. 27, marking the first positive reading in four weeks. Still, the inflow barely dents last week outflow of $2 billion, not to mention the combined outflows of $4.9 billion over the prior three weeks.
The net-positive reading was all tied to exchange-traded funds, however, as mutual funds netted an outflow of $661 million against ETF inflows of $1.5 billion. This is the first ETF-inflow inverse reading in five weeks; all three prior outflow were both ETF and mutual fund related.
Regardless of what that might say about market-timing, hedging, and fast-money activity, it’s a net inflow that draws down the trailing-four-week average to negative $1 billion per week, from negative $1.2 billion last week. Recall that prior to the December outflow streak, the trailing-four-week observation was positive $231 million in mid-November.
With steady outflows for the new year beyond this past week’s inflow, the year-to-date outflow total is now $4.1 billion, with 29% related to the ETF segment. The full-year 2015 reading was deeply in the red, at negative $7.1 billion. The full-year reading was negative $7.7 billion for mutual funds against positive $686 million for ETFs, for a roughly 10% inverse reading.
Alongside this past week’s inflow and stronger momentum in the secondary market, the change due to market conditions over the past week was the positive $3.1 billion, the strongest in 67 weeks, or since an increase of equally $3.1 billion in the week ended Dec. 10, 2014. This week’s expansion is nearly a 2% gain against total assets, which were $172.1 billion at the end of the observation period.
At present, the ETF segment accounts for $32.8 billion of total assets, or roughly 19% of the sum. — Matt Fuller
This story first appeared on www.lcdcomps.com, LCD’s subscription site offering complete news, analysis and data covering the global leveraged loan and high yield bond markets. You can learn more about LCD here.