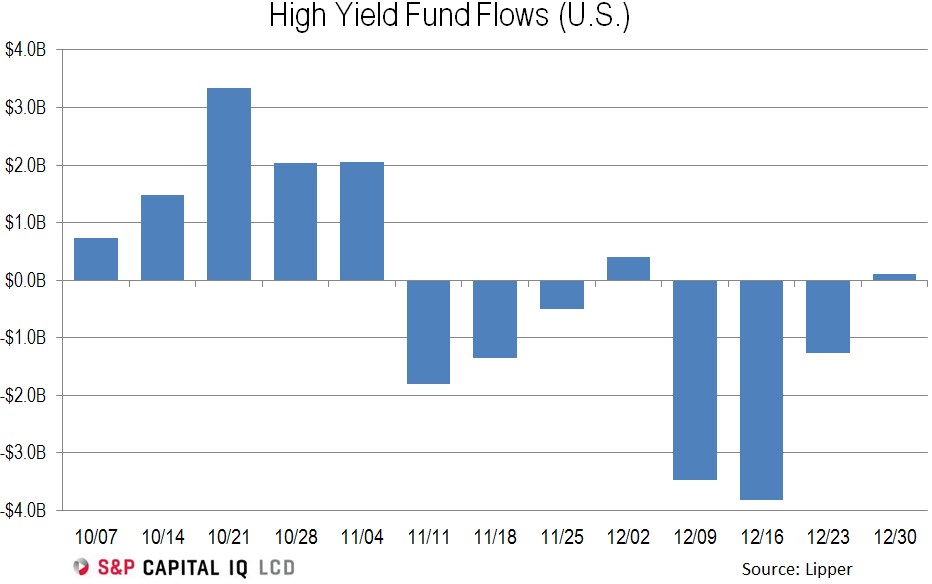
U.S. high-yield funds saw a small net inflow of $114 million to close the year in the week ended Dec. 30, according to Lipper. The modestly positive reading follows an outflow of $1.3 billion for the week ended Dec. 23, which itself was a third-consecutive negative reading, for a combined outflow of $8.5 billion over that span.
The net infusion for the final week of the year was technically an outflow of $308 million from mutual funds filled back in with a $422 million inflow to the ETF segment, or inverse 370%. The prior week was roughly an even split between the two groups, at 58% and 42% respectively, according to Lipper.
Although last week was a small net positive, the trailing-four-week average deepened to negative $2.1 billion, from negative $2 billion two weeks ago, and negative $1.8 billion three weeks ago. Prior to the December outflow streak, the trailing-four-week observation was positive $231 million in mid-November.
The full-year 2015 reading closed deeply in the red, at negative $7.1 billion, with an inverse measurement to ETFs. Indeed, the full-year reading is negative $7.7 billion for mutual funds against positive $686 million for ETFs, for an inverse 10% reading. Last year, the full year report was squarely negative, at $6.3 billion of outflows, with 1% ETF–related.
As with the final-reading inflow, the change due to market conditions last week was positive for the first time in four weeks, at $114 million, but that was essentially nil against total assets, which were $179.2 billion at the end of the observation period. The prior week measurement was the opposite, at negative $442 million.
At the close of 2015, the ETF segment accounted for $34.5 billion of total assets, or roughly 19% of the sum. — Matt Fuller
Check out www.lcdcomps.com for more leveraged loan/high yield bond market news and analysis.


