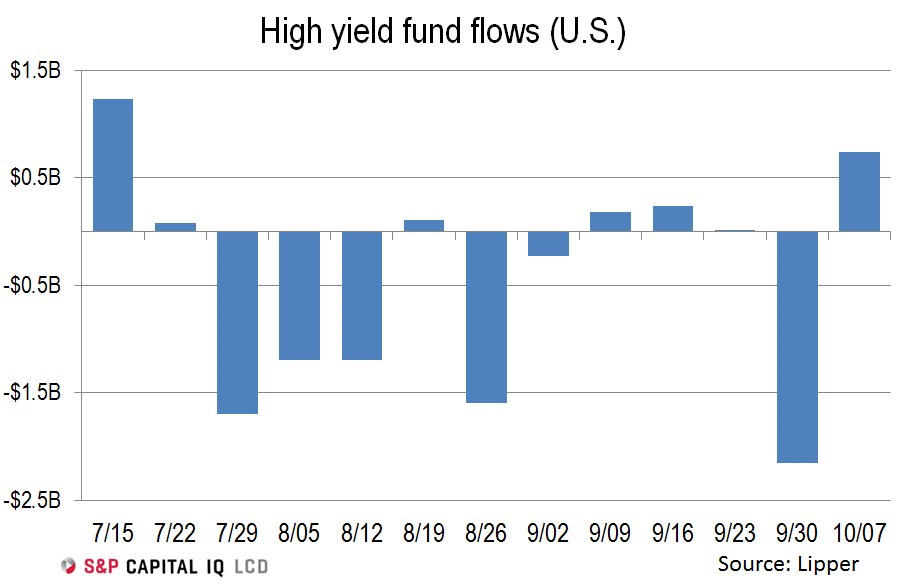
Retail cashflow for U.S. high-yield funds turned back into positive territory with a net inflow of $735 million in the week ended Oct. 7, according to Lipper. The inflow barely dents the $2.2 billion withdrawal last week, but it’s the fourth inflow over the past five weeks for a net outflow of $977 million over that span.
The net inflow masks an underlying dynamic that could suggest market-timing, hedging strategies, and fast-money investors in the asset class. Indeed, the mutual fund segment was negative $675 million this past week, but it was filled in and overblown by a whopping $1.4 billion infusion to exchange-traded funds, for nearly a double-inverse reading. This uneven measure also occurred two weeks ago and five weeks ago, the Lipper data show.
Regardless, the net flow figure is positive and thus moderates the trailing-four-week average to negative $291 million per week, from negative $428 million last week, although positive $53 million two weeks ago. Recall that last week’s average was the most negative in four weeks at the time.
The full-year reading is now negative $4.3 billion, with just 7% of that ETF-related. Last year, after 40 weeks, there was a net outflow of $5 billion, with 21% of the withdrawal tied to ETF redemptions. Recall that last year’s sum total outflow at this point in the year included the all-time record $7.1 billion outflow in the week ended Aug. 6, 2014.
The change due to market conditions last week was strong, at positive $2.2 billion amid the market rebound. That’s roughly positive 1.2% against total assets, which were $186.3 billion at the end of the observation period. Take note that last week’s negative $3.2 billion change, or nearly negative 2% amid the market sell-off, was the largest one-week plunge in 120 weeks, or roughly 2.3 years, dating to a $3.7 billion deterioration in the week ended June 26, 2013.
At present, ETFs account for $35.2 billion of total assets, or roughly 19% of the sum. — Matt Fuller


